. 2015 Feb 12;160(4):785-797.
doi: 10.1016/j.cell.2015.01.027. Epub 2015 Feb 5.

Manipulating the selection forces during affinity maturation to generate cross-reactive HIV antibodies

Affiliations

Manipulating the selection forces during affinity maturation to generate cross-reactive HIV antibodies

Shenshen Wang et al. Cell. .

Abstract

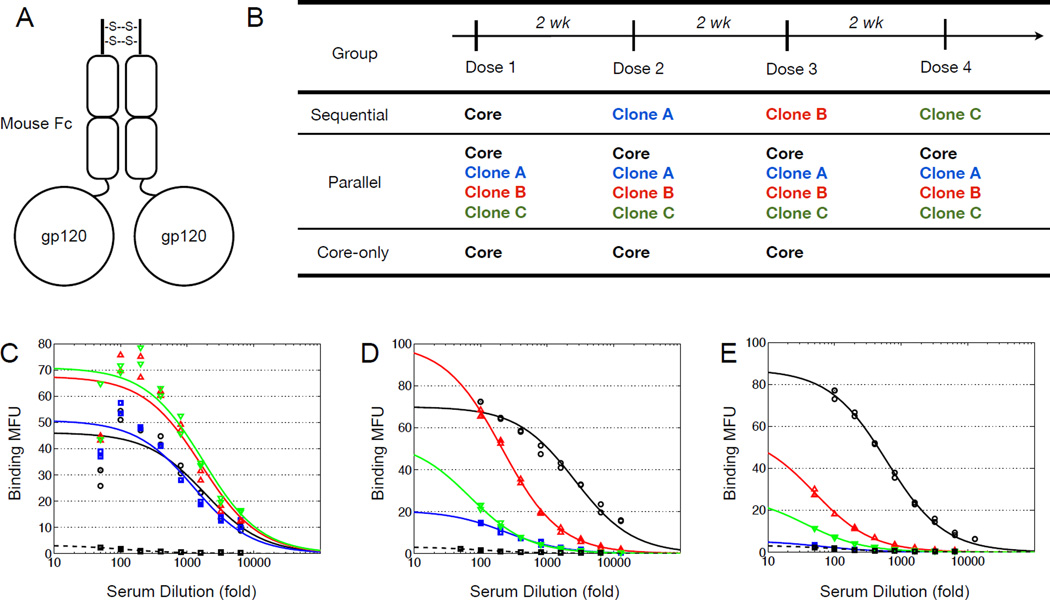
Generation of potent antibodies by a mutation-selection process called affinity maturation is a key component of effective immune responses. Antibodies that protect against highly mutable pathogens must neutralize diverse strains. Developing effective immunization strategies to drive their evolution requires understanding how affinity maturation happens in an environment where variants of the same antigen are present. We present an in silico model of affinity maturation driven by antigen variants which reveals that induction of cross-reactive antibodies often occurs with low probability because conflicting selection forces, imposed by different antigen variants, can frustrate affinity maturation. We describe how variables such as temporal pattern of antigen administration influence the outcome of this frustrated evolutionary process. Our calculations predict, and experiments in mice with variant gp120 constructs of the HIV envelope protein confirm, that sequential immunization with antigen variants is preferred over a cocktail for induction of cross-reactive antibodies focused on the shared CD4 binding site epitope.


Figures

Figure 1
Figure 1. Schematic depiction of in silico model
(A) Players and processes in the GCR. (B) Major steps in our in silico model of the GCR. (C) Model for BCR-Ag interactions. (Left) An FDC-held Ag interacting with a BCR. (Right) A zoom-in view of interactions (bars) between the residues on the Ag epitope and those on the BCR paratope. An affinity-affecting mutation on a paratope residue will change its interaction strength h with the corresponding paratope residue, denoted by hc (hv) if the latter is conserved (variable). (D) Conformational coupling between non-adjacent residues on the BCR is incorporated via correlated changes in hc and hv; weakening interaction with the variable residues and the residues that shield the conserved residues of the epitope (red), i.e., hv↓, would facilitate access to the conserved residues (green), i.e., hc↑. See also Supplementary Figure S1.
Figure 2
Figure 2. Concentration dependence of GC survival and antibody breadth in “WT first” schemes
For a relevant range of Ag concentrations (Ctot), the fraction of surviving GCs (%surv, blue) and their Ab breadth (red) are shown for (A) Scheme II (see 1 Ag), (B) Scheme II (see both Ag) and (C) Scheme III, with full (left column) or none (right column) Ab feedback. See also Supplementary Figures S2 and S3.
Figure 3
Figure 3. Distribution of breadth of individual antibodies and their total coverage for surviving GCs in scheme I—WT+v1+v2
(A and B) Histograms of breadth for having 11 (A) or 4 (B) non-overlapping mutations in the two variants. Histograms are obtained as a distribution for all the surviving GCs. (C) Histograms of coverage for surviving GCs under the same conditions as in (B). The coverage is defined as a sum of non-overlapping specificities. Results are shown for the cases of “see 1 Ag” (filled bars) and “see all Ag” (unfilled bars), with Ab feedback. See also Supplementary Figure S4.
Figure 4
Figure 4. Comparison of statistics for surviving GCs in Scheme II—WT|v1+v2 and Scheme III—WT|v1|v2
Shown are histograms for breadth, mean interaction strength with conserved residues (hc) and with variable residues (hv) (A–D), and for total coverage (E and F) via a polyclonal response. Results are shown for “Ab feedback” (A, C, E) and “peers only” (B, D, F) scenarios. For Scheme II (A and B), cases of “see 1 Ag” (filled bars) and “see both Ag” (unfilled bars) are shown. Total coverage (E and F) is presented for Scheme III (WT|v1|v2) by red filled bars and for Scheme II (WT|v1+v2, see 1 Ag) by blue unfilled bars. See also Supplementary Figure S5.
Figure 5
Figure 5. Immunization of mice with variant immunogens
(A) Schematic of an Fc-gp120 immunogen. (B) Immunization groups and dosing schedule for mouse experiment. (C–E) Serum titrations (day 48) of a representative mouse from each group—(C) sequential, (D) parallel, (E) core-only—on yeast displaying stripped core (black), clone A (blue), clone B (red), or clone C (green). Each plot also includes serum from an unimmunized mouse binding to yeast displaying clone C (black dashed). Binding data is fit to a monovalent binding isotherm of the form y=ymaxdil1dil1+KA1 where “dil” is the serum dilution and y is the binding signal in MFU. Discussion of the fitted parameters can be found in the supplemental material. See also Supplementary Figure S6 and Table S1.
Figure 6
Figure 6. Determination of serum specificity for the CD4 binding site
(A) Fractional binding to D368R mutant vs stripped core of serum from each group after three (open markers) and four (filled markers) immunizations. The fractional binding to D368R for antibody VRC01 at various concentrations is shown as lines: 0.21 at 93 nM (dashed line), 0.10 at 75 nM (dash-dotted line), and 0.06 at 8.2 nM (dotted line). (B) Schematic and data from ternary complex assay in which gp120 (CD4bs shown in gray) is pre-incubated with serum then added to VRC01 yeast. The formation of a ternary comlex is only possible if VRC01 is able to bind to its epitope on gp120 after serum has bound. The figure shows the percentage of yeast cells positive for mouse serum from each immunization group—sequential (solid line), parallel (dashed line), core-only (dash-dotted line)—for various time points. (C) Schematic and data from ternary complex assay in which gp120 is pre-loaded onto VRC01 yeast then incubated with serum. The formation of a ternary complex is only possible if serum antibodies are able to bind to their epitope(s) after VRC01 has bound. The figure shows the percentage of yeast cells positive for mouse serum from each immunization group as above. (D) Analysis of two monoclonal antibodies from a sequentially-immunized mouse: fractional binding to D368R vs. stripped core gp120 was assayed with 10 nM monoclonal antibody (analogous to 6A); percentage binding in the ternary complex assay (analogous to 6C), in which gp120 is pre-bound to VRC01 yeast.

References

    1. Allen CDC, Okada T, Tang HL, Cyster JG. Imaging of germinal center selection events during affinity maturation. Science. 2007;315:528–531. - PubMed
    1. Batista FD, Neuberger MS. Affinity dependence of the B cell response to antigen: a threshold, a ceiling, and the importance of off-rate. Immunity. 1998;8:751–759. - PubMed
    1. Baumjohann D, Preite S, Reboldi A, Ronchi F, Ansel KM, Lanzavecchia A, Sallusto F. Persistent antigen and germinal center B cells sustain T follicular helper cell responses and phenotype. Immunity. 2013;38:596–605. - PubMed
    1. Berek C, Milstein C. Mutation drift and repertoire shift in the maturation of the immune response. Immunol. Rev. 1987;96:23–41. - PubMed
    1. Berek C, Berger A, Apel M. Maturation of the immune response in germinal centers. Cell. 1991;67:1121–1129. - PubMed

Publication types

Substances