. 2015 Feb 12;160(4):607-618.
doi: 10.1016/j.cell.2015.01.015. Epub 2015 Feb 5.

EBV noncoding RNA binds nascent RNA to drive host PAX5 to viral DNA

Affiliations

EBV noncoding RNA binds nascent RNA to drive host PAX5 to viral DNA

Nara Lee et al. Cell. .

Abstract

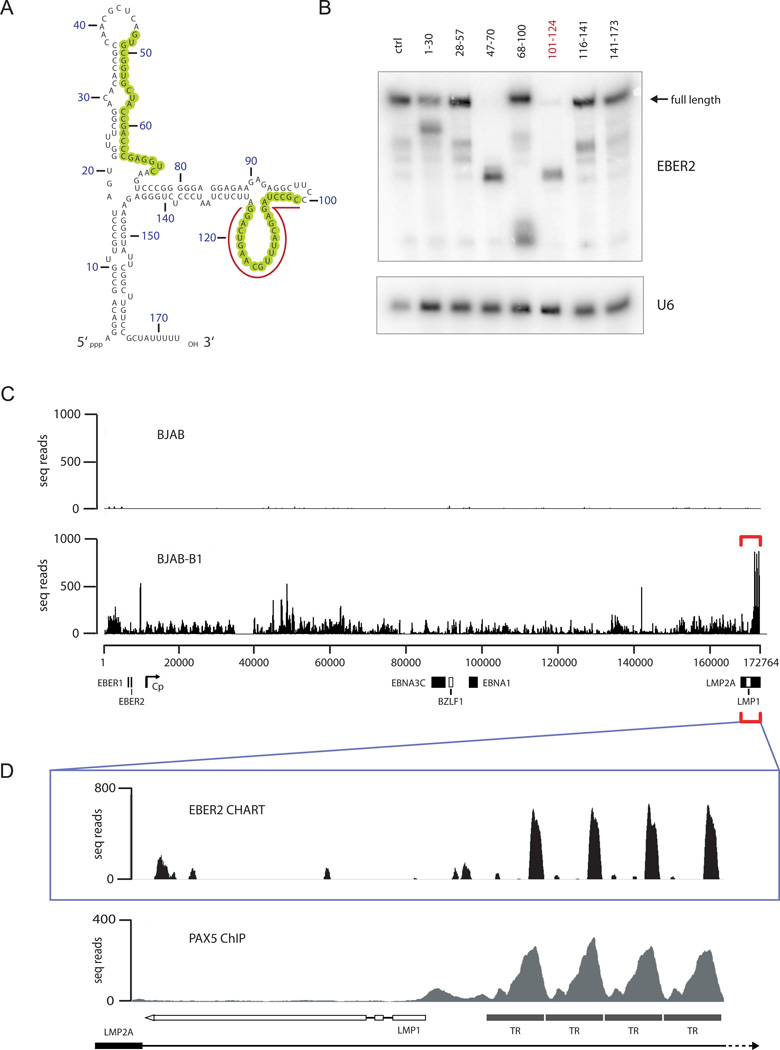
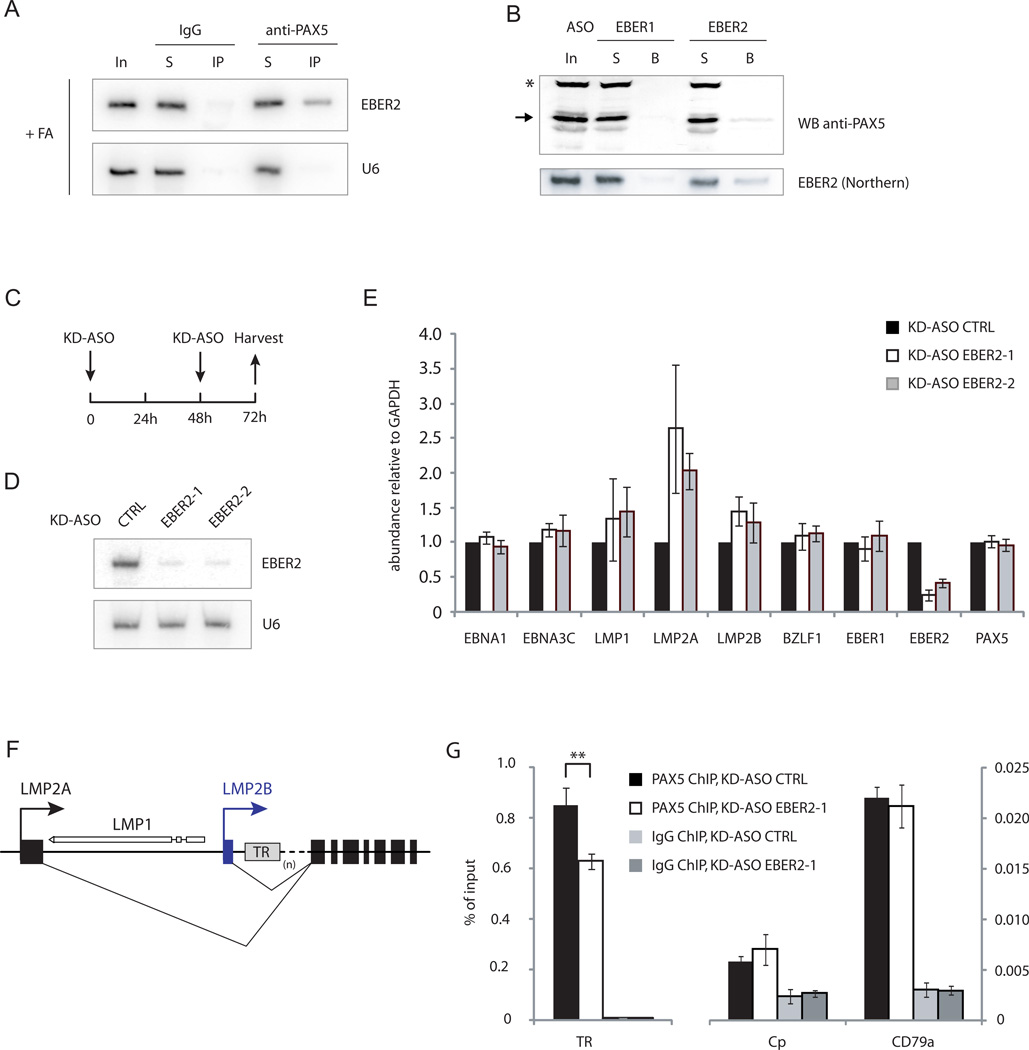
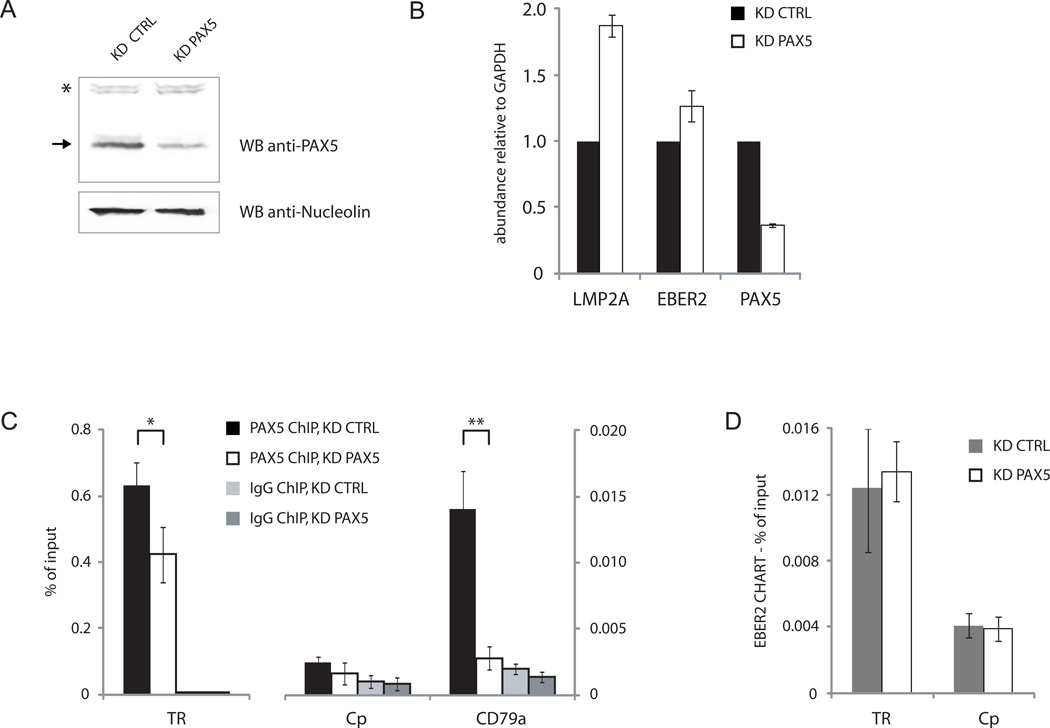
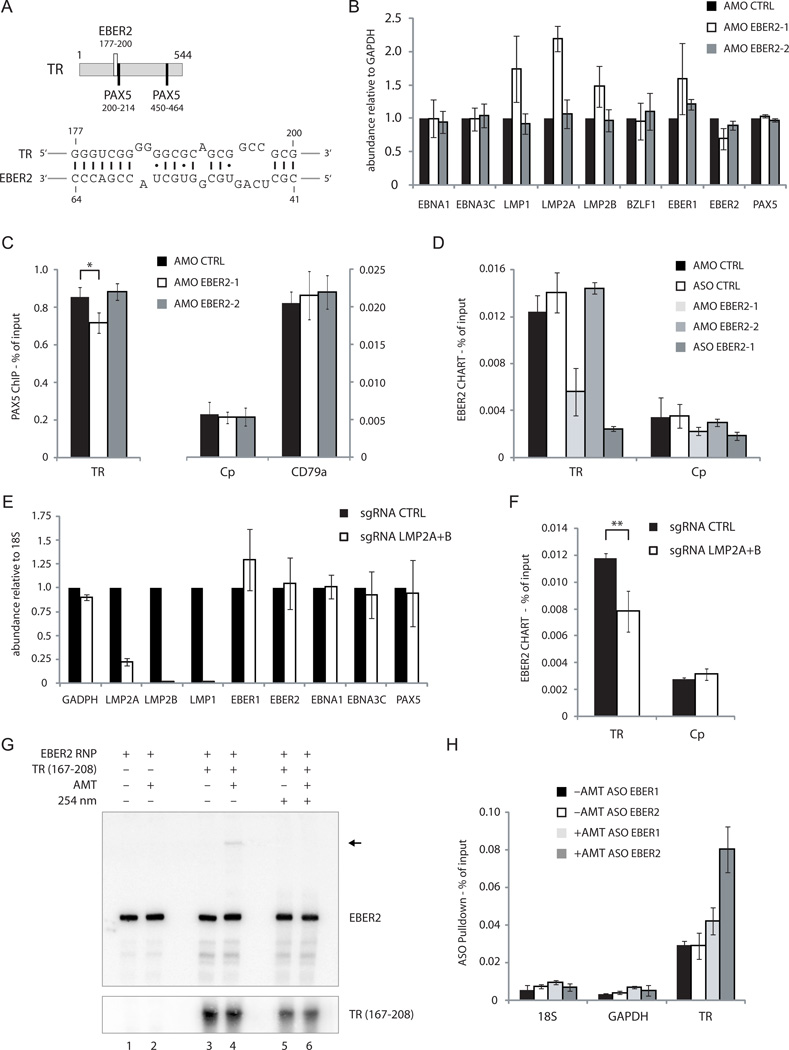
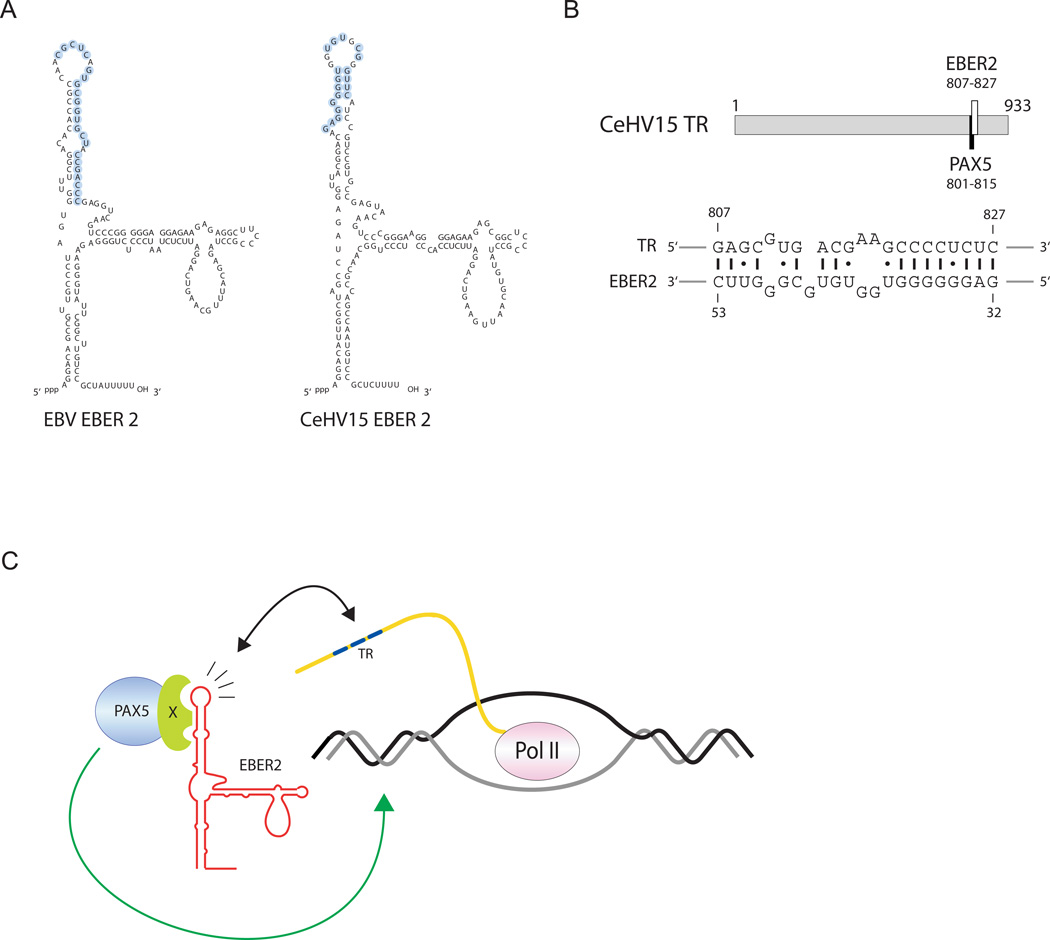
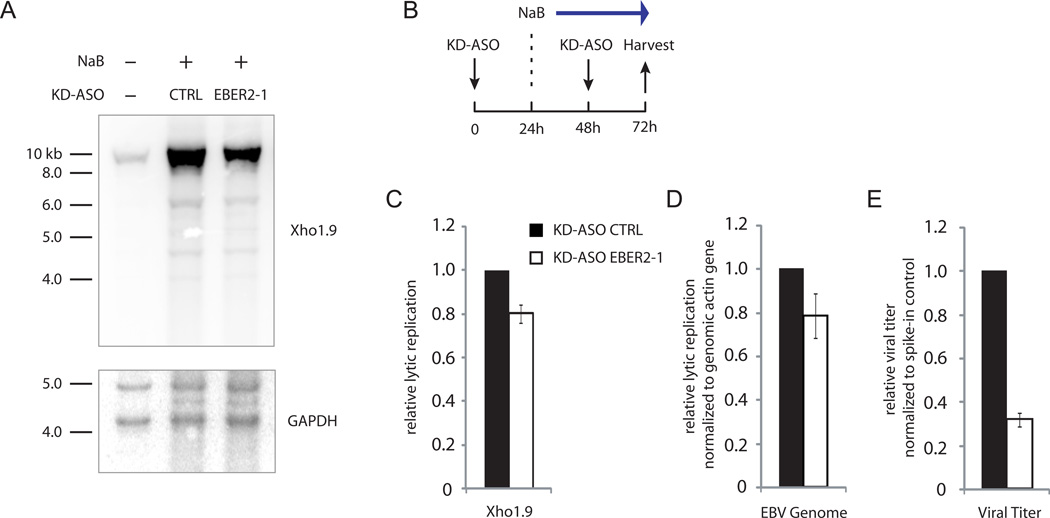
EBER2 is an abundant nuclear noncoding RNA expressed by the Epstein-Barr virus (EBV). Probing its possible chromatin localization by CHART revealed EBER2's presence at the terminal repeats (TRs) of the latent EBV genome, overlapping previously identified binding sites for the B cell transcription factor PAX5. EBER2 interacts with PAX5 and is required for the localization of PAX5 to the TRs. EBER2 knockdown phenocopies PAX5 depletion in upregulating the expression of LMP2A/B and LMP1, genes nearest the TRs. Knockdown of EBER2 also decreases EBV lytic replication, underscoring the essential role of the TRs in viral replication. Recruitment of the EBER2-PAX5 complex is mediated by base-pairing between EBER2 and nascent transcripts from the TR locus. The interaction is evolutionarily conserved in the related primate herpesvirus CeHV15 despite great sequence divergence. Using base-pairing with nascent RNA to guide an interacting transcription factor to its DNA target site is a previously undescribed function for a trans-acting noncoding RNA.


Figures

FIGURE 1
FIGURE 1
EBER2 localizes to the TRs of the EBV genome. (A) Secondary structure model of EBER2. RNase H-sensitive regions (shown in B) are circled in green. The region hybridizing to the ASO used in CHART is underlined. (B) Northern blot of EBER2 after RNase H digestion using DNA oligonucleotides complementary to EBER2. The numbers on top correspond to the nucleotides targeted in EBER2. Arrow indicates the mobility of full-length EBER2 RNA. U6 RNA serves as a loading control. (C) EBER2-CHART results from BJAB and BJAB-B1 cells. Deep sequencing reads were mapped to the entire EBV genome (x-axis); the number of seq reads is plotted on the y-axis. Several EBV genes and the C promoter region are indicated. White boxes for BZLF1 and LMP1 indicate reverse gene orientation. (D) EBER2-CHART peaks in the TR region (bracket in C) and the PAX5 ChIP profile (from Arvey et al. (2012)) are shown. See also Figure S1.
FIGURE 2
FIGURE 2
EBER2 interacts with PAX5 and is required for efficient PAX5 binding to TRs. (A) Northern blot of EBER2 after IP with IgG (control) or anti-PAX5 antibody after formaldehyde crosslinking (+FA). In = 5% input, S = 5% supernatant, IP = 100%. (B) EBER1 and EBER2 ASOs were used to pull down associated proteins, followed by Western blot using anti-PAX5 antibody (top). Arrow indicates PAX5; asterisk indicates a non-specific band. In = 10% input, S = 10% supernatant, B = 100% beads. The same samples were subjected to Northern blot analysis to detect EBER2 (bottom). Quantification of panels A and B are shown in Figure S2A and B. (C) Experimental outline for EBER2 knockdown. (D) Northern blot for EBER2 was carried out after EBER2 knockdown with two different KD-ASOs (complementary to nts 101–124 and 39–62) that target the nucleotides circled in green in Figure 1A. The same blot was probed for U6 as a loading control. (E) RNA levels of several EBV genes were assessed by qRT-PCR after EBER2 knockdown. (F) The LMP locus of the episomal EBV genome. LMP1 is transcribed in the opposite direction to LMP2. The variable number of TRs is indicated by (n). (G) PAX5 localization at the TRs after EBER2 knockdown was measured by ChIP-qPCR. The cellular CD79a promoter region, a known PAX5 target site, served as a positive ChIP control. The C promoter region of the EBV genome (Cp), an active promoter region not bound by PAX5, was the negative control. All data represent the mean of three independent experiments +/− SD; ** p = 0.008 (Student’s t-test; n = 3). See also Figure S2 and Table S1.
FIGURE 3
FIGURE 3
PAX5 is dispensable for EBER2 recruitment to the TRs. (A) Knockdown efficiency of PAX5 by lentivirally expressed shRNA was determined by Western blot using anti-PAX5 antibody. Anti-Nucleolin antibody provided a loading control. (B) RT-qPCR analysis after PAX5 knockdown. (C) PAX5 ChIP-qPCR analysis after PAX5 knockdown. * p = 0.03, ** p = 0.002 (Student’s t-test; n = 3). (D) EBER2-CHART followed by qPCR analysis after PAX5 knockdown. All data represent the mean of three independent experiments +/− SD.
FIGURE 4
FIGURE 4
EBER2 is recruited to the TRs through base pairing with nascent RNA from the TR locus. (A) Predicted RNA-RNA interaction between EBER2 and a region within the TR (bottom). TR coordinates are also shown for the two PAX5 consensus sites (top). (B) RNA levels of several EBV genes were measured by RT-qPCR after three days of treatment with EBER2 AMO complementary to nts 35–59 (AMO EBER2-1) or nts 146–170 (AMO EBER2-2). (C) Quantification of the PAX5 ChIP at the TR, Cp, and CD79a loci after treatment with AMO EBER2-1 or EBER2-2. The control IgG ChIP data (not shown) were comparable to those in Figure 2G. * p = 0.03 (Student’s t-test, n = 3). (D) EBER2-CHART followed by qPCR analysis after AMO EBER2-1 or KD-ASO treatment. (E) RT-qPCR analysis after expressing sgRNAs targeting LMP2A and LMP2B (Figure S4B) in dCAS9-KRAB expressing BJAB-B1 cells. (F) EBER2 CHART was conducted after CRISPR/dCAS9-mediated transcriptional interference of LMP2 genes. ** p = 0.01 (Student’s t-test, n = 3). (G) EBER2 RNP containing cell lysate was incubated with an in vitro transcribed 42-nt RNA fragment from the TR region (nts 167–208) predicted to base pair with EBER2 as shown in (A). AMT was added where indicated and the reaction was exposed to long-wave UV-light (365nm). Short-wave UV-light irradiation (254 nm) was included as indicated to reverse crosslinks. RNA was isolated and Northern blotting was carried out on a denaturing urea-polyacrylamide gel, probing for EBER2 and the in vitro transcribed TR RNA. Arrow indicates EBER2 crosslinked to the TR RNA fragment. (H) EBV-positive cells were treated with long-wave UV-light in the presence or absence of AMT. EBER1 and EBER2 were selected using specific ASOs, and together with co-precipitated RNAs were reverse-transcribed for RT-qPCR analysis. The abundance of TR-sequence-containing RNA was measured in EBER1 and EBER2 selected samples. Primers detecting 18S rRNA and GAPDH mRNA were used as negative controls. All data represent the mean of three independent experiments +/− SD. See also Figure S3–5 and Table S1.
FIGURE 5
FIGURE 5
EBER2-guided recruitment of PAX5 to the TRs appears to be evolutionarily conserved in a related gamma-herpesvirus. (A) Secondary structure models of EBV EBER2 and the EBER2 homolog of rhesus LCV (CeHV15). Nucleotides predicted to base pair with TR RNA are circled in blue. (B) Relative position and coordinates within the TR, as well as the PAX5 consensus site, are shown (top). The predicted RNA-RNA interaction between CeHV15 EBER2 and the TR RNA is shown at the bottom. (C) Model for complementary base-pairing mediated recruitment of EBER2-PAX5 RNP to the TR region. See also Figure S3.
FIGURE 6
FIGURE 6
EBER2 depletion results in decreased viral lytic replication. (A) Viral lytic replication after KD-ASO mediated EBER2 depletion was measured by Southern blot analysis using the Xho1.9 probe. The same blot was probed for the cellular GAPDH locus as a loading control. (B) Experimental outline for viral lytic induction by sodium butyrate (NaB) in combination with EBER2 knockdown by KD-ASO. (C) Quantification of three independent experiments as shown in (A). (D) Viral lytic replication was measured by qPCR analysis amplifying the EBV dyad symmetry DNA region normalized to the cellular actin gene. (E) Relative viral titer in supernatant was measured by qPCR normalized to spike-in control. All data represent the mean of three independent experiments +/− SD. See also Figure S6 and Table S1.

Comment in

Similar articles

Cited by

References

    1. Arvey A, Tempera I, Tsai K, Chen HS, Tikhmyanova N, Klichinsky M, Leslie C, Lieberman PM. An atlas of the Epstein-Barr virus transcriptome and epigenome reveals host-virus regulatory interactions. Cell Host Microbe. 2012;12:233–245. - PMC - PubMed
    1. Brown NA, Liu CR, Wang YF, Garcia CR. B-cell lymphoproliferation and lymphomagenesis are associated with clonotypic intracellular terminal regions of the Epstein-Barr virus. J Virol. 1988;62:962–969. - PMC - PubMed
    1. Bulut-Karslioglu A, Perrera V, Scaranaro M, de la Rosa-Velazquez IA, van de Nobelen S, Shukeir N, Popow J, Gerle B, Opravil S, Pagani M, et al. A transcription factor-based mechanism for mouse heterochromatin formation. Nat Struct Mol Biol. 2012;19:1023–1030. - PubMed
    1. Cech TR, Steitz JA. The noncoding RNA revolution-trashing old rules to forge new ones. Cell. 2014;157:77–94. - PubMed
    1. Chiu SH, Wu MC, Wu CC, Chen YC, Lin SF, Hsu JT, Yang CS, Tsai CH, Takada K, Chen MR, Chen JY. Epstein-Barr virus BALF3 has nuclease activity and mediates mature virion production during the lytic cycle. J Virol. 2014;88:4962–4975. - PMC - PubMed

Publication types

Substances

Associated data