. 2015 Feb 27;43(4):2091-101.
doi: 10.1093/nar/gkv093. Epub 2015 Feb 6.

Autonomous actions of the human growth hormone long-range enhancer

Affiliations

Autonomous actions of the human growth hormone long-range enhancer

Eung Jae Yoo et al. Nucleic Acids Res. .

Abstract

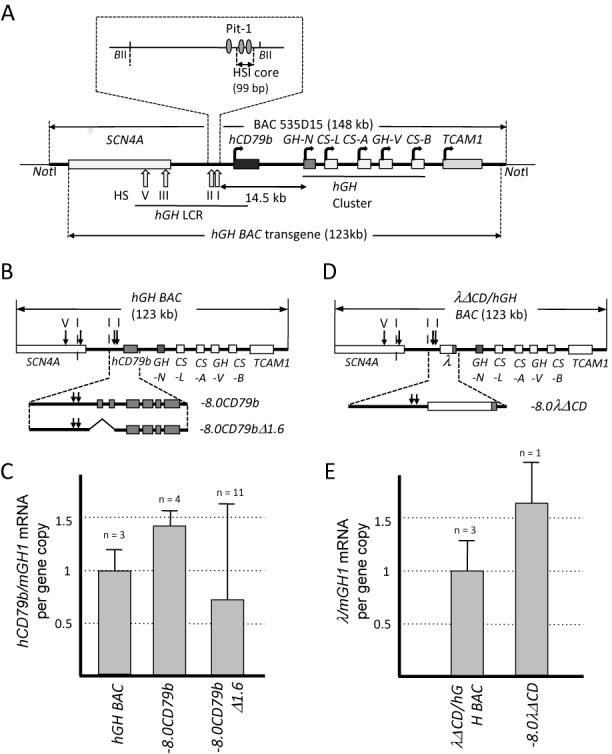
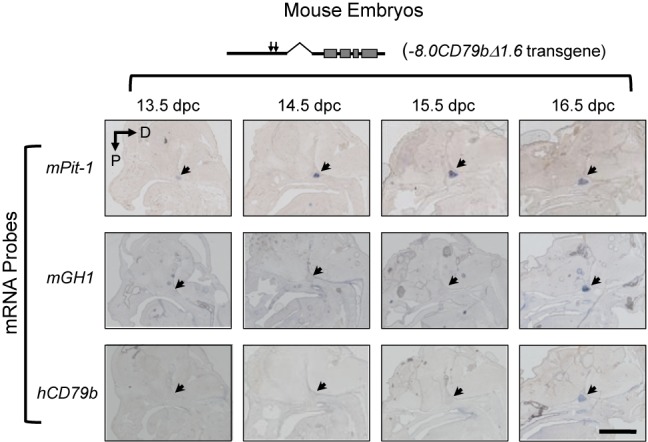
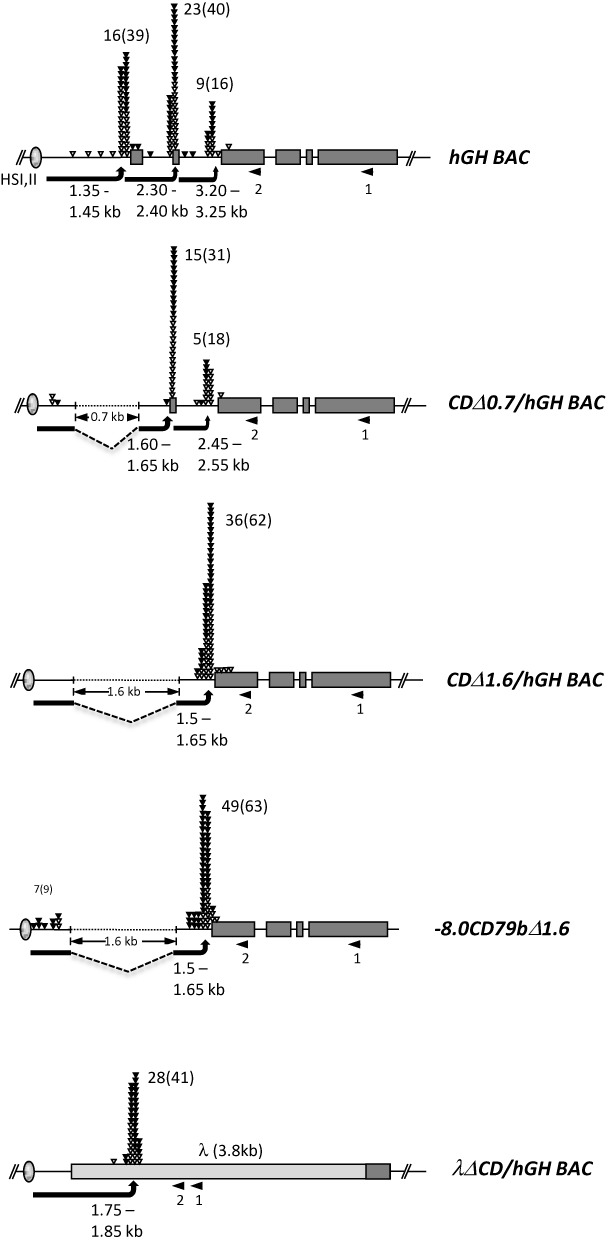
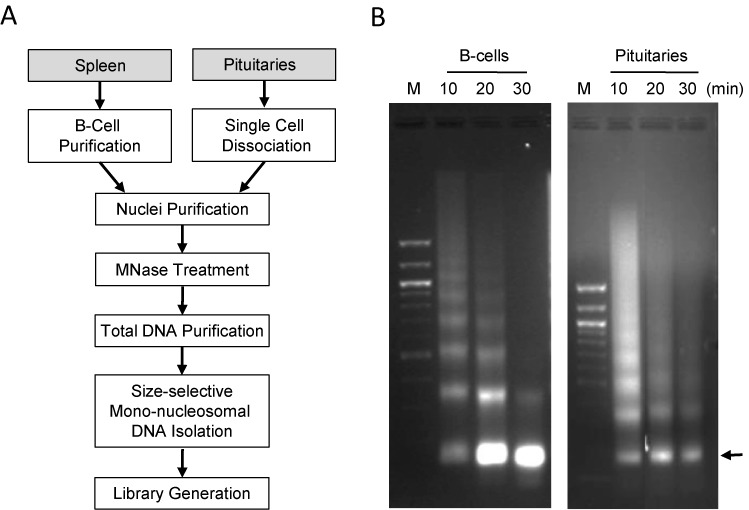
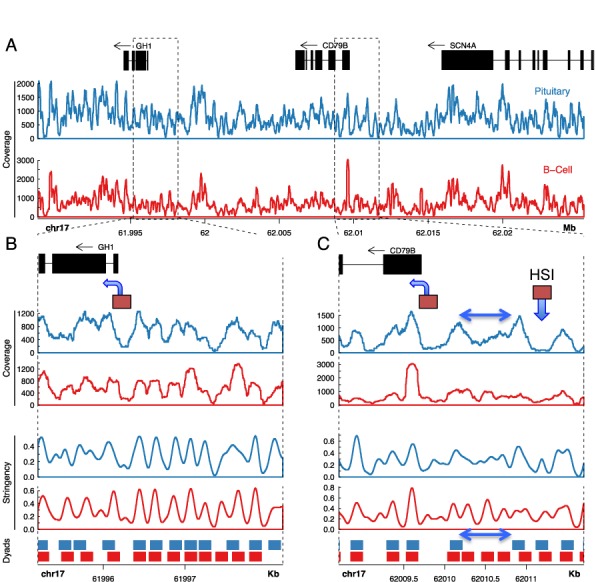
The human growth hormone (hGH) gene is controlled by a long-range enhancer, HSI, located 14.5 kb 5' to the hGH promoter. HSI establishes a domain of noncoding transcription that is 'looped' to the hGH promoter as an essential step in initiating hGH gene expression. Thus, defining how HSI generates its domain of noncoding transcription is central to understanding its long-range function. Here, we demonstrate that activation of noncoding transcription reflects an HSI-autonomous activity fully independent of interactions with linked gene promoters and occurring in spatial and temporal synchrony with initiation of GH expression in the embryonic pituitary. HSI establishes its noncoding transcription start sites (TSS) over a defined distance from its core determinants and in a manner independent of local primary sequences. The interval between HSI and it TSS co-maps with a domain of disordered and/or highly mobile nucleosomes specific to the pituitary locus. Thus, a localized chromatin reconfiguration by HSI and consequent establishment of an adjacent domain of noncoding transcription constitute initiating events in long-range enhancer function within the hGH locus.


Figures

Figure 1.
Figure 1.
HSI activates noncoding transcription independent of promoter interactions. (A) Map of the hGH locus and the hGH BAC transgene. Each structural gene in the hGH locus is indicated along with its transcriptional orientation. The 123 kb hGH BAC transgene released from the originating BAC clone (BAC535D15) by NotI digestion was used to generate the hGH BAC transgenic mouse lines (26). The vertical arrows labeled with roman numerals indicate the positions of DNase I hypersensitive sites (HS) that form in pituitary chromatin and constitute the hGH LCR. The distance (14.5 kb) between the 3′ end of the HSI core and the hGH-N gene promoter is indicated with double-headed arrow. Note that this region encompasses the hCD79b gene that encodes the B-cell specific Ig receptor component, Igβ. Pit-1 binding sites that constitute core determinants of HSI are indicated by the shaded ovals (expanded inset). The 99 bp deletion that inactivates HSI functions (18) is also shown in expanded view (inset above). (B) Map of the wild-type hGH BAC and two derivative transgenes. The −8.0CD79b transgene (12.5 kb) encompasses HSI and the contiguous hCD79b (expanded view below the hGH locus map) and isolates this region from the hGH gene cluster. The −8.0CD79bΔ1.6 transgene was derived from the −8.0CD79b by deletion of a 1.6-kb internal fragment extending from −0.5 kb of the promoter through intron 2, removing all defined hCD79b promoter elements. (C) Noncoding transcription across hCD79b in the transgenic mouse pituitary is preserved in the absence of defined promoter elements. Transcription across the hCD79b region generated by the promoterless −8.0CD79bΔ1.6 was compared to that of the −8.0CD79b transgene (containing the intact hCD79b promoter but not the hGH-N promoter) and the hGH BAC transgene (containing both the hCD79b and the hGH-N promoters). Pituitary RNA from mice carrying each of these indicated transgenes was assayed for transcription across hCD79b by RT-qPCR. The data shown in the histogram (Y-axis) have been normalized to the corresponding transgene copy numbers and to somatotrope-specific levels of the endogenous mouse growth hormone (mGH1) mRNA. The number of genetically distinct lines assessed for each transgene is noted above the corresponding bars in the histogram. Each line was tested in triplicate using three independent mice. Values represent the average ± SD. The level of hGH BAC was defined as 1.0. (D) Map of the 123 kb λΔCD/hGH transgene and the derivative the −8.0λΔCD transgene. This transgene was generated by replacing the hCD79b gene and promoter (to −500 bp) with a size-matched fragment of bacteriophage λ DNA within the context of an otherwise intact hGH BAC (see ‘Materials and Methods' section). The −8.0λΔCD transgene was released from the λΔCD/hGH transgene with boundaries as indicated. (E) Noncoding transcription is activated 3′ of HSI within an inserted (λ) DNA segment. Transcription across the λ-DNA region was compared between the λΔCD/hGH and −8.0λΔCD transgenes. λ noncoding transcription was measured by RT-qPCR, normalized to transgene copy-number and to mGH1 mRNA levels. λ noncoding transcription was actively transcribed without hGH-N promoter. The number of genetically distinct lines assessed for each transgene is noted above the corresponding bars in the histogram. Each experiment was carried out in triplicate. The study of the single −8.0λΔCD line was evaluated in each of three independent mice, each studied in triplicate. Values represent the average ± SD.
Figure 2.
Figure 2.
HSI-dependent noncoding transcription is appropriately activated during embryonic development. Mouse embryos carrying the promoterless −8.0CD79bΔ1.6 transgene (Figure 1B) were assessed at 13.5 dpc through 16.5 dpc by in situ histohybridization. Each embryo was hybridized with antisense probes to mPit-1, mGH1 and hCD79b transcripts and sections were counterstained with alkaline phosphatase-conjugated anti-DIG antibodies and with BM Purple (Roche) to reveal anatomical landmarks. The region occupied by the embryonic pituitary in each sagittal head section is indicated (arrow). The appropriate activation of mPit-1, and mGH1 at 14.5 dpc and 16 dpc, respectively, confirmed embryonic staging and pituitary positioning. Transcription across the hCD79b region of the promoterless −8.0CD79bΔ1.6 transgene was observed to be in full positional and temporal synchrony with that of mGH. D, dorsal; P, posterior. Scale bar, 1 mm.
Figure 3.
Figure 3.
5′ RACE analyses of transcription start sites 3′ to HSI in the hGH BAC and derivative transgenes reveals consistent spacing between the HSI core determinants and the TSS cluster. RNA was isolated from the pituitaries of mice carrying each of the 5 indicated transgenes (Figure 1). In each case, cDNA synthesis was primed at the site labeled 1 (left facing arrow), poly G tails were added to the 3′ end of the cDNA, and the product was then amplified between an adapter-polyC17 primer and a nested primer (arrow 2). The amplified PCR products were cloned and individually sequenced. Each triangle indicates the 5′ terminus of an individual clone and the results were grouped within 50 bp windows. The total numbers of cDNAs containing an additional non-templated terminal G (corresponding to the 5′-capped structure; filled triangles) are shown, and the total numbers of cDNAs with and without the nontemplated G are included in parentheses. The arrows indicate the distance between the HSI core and the center of the most proximal TSS cluster. hGH BAC, 123 kb unmodified human transgenic mouse line (two copies) (26); CDΔ0.7/hGH BAC, 0.7 kb deletion of 0.5 kb promoter region and exon 1 from hGH BAC (14 copies) (25); CDΔ1.6/hGH BAC, 1.6 kb deletion of 0.5 kb promoter through exon 2 from the hGH BAC (three copies) (23); −8.0CD79bΔ1.6, 1.6 kb deletion of hCD79b promoter through exon 2 from the −8.0CD79b (6 copies); λΔCD/hGH BAC, 3.8 kb λ gene segment replacing hCD79b from hGH BAC (five copies) (23).
Figure 4.
Figure 4.
Isolation and analysis of nucleosome-protected DNA fragments from pituitaries and splenic B cells of hGH BAC transgenic mice. (A) Work flow diagram. Spleens and pituitaries from hGH BAC mice were isolated and B cells were enriched on antibody coated beads. Nuclei isolated from disaggregated cells were digested by MNase for 10, 20 or 30 min. DNAs corresponding to mononucleosome-protected fragments were isolated from each of these digestions and used to generate whole genome sequencing libraries (see ‘Materials and Methods' section). (B) Analytic gel displaying DNA isolated from MNase partial digests of the indicated chromatin preparations. The position on the 2.0% agarose gel corresponding to the mononucleosome-protected DNA fragments (∼150 bp) is indicated by the arrow.
Figure 5.
Figure 5.
Nucleosome occupancy at the hGH BAC transgene locus reveals a singular chromatin configuration in the pituitary at HSI and in the region between HSI and the hCD79b promoter. (A) Sequence coverage of MNase-generated mononucleosomes across the region encompassing the hGH-N and hCD79b genes in the hGH BAC transgene. Mononucleosome-protected DNA generated by MNase digestions (Figure 4) from splenic and pituitary nuclei of hGH BAC transgenic mice were converted into NGS libraries and sequenced to a minimum 10× genome coverage (Table 1). Sequence data was mapped to the chimeric hGH BAC transgenic genome. Gene annotations are depicted at the top of the figure (in black). Nucleosome coverage as determined by sequencing of mononucleosomes generated by the MNase digestions (Figure 4) from pituitary and B cells are plotted below (blue and red, respectively). The genome coordinates are indicated below the coverage plots. (B and C). Expanded views of the hGH-N promoter region and hCD79b promoter-HSI region, respectively. Gene annotations are depicted in the top panel in black, and the hGH-N and hCD79b promoters are each indicated by boxes with an arrow in the direction of transcription. The HSI core region is indicated by a box and downward arrow. Pituitary and B-cell nucleosome ‘coverages’ are plotted in the first and second panels, followed by the ‘stringency’ plots in the third and fourth panels, followed by the nucleosome ‘dyad positioning’ plots in the bottom panel (as labeled). Stringency plots represent the fraction of defined nucleosome positions in a region (29). Dyad positioning plots depict regions occupied by nucleosomes at high stringency (>50%). The double-headed arrow in figure (C) represents the region of disordered nucleosomes between HSI and the hCD79b promoter that is specific to the pituitary locus.

Similar articles

Cited by

References

    1. Smallwood A., Ren B. Genome organization and long-range regulation of gene expression by enhancers. Curr. Opin. Cell Biol. 2013;23:387–394. - PMC - PubMed
    1. Dekker J., Rippe K., Dekker M., Kleckner N. Capturing chromosome conformation. Science. 2002;295:1306–1311. - PubMed
    1. Sanyal A., Lajoie B.R., Jain G., Dekker J. The long-range interaction landscape of gene promoters. Nature. 2012;489:109–113. - PMC - PubMed
    1. Sexton T., Bantignies T., Cavalli G. Genomic interactions: chromatin loops and gene meeting points in transcriptional regulation. Semin. Cell Dev. Biol. 2009;20:849–855. - PubMed
    1. Noordermeer D., Branco M.R., Splinter E., Klous P., van Ijcken W., Swagemakers S., Koutsourakis M., van der Spek P., Pombo A., de Laat W. Transcription and chromatin organization of a housekeeping gene cluster containing an integrated beta-globin locus control region. PLoS Genet. 2008;4:e1000016. - PMC - PubMed

Publication types

LinkOut - more resources