. 2015 Apr;81(8):2676-89.
doi: 10.1128/AEM.03476-14. Epub 2015 Feb 6.

Sulfur isotope fractionation during the evolutionary adaptation of a sulfate-reducing bacterium

Affiliations

Sulfur isotope fractionation during the evolutionary adaptation of a sulfate-reducing bacterium

André Pellerin et al. Appl Environ Microbiol. 2015 Apr.

Abstract

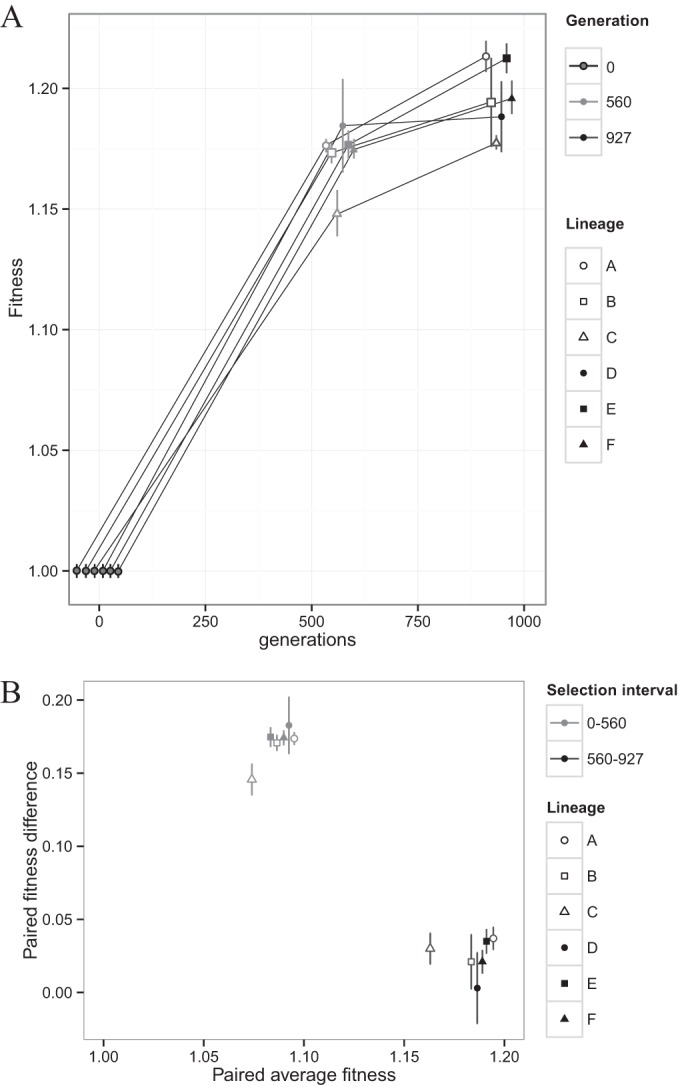
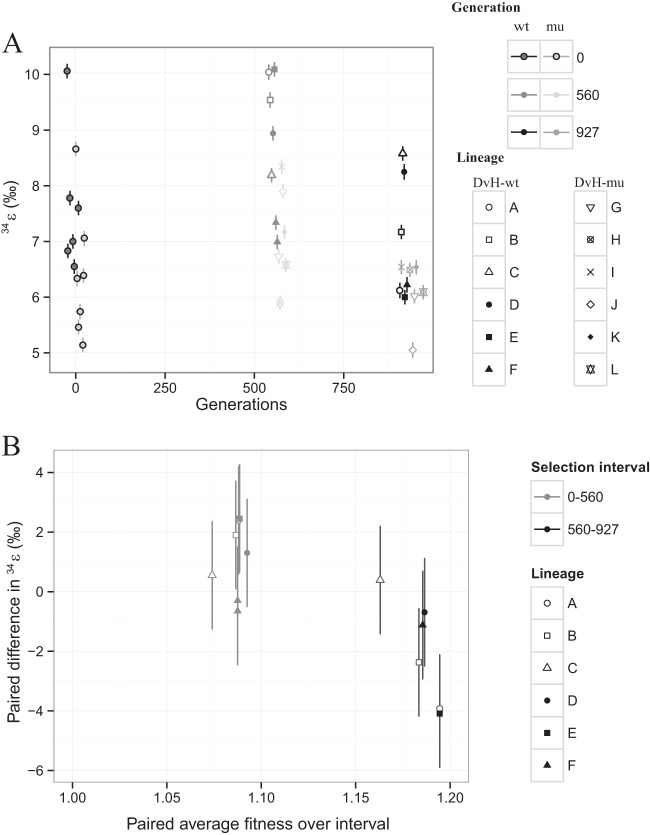
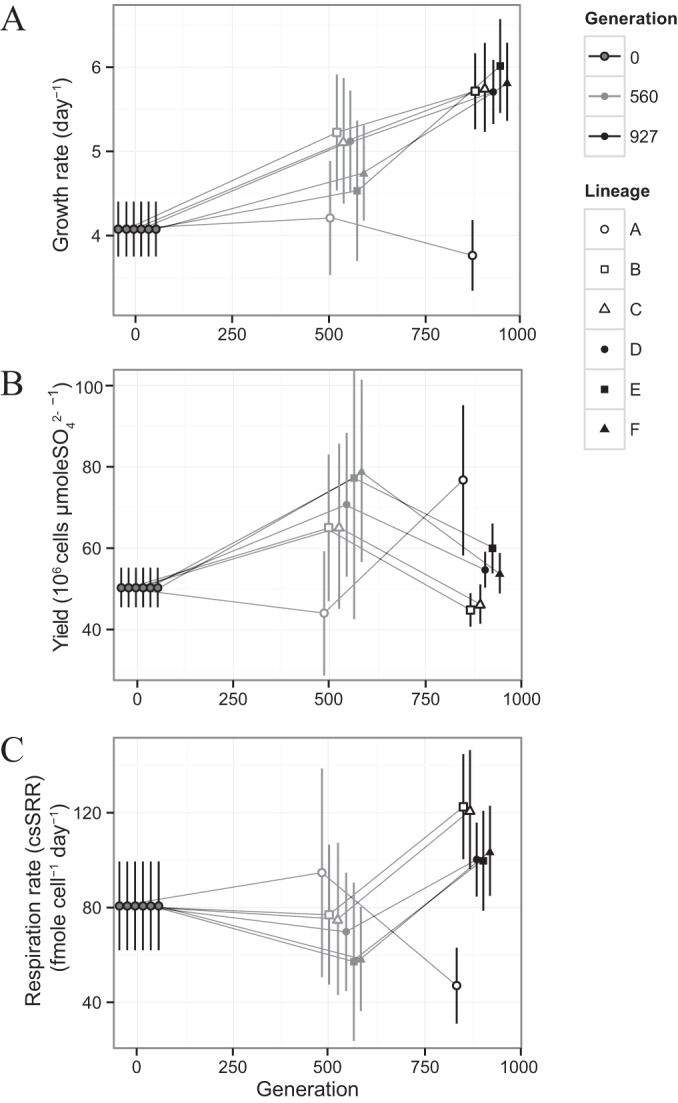
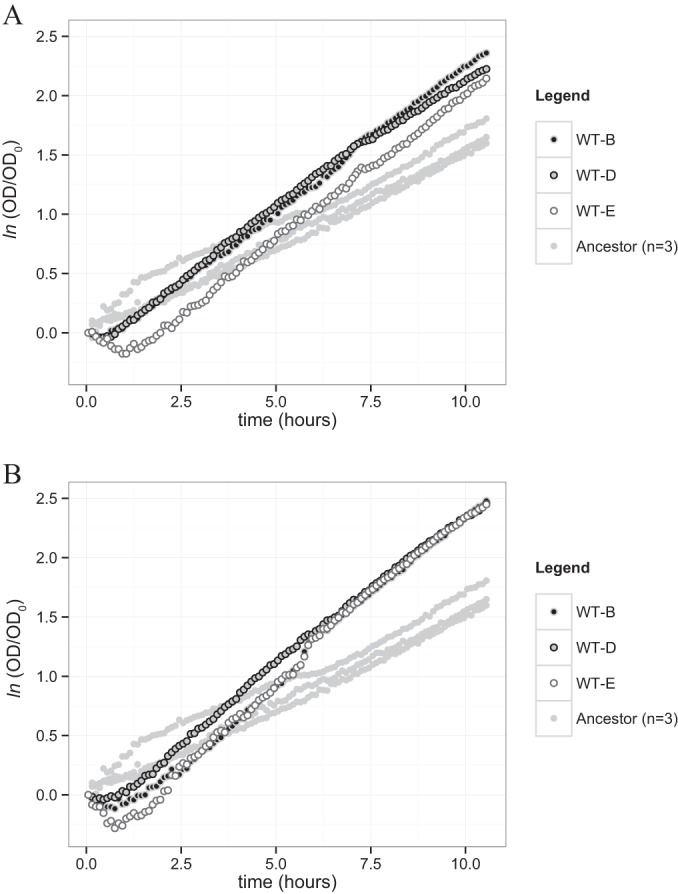
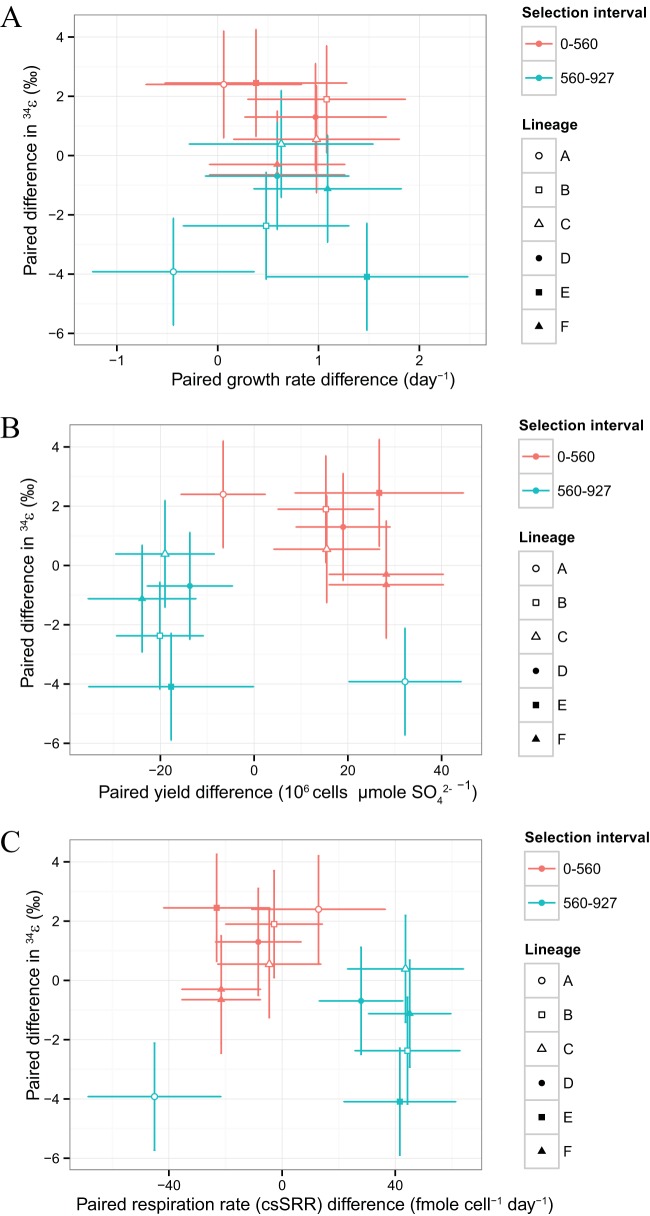
Dissimilatory sulfate reduction is a microbial catabolic pathway that preferentially processes less massive sulfur isotopes relative to their heavier counterparts. This sulfur isotope fractionation is recorded in ancient sedimentary rocks and generally is considered to reflect a phenotypic response to environmental variations rather than to evolutionary adaptation. Modern sulfate-reducing microorganisms isolated from similar environments can exhibit a wide range of sulfur isotope fractionations, suggesting that adaptive processes influence the sulfur isotope phenotype. To date, the relationship between evolutionary adaptation and isotopic phenotypes has not been explored. We addressed this by studying the covariation of fitness, sulfur isotope fractionation, and growth characteristics in Desulfovibrio vulgaris Hildenborough in a microbial evolution experiment. After 560 generations, the mean fitness of the evolved lineages relative to the starting isogenic population had increased by ∼ 17%. After 927 generations, the mean fitness relative to the initial ancestral population had increased by ∼ 20%. Growth rate in exponential phase increased during the course of the experiment, suggesting that this was a primary influence behind the fitness increases. Consistent changes were observed within different selection intervals between fractionation and fitness. Fitness changes were associated with changes in exponential growth rate but changes in fractionation were not. Instead, they appeared to be a response to changes in the parameters that govern growth rate: yield and cell-specific sulfate respiration rate. We hypothesize that cell-specific sulfate respiration rate, in particular, provides a bridge that allows physiological controls on fractionation to cross over to the adaptive realm.


Figures

FIG 1
FIG 1
34ε values from pure cultures of sulfate-reducing microbes with metabolic rates in a range similar to that of this study (50 to 125 fmol cell−1 day−1). Larger data sets are displayed as boxplots, whereas smaller data sets are displayed as individual points. Data labeled with a superscript letter are from the following references: a, reference ; b, reference ; c, reference ; d, reference ; e, reference ; f, reference .
FIG 2
FIG 2
Illustration of the experimental workflow. Daily serial transfers produce ≈5 generations of growth per day. The resulting evolved lineages are archived at intervals of ≈100 generations. Archived ancestral and evolved lineages are revived simultaneously to measure the phenotypic differences over two selection intervals (generations 0 to 560 and generations 560 to 927).
FIG 3
FIG 3
Magnitudes of fitness improvements decrease with increasing generations. (A) Fitness of DVH-wt ancestor and evolved lineages as determined by direct competition experiments as a function of the number of generations. Data from specific generations are jittered along portions of the x axis for easier visualization. Symbols indicate individual lineages, while shades of gray indicate different generations. Error bars indicate 1σ uncertainty on biological replicates (n = 12 for the ancestor, n = 3 for each evolved lineage). (B) Difference in fitness for each lineage from the start to the end of a selection interval (paired fitness difference) against the average fitness for the lineage over that interval. Symbols indicate individual lineages, while shades of gray indicate different selection intervals. Error bars indicate propagated 1σ uncertainties on biological replicates (n = 12 for ancestor, n = 3 for each evolved lineage).
FIG 4
FIG 4
Isotope fractionation (34ε) over the course of the evolution experiment. (A) Measured 34ε values as a function of number of generations estimated from individual growth experiments. Data from specific generations are jittered along portions of the x axis for easier visualization. Symbols indicate individual lineages, while shades of gray distinguish generations (560 or 927) and common ancestors (DVH-wt or DVH-mut). Error bars indicate 1σ uncertainty estimates (technical replicates) on individual 34ε values based on a Monte Carlo resampling procedure (see the supplemental material). wt, wild type; mu, mutant. (B) Difference in 34ε for each lineage from the start to the end of a selection interval (paired difference in 34ε) against the average 34ε for the lineage over that interval. Symbols indicate individual lineages, while shades of gray indicate different selection intervals. Error bars indicate propagated 1σ uncertainties based on the biological replicates from the ancestral wild type (n = 6).
FIG 5
FIG 5
Growth characteristics of individual lineages during exponential growth taken from individual growth assays. Data from specific generations are jittered along portions of the x axis for easier visualization. Symbols indicate individual lineages, while shades of gray indicate different generations. Error bars on evolved populations indicate 1σ measurement uncertainty (technical replicates) on individual growth characteristics propagated from measurements of optical density and [H2S]. Error bars on ancestral data indicate 1σ uncertainties from biological replicates (n = 6). (A) Growth rate (k). (B) Growth yield (Y). (C) Cell-specific sulfate reduction (csSRR).
FIG 6
FIG 6
Difference in growth characteristics for each lineage from the start to the end of a selection interval relative to paired differences in fitness. Symbols indicate individual lineages, while shades of gray indicate different selection intervals. Error bars indicate propagated 1σ uncertainties. (A) Paired growth rate differences relative to paired fitness differences. (B) Paired yield differences relative to paired fitness differences. (C) Paired csSRR differences relative to paired fitness differences.
FIG 7
FIG 7
Time evolution of the natural logarithm of the normalized population density of evolved lineages and the ancestral population. Two-shaded dots correspond to the evolved lineages, while the uniform gray dots correspond to the individual replicate runs of the ancestral population (n = 3) and provide a visual guide to the background variability in the results. (A) Assay of lineages WT-B, -D, and -E at generation 560. (B) Assay of lineages WT-B, -D, and -E at generation 927.
FIG 8
FIG 8
Difference in 34ε for each lineage from the start to the end of a selection interval relative to the paired differences in growth rate, yield, and csSRR. Symbols indicate individual lineages, while colors indicate different selection intervals. Vertical error bars indicate propagated 1σ uncertainties based on the biological replicates from the ancestral population (n = 6). (A) Paired differences in 34ε relative to paired growth rate differences. (B) Paired differences in 34ε relative to paired yield differences. (C) Paired differences in 34ε relative to paired csSRR differences.

Similar articles

Cited by

References

    1. Habicht KS, Canfield DE. 1997. Sulfur isotope fractionation during bacterial sulfate reduction in organic-rich sediments. Geochim Cosmochim Acta 61:5351–5361. doi:10.1016/S0016-7037(97)00311-6. - DOI - PubMed
    1. Shen Y, Buick R, Canfield DE. 2001. Isotopic evidence for microbial sulphate reduction in the early Archaean era. Nature 410:77–81. doi:10.1038/35065071. - DOI - PubMed
    1. Minz D, Fishbain S, Green SJ, Muyzer G, Cohen Y, Rittmann BE, Stahl DA. 1999. Unexpected population distribution in a microbial mat community: sulfate-reducing bacteria localized to the highly oxic chemocline in contrast to a eukaryotic preference for anoxia. Appl Environ Microbiol 65:4659–4665. - PMC - PubMed
    1. Wagner M, Roger AJ, Flax JL, Brusseau GA, Stahl DA. 1998. Phylogeny of dissimilatory sulfite reductases supports an early origin of sulfate respiration. J Bacteriol 180:2975–2982. - PMC - PubMed
    1. Wing BA, Halevy I. 2014. Intracellular metabolite levels shape sulfur isotope fractionation during microbial sulfate respiration. Proc Natl Acad Sci U S A 111:18116–18125. doi:10.1073/pnas.1407502111. - DOI - PMC - PubMed

Publication types

MeSH terms

LinkOut - more resources