. 2015 Feb;37(1):9747.
doi: 10.1007/s11357-015-9747-3. Epub 2015 Feb 8.

Amyloid and tau pathology of familial Alzheimer's disease APP/PS1 mouse model in a senescence phenotype background (SAMP8)

Affiliations

Amyloid and tau pathology of familial Alzheimer's disease APP/PS1 mouse model in a senescence phenotype background (SAMP8)

D Porquet et al. Age (Dordr). 2015 Feb.

Abstract

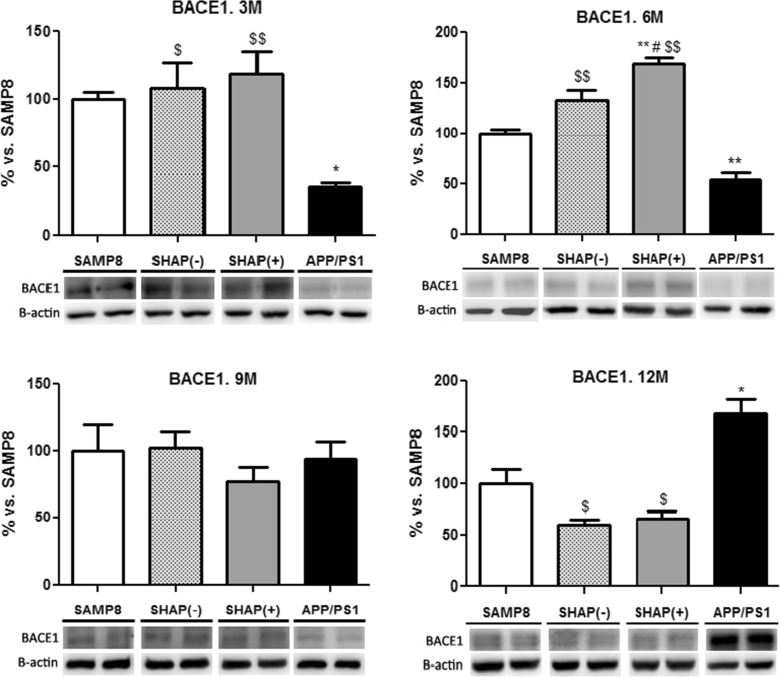
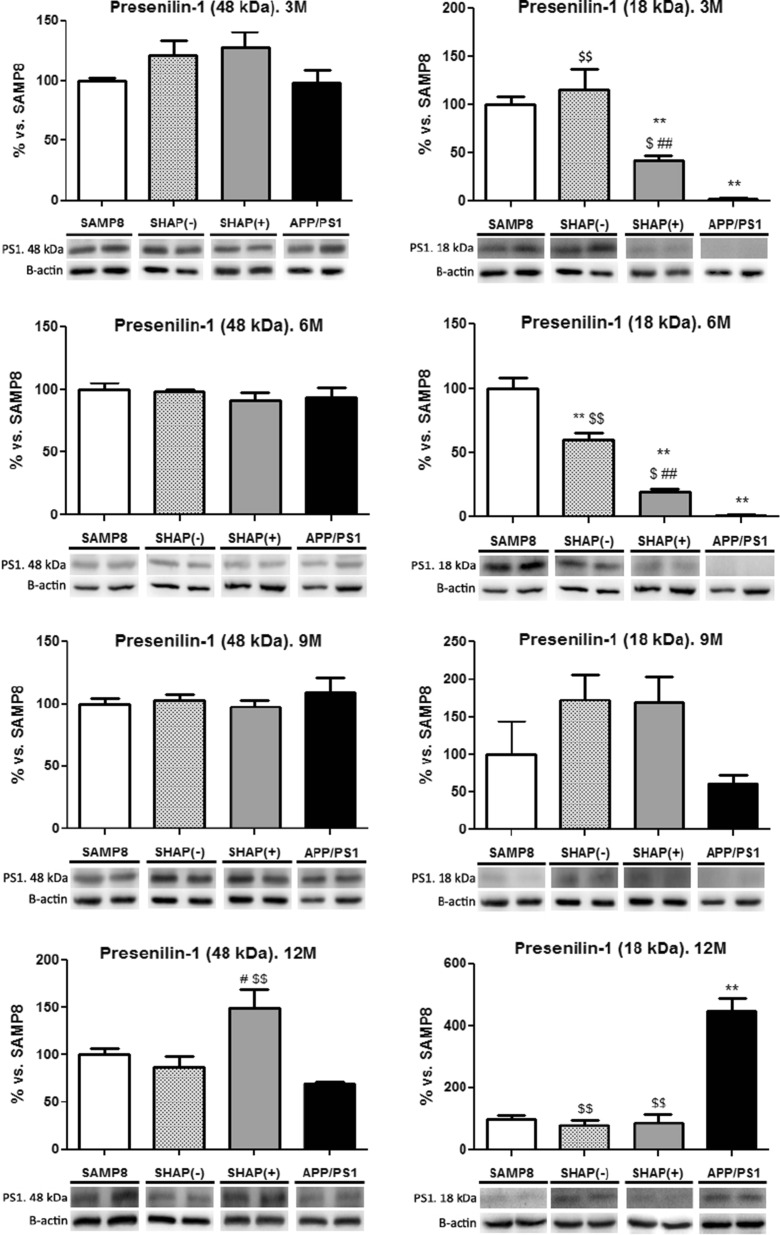
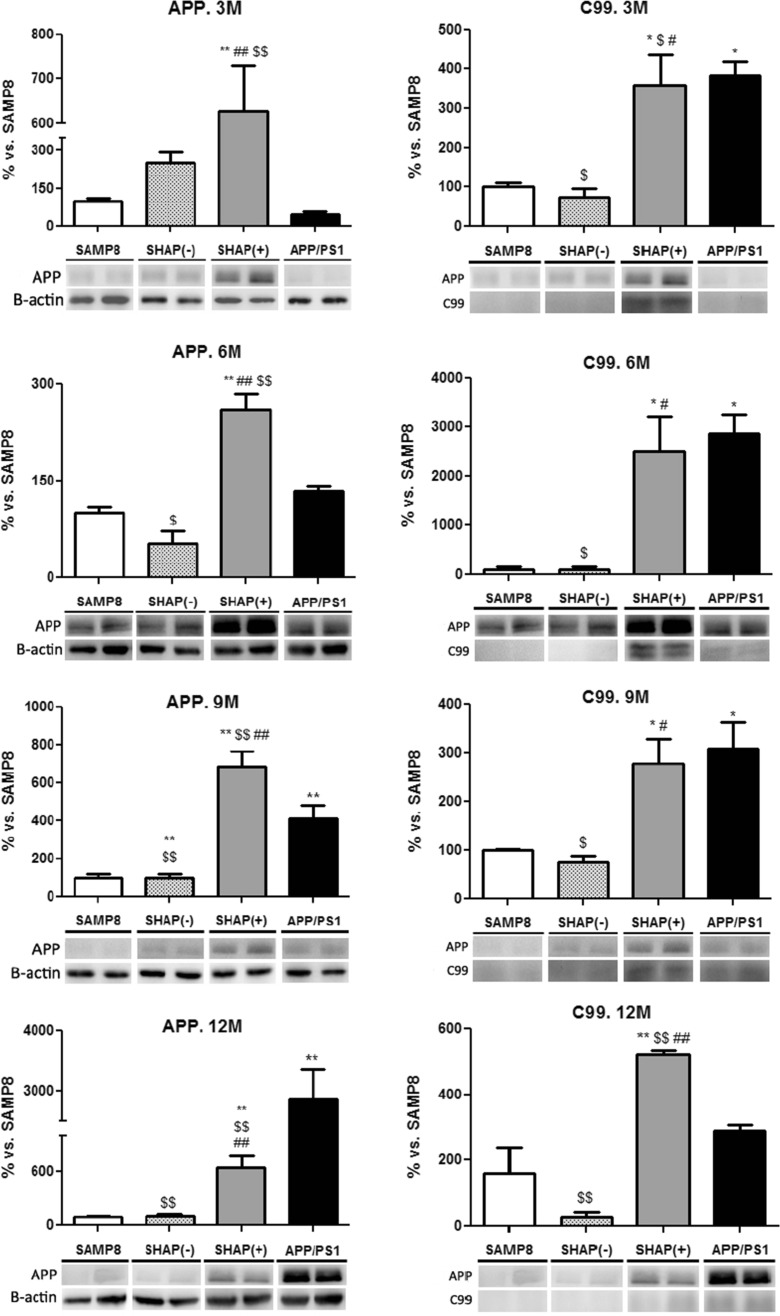
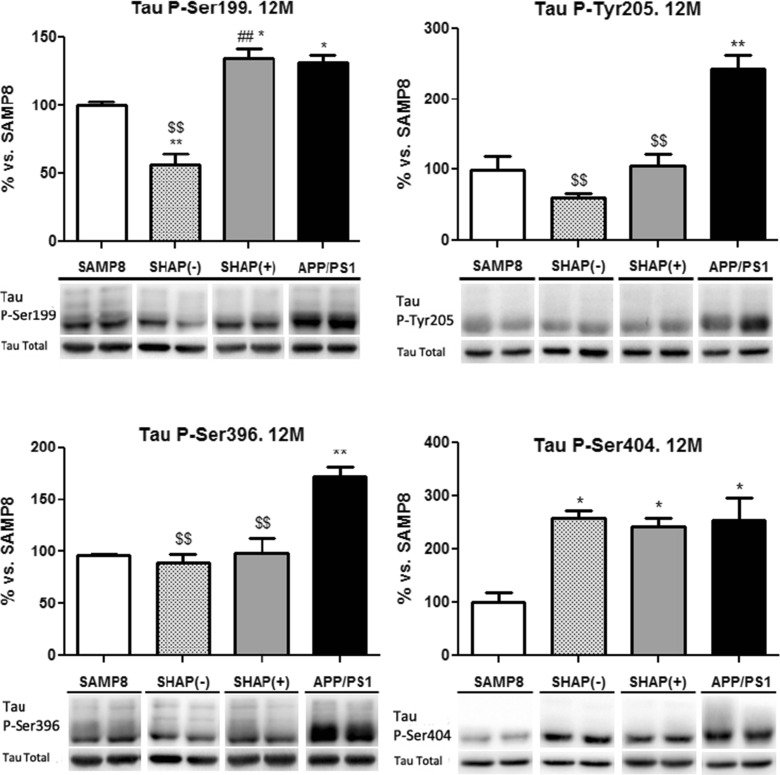
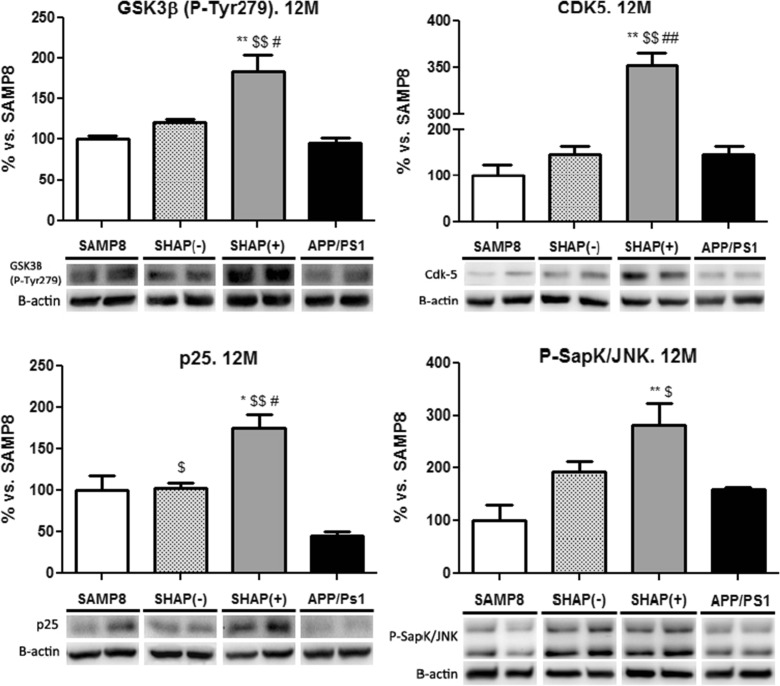
The amyloid precursor protein/presenilin 1 (APP/PS1) mouse model of Alzheimer's disease (AD) has provided robust neuropathological hallmarks of familial AD-like pattern at early ages, whereas senescence-accelerated mouse prone 8 (SAMP8) has a remarkable early senescence phenotype with pathological similarities to AD. The aim of this study was the investigation and characterization of cognitive and neuropathological AD markers in a novel mouse model that combines the characteristics of the APP/PS1 transgenic mouse model with a senescence-accelerated background of SAMP8 mice. Initially, significant differences were found regarding amyloid plaque formation and cognitive abnormalities. Bearing these facts in mind, we determined a general characterization of the main AD brain molecular markers, such as alterations in amyloid pathway, neuroinflammation, and hyperphosphorylation of tau in these mice along their lifetimes. Results from this analysis revealed that APP/PS1 in SAMP8 background mice showed alterations in the pathways studied in comparison with SAMP8 and APP/PS1, demonstrating that a senescence-accelerated background exacerbated the amyloid pathology and maintained the cognitive dysfunction present in APP/PS1 mice. Changes in tau pathology, including the activity of cyclin-dependent kinase 5 (CDK5) and glycogen synthase kinase 3 β (GSK3β), differs, but not in a parallel manner, with amyloid disturbances.


Figures

Fig. 1
Fig. 1
Body weight (BW, in grams [g]) of the studied models in function of age (months). Analysis of variance (ANOVA) following Tukey’s multiple comparison test: **p < 0.01 vs. SAMP8; $$ p < 0.01 vs. amyloid precursor protein/presenilin 1 (APP/PS1)
Fig. 2
Fig. 2
Discrimination index (DI) of different groups of senescence-accelerated mouse prone 8 (SAMP8) animals at 9 and 12 months of age. Bars represent mean ± standard error of the mean (SEM). Analysis of variance (ANOVA) following Tukey’s multiple comparison test: one-sample t test—*p < 0.05 vs. SAMP8; $ p < 0.05 vs. APP/PS1; # p < 0.05 vs. SHAP(−)
Fig. 3
Fig. 3
Thioflavin S staining of β-amyloid plaques in mouse brains. Representative images of histopathological brain state of senescence-accelerated mouse prone 8 (SAMP8) (ac), SHAP(+) (df), SHAP(−) (gi), and amyloid precursor protein/presenilin 1 (APP/PS1) (jl) at different times in life (6, 9, and 12 months). White arrows are representative indicators of the presence of β-amyloid plaques in the areas studied: cortex (Cx) and hippocampus (Hp)
Fig. 4
Fig. 4
a Quantification of number of β-amyloid plaques at 6, 9, and 12 months of age in the cerebral cortex (Cx) and hippocampus (Hp) of amyloid precursor protein/presenilin 1 (APP/PS1) and SHAP(+). b Levels of soluble Aβ-40 and Aβ-42, respectively, at 3, 6, 9, and 12 months. For quantification parameters, see “Materials and methods.” Bars represent mean ± standard error of the mean (SEM). Analysis of variance (ANOVA) following Tukey’s multiple comparison test: ***p < 0.001 vs. SAMP8 and SHAP(−); $ p < 0.05, $$ p < 0.01, $$$ p < 0.001 vs. APP/PS1, ### p < 0.001
Fig. 5
Fig. 5
Immunohistochemical (cortex and hippocampus) staining of Iba-1 (green) and GFAP (red). Representative images of glial state of senescence-accelerated mouse prone 8 (SAMP8) (ad), SHAP(+) (il), SHAP(−) (eh), and amyloid precursor protein/presenilin 1 (APP/PS1) (mp) mice at 12 months of age. Yellow arrows are representative indicators of microglial activation in studied areas, whereas white arrows are representative indicators of β-amyloid plaques and glial fibrillary acidic protein (GFAP) staining. Scale bar for Iba-1 images is 100 μm, for GFAP + Tio-S 200 μm
Fig. 6
Fig. 6
Levels of BACE of senescence-accelerated mouse prone 8 (SAMP8), SHAP(−), SHAP(+), and amyloid precursor protein/presenilin 1 (APP/PS1). Bars represent mean ± standard error of the mean (SEM); values are adjusted to 100 % for levels of SAMP8. Analysis of variance (ANOVA) following Tukey’s multiple comparison test: *p < 0.05, **p < 0.01 vs. SAMP8; $ p < 0.05, $$ p < 0.01 vs. APP/PS1; # p < 0.05 vs. SHAP(−)
Fig. 7
Fig. 7
Levels of presenilin 1 (PS1), holoprotein (48 kDa), and CTF fragment (18 kDa) of senescence-accelerated mouse prone 8 (SAMP8), SHAP(−), SHAP(+), and amyloid precursor protein/presenilin 1 (APP/PS1) mice. Bars represent mean ± standard error of the mean (SEM); values are adjusted to 100 % for levels of SAMP8. Analysis of variance (ANOVA) following Tukey’s multiple comparison test: **p < 0.01 vs. SAMP8; $ p < 0.05, $$ p < 0.01 vs. APP/PS1; # p < 0.05, ## p < 0.01 vs. SHAP(−)
Fig. 8
Fig. 8
Western blot analysis for amyloid precursor protein (APP) of senescence-accelerated mouse prone 8 (SAMP8), SHAP(−), SHAP(+), and APP/presenilin 1 (PS1) mice. Upper panels present the analysis of full APP levels at the studied ages. Lower panels present C-terminal beta fragment (CTFß/APP ratio). Bars represent mean ± standard error of the mean (SEM); values are adjusted to 100 % for levels of SAMP8. Analysis of variance (ANOVA) following Tukey’s multiple comparison test: *p < 0.05, **p < 0.01 vs. SAMP8; $ p < 0.05, $$ p < 0.01 vs. APP/PS1; # p < 0.05, ## p < 0.01 vs. SHAP(−)
Fig. 9
Fig. 9
Levels of phosphorylated Tau at Ser199, Tyr205, Ser396, and Ser404 epitopes. Bars represent mean ± standard error of the mean (SEM) and values are adjusted to 100 % for levels of senescence-accelerated mouse prone 8 (SAMP8) mice. Analysis of variance (ANOVA) following Tukey’s multiple comparison test: *p < 0.05, **p < 0.01 vs. SAMP8; $$ p < 0.01 vs. APP/PS1; # p < 0.05, ## p < 0.01 vs. SHAP(−)
Fig. 10
Fig. 10
Levels of CDK5, p25, GSK3β, and SAPK/JNK. Bars represent mean ± standard error of the mean (SEM) and values are adjusted to 100 % for levels of senescence-accelerated mouse prone 8 (SAMP8) mice. Analysis of variance (ANOVA) following Tukey’s multiple comparison test: *p < 0.05, **p < 0.01 vs. senescence-accelerated mouse prone 8 (SAMP8); $ p < 0.05, $$ p < 0.01 vs. amyloid precursor protein/presenilin 1 (APP/PS1); # p < 0.05, ## p < 0.01 vs. SHAP(−)

References

    1. Agarwal A, Saleh RA, Bedaiwy MA. Role of reactive oxygen species in the pathophysiology of human reproduction. Fertil Steril. 2003;79:829–43. doi: 10.1016/S0015-0282(02)04948-8. - DOI - PubMed
    1. Ahn K, Shelton CC, Tian Y, et al. Activation and intrinsic gamma-secretase activity of presenilin 1. Proc Natl Acad Sci U S A. 2010;107:21435–40. doi: 10.1073/pnas.1013246107. - DOI - PMC - PubMed
    1. Antunes M, Biala G. The novel object recognition memory: neurobiology, test procedure, and its modifications. Cogn Process. 2012;13:93–110. doi: 10.1007/s10339-011-0430-z. - DOI - PMC - PubMed
    1. Aso E, Lomoio S, López-González I, et al. Amyloid generation and dysfunctional immunoproteasome activation with disease progression in animal model of familial Alzheimer’s disease. Brain Pathol. 2012;22:636–53. doi: 10.1111/j.1750-3639.2011.00560.x. - DOI - PMC - PubMed
    1. Aubele T, Kaufman R, Montalmant F, Kritzer MF. Effects of gonadectomy and hormone replacement on a spontaneous novel object recognition task in adult male rats. Horm Behav. 2008;54:244–52. doi: 10.1016/j.yhbeh.2008.04.001. - DOI - PMC - PubMed

Publication types