. 2015 Feb;27(2):375-90.
doi: 10.1105/tpc.114.131508. Epub 2015 Feb 6.

Formation and dissociation of the BSS1 protein complex regulates plant development via brassinosteroid signaling

Affiliations

Formation and dissociation of the BSS1 protein complex regulates plant development via brassinosteroid signaling

Setsuko Shimada et al. Plant Cell. 2015 Feb.

Abstract

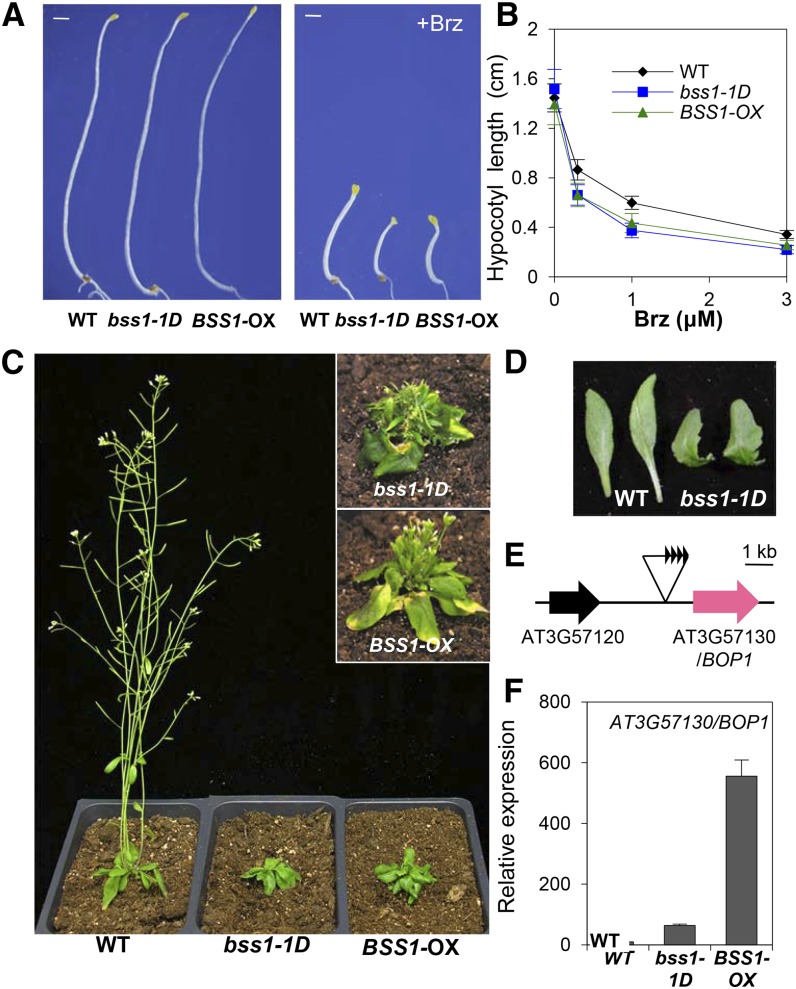
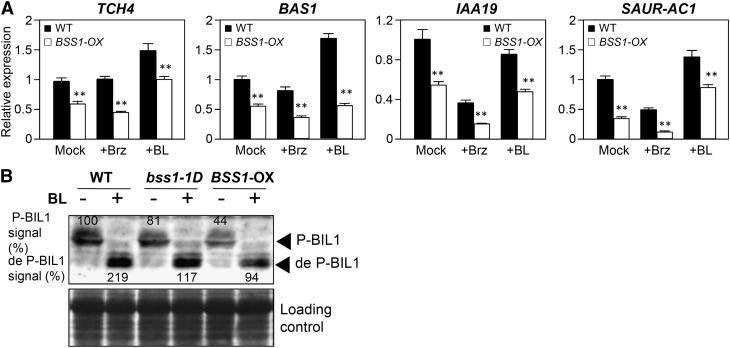
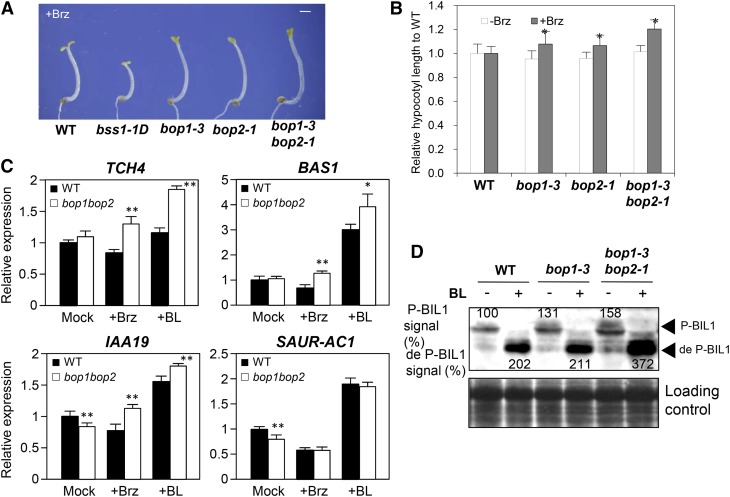
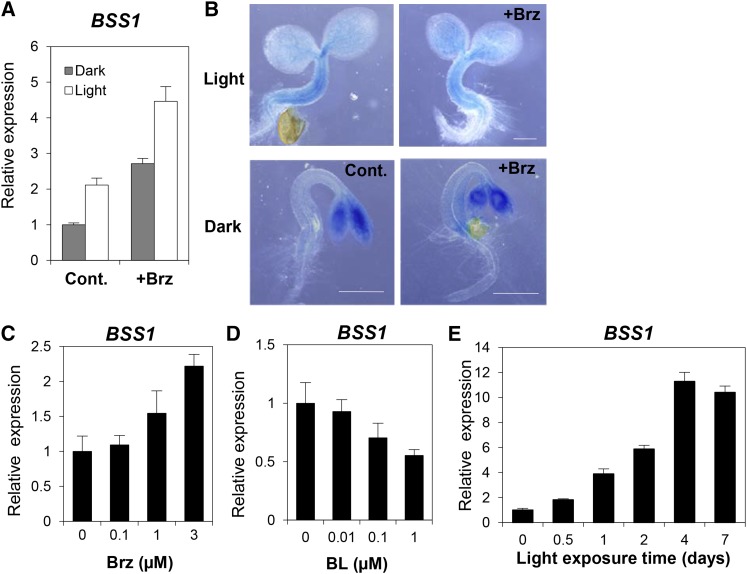
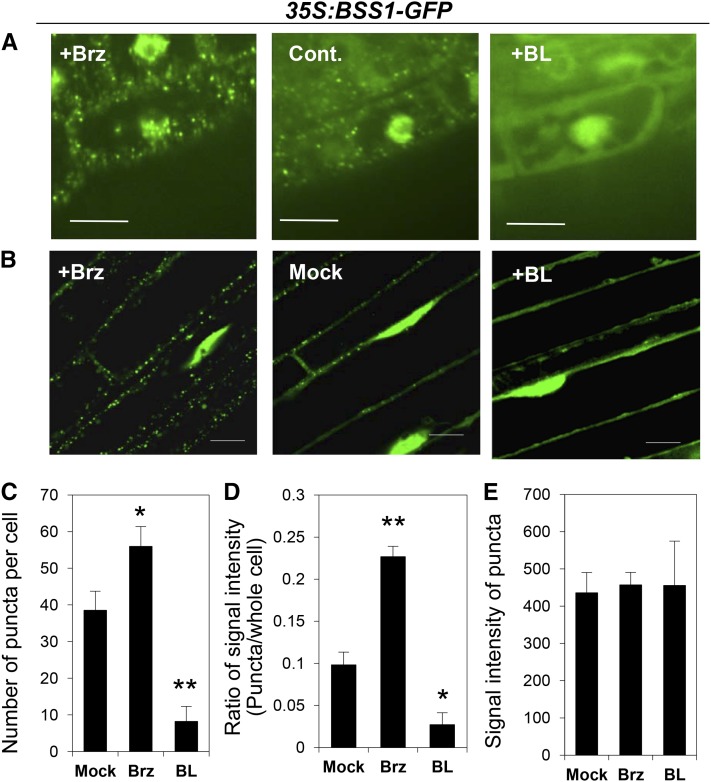
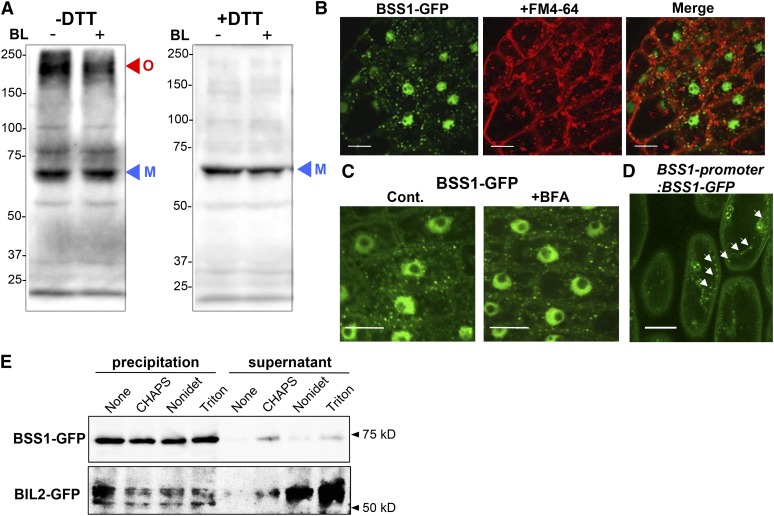
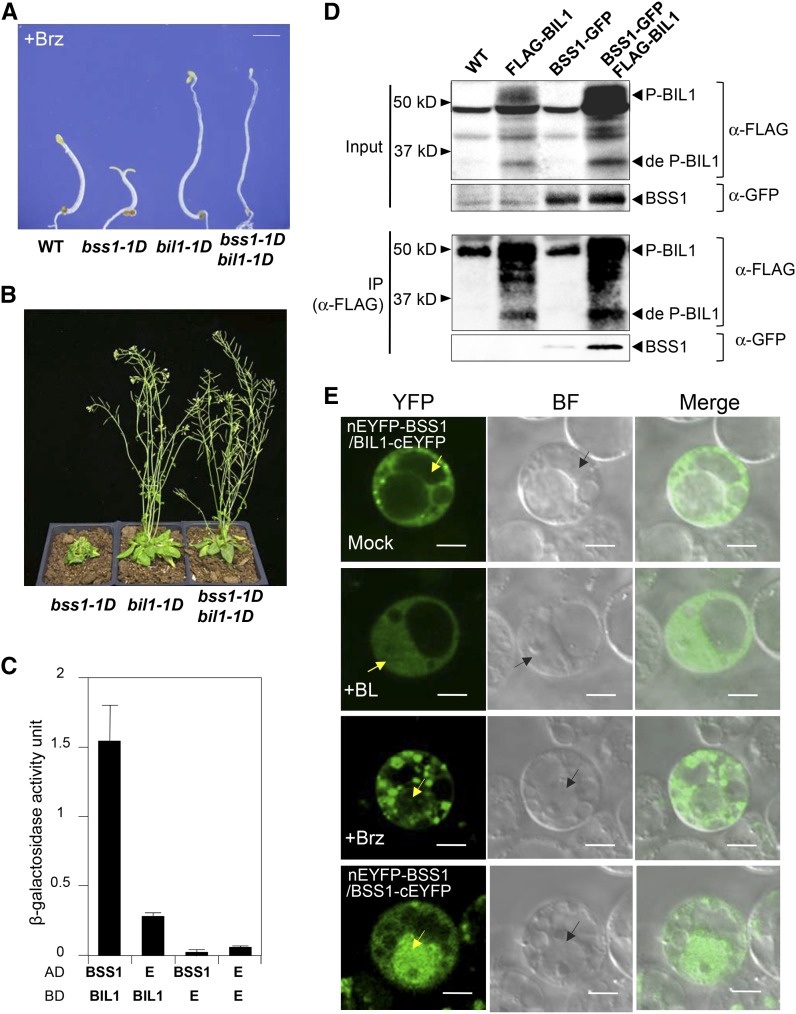
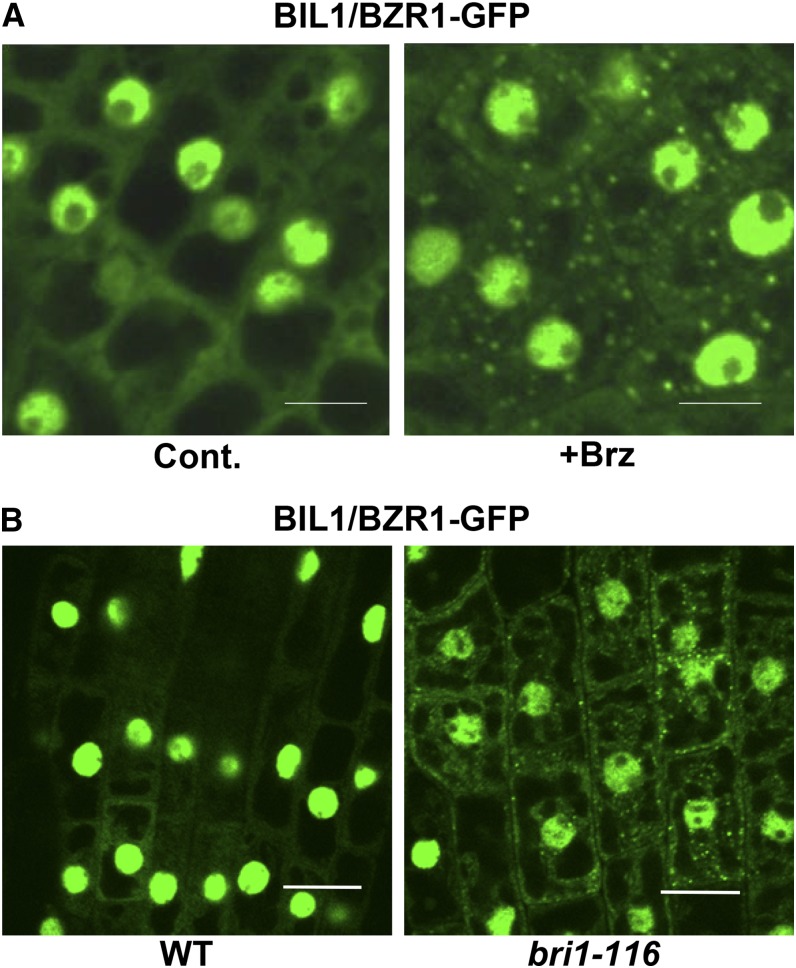
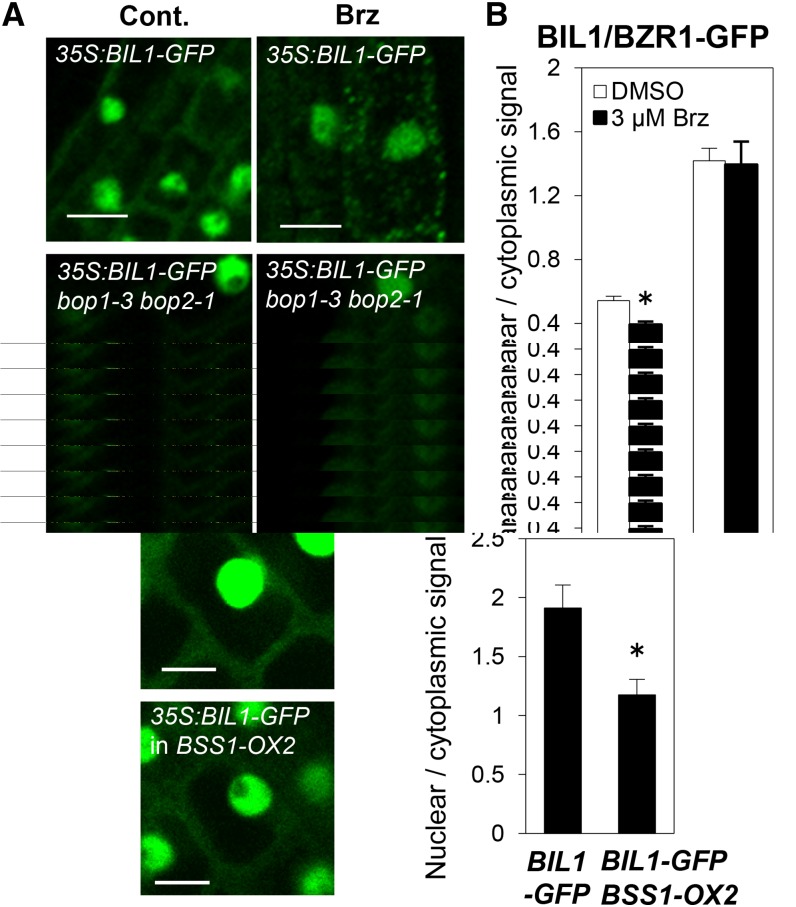
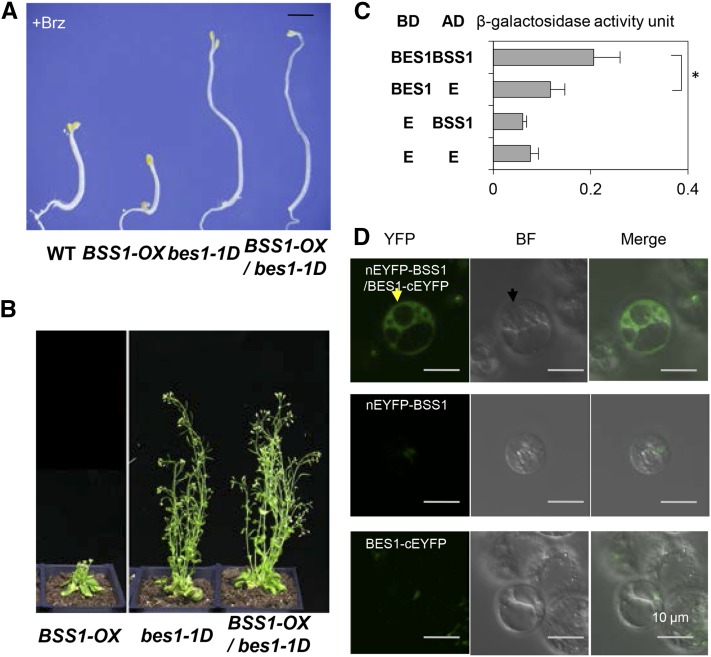
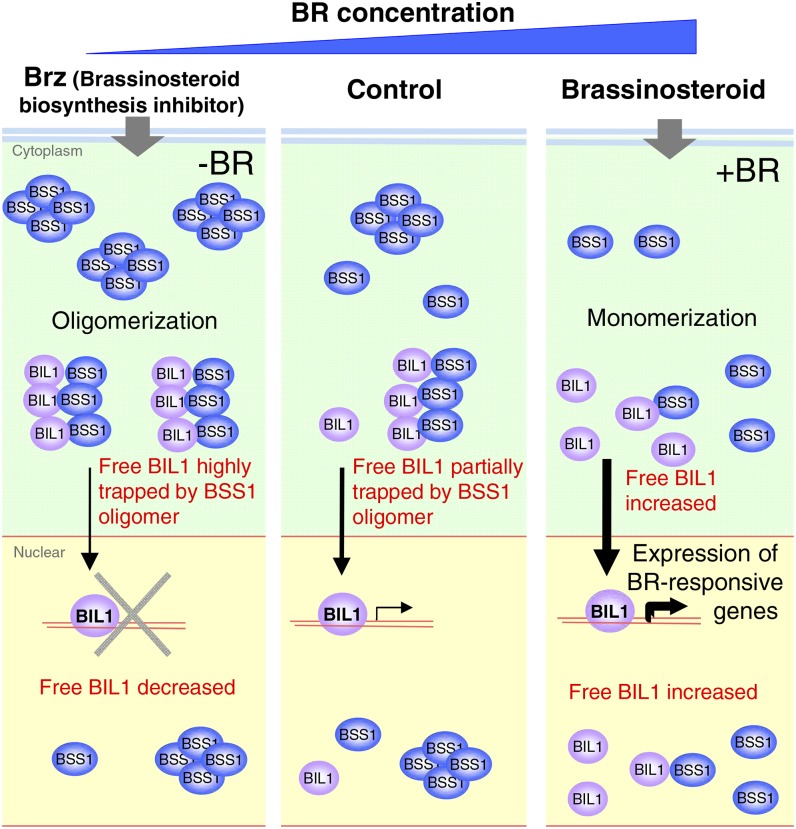
Brassinosteroids (BRs) play important roles in plant development and the response to environmental cues. BIL1/BZR1 is a master transcription factor in BR signaling, but the mechanisms that lead to the finely tuned targeting of BIL1/BZR1 by BRs are unknown. Here, we identified BRZ-SENSITIVE-SHORT HYPOCOTYL1 (BSS1) as a negative regulator of BR signaling in a chemical-biological analysis involving brassinazole (Brz), a specific BR biosynthesis inhibitor. The bss1-1D mutant, which overexpresses BSS1, exhibited a Brz-hypersensitive phenotype in hypocotyl elongation. BSS1 encodes a BTB-POZ domain protein with ankyrin repeats, known as BLADE ON PETIOLE1 (BOP1), which is an important regulator of leaf morphogenesis. The bss1-1D mutant exhibited an increased accumulation of phosphorylated BIL1/BZR1 and a negative regulation of BR-responsive genes. The number of fluorescent BSS1/BOP1-GFP puncta increased in response to Brz treatment, and the puncta were diffused by BR treatment in the root and hypocotyl. We show that BSS1/BOP1 directly interacts with BIL1/BZR1 or BES1. The large protein complex formed between BSS1/BOP1 and BIL1/BZR1 was only detected in the cytosol. The nuclear BIL1/BZR1 increased in the BSS1/BOP1-deficient background and decreased in the BSS1/BOP1-overexpressing background. Our study suggests that the BSS1/BOP1 protein complex inhibits the transport of BIL1/BZR1 to the nucleus from the cytosol and negatively regulates BR signaling.


Figures

Figure 1.
Figure 1.
The bss1-1D Mutant Showed a Brz-Hypersensitive Phenotype. (A) Dark-grown phenotypes of wild-type, bss1-1D, and BSS1/BOP1-OX plants on medium containing DMSO or 3 μM Brz for 7 d. Bars = 1 mm. (B) Hypocotyl lengths of the wild type, bss1-1D, and BSS1/BOP1-OX on medium containing different concentrations of Brz in the dark for 7 d. The results are presented as means ± sd (n > 30). (C) Phenotypes of bss1-1D and BSS1/BOP1-OX plants in soil under long-day conditions for 30 d. The insets at right show the phenotypes after 40 d. (D) Leaf morphology of wild-type and bss1-1D plants. (E) Diagram of the genomic region flanking the T-DNA insertion site in bss1-1D. (F) qRT-PCR analysis of the expression levels of BSS1/BOP1 (At3g57130) in light-grown wild-type, bss1-1D, and BSS1-OX lines shown in (C). The results are presented as means ± sd from four independent experiments. For all qRT-PCR analyses, ACT2 was used as the internal control.
Figure 2.
Figure 2.
BSS1/BOP1 Negatively Regulates BR Signaling. (A) Brz and BL responsiveness of BR-regulated genes in BSS1/BOP1-OX. The expression levels of TCH4, BAS1, IAA19, and SAUR-AC1 were analyzed by qRT-PCR in 7-d-old dark-germinated seedlings and treated with medium containing DMSO (Mock), 3 μM Brz (+Brz), or 100 nM BL (+BL) for 3 h. The data represent means ± sd of four independent replications. **P < 0.01, Student’s t test. (B) Immunoblot analysis of BIL1/BZR1 phosphorylation. Ten-day-old seedlings grown on medium with Brz were treated with 100 nM BL or mock solution for 3 h. Total proteins were extracted and analyzed by immunoblotting with an anti-BIL1/BZR1 antibody. P-BIL1 is phosphorylated BIL1/BZR1 and de P-BIL1 is dephosphorylated BIL1/BZR1. The top panel shows an immunoblot of BIL1/BZR1 protein extracted from wild-type and BSS1/BOP1-OX plants. The signal intensities of phosphorylated BIL1/BZR1 and dephosphorylated BIL1/BZR1 are shown by the top and bottom arrowheads, and each band signal is counted as a percentage relative to the level of phosphorylated BIL1/BZR1 in wild-type seedlings. The bottom panel shows a Ponceau S-stained gel.
Figure 3.
Figure 3.
BSS1/BOP1-Deficient Mutants Showed Brz Resistance and Positive Regulation for BR Signaling. (A) Dark-grown phenotypes of wild-type, bss1-1D, and BSS1/BOP1-deficient mutant plants on medium containing DMSO or 3 μM Brz for 7 d. Bar = 1 mm. (B) Relative hypocotyl lengths of bop1-3, bop2-1, and bop1-3 bop2-1 compared with the wild type on medium containing DMSO or 3 μM Brz after growth in the dark for 7 d. The results are presented as means ± sd (n = 34). *P < 0.05, Student’s t test. (C) Brz and BL responsiveness of BR-regulated genes in bop1-3 bop2-1. The expression levels of TCH4, BAS1, IAA19, and SAUR-AC1 were analyzed by qRT-PCR in 9-d-old light-germinated seedlings and treated with medium containing DMSO, 3 μM Brz, or 100 nM BL for 3 h. The data represent means ± sd of four independent replications. **P < 0.01, *P < 0.05, Student’s t test. (D) Immunoblot analysis of BIL1/BZR1 phosphorylation status of the wild type, bop1-3, and bop1-3 bop2-1. The experiment was performed as described in Figure 2B. The signal intensities of phosphorylated BIL1/BZR1 and dephosphorylated BIL1/BZR1 are shown above and below each band (arrowheads) and are presented as percentages relative to the level of phosphorylated BIL1/BZR1 in wild-type seedlings. The bottom panel shows a Ponceau S-stained gel.
Figure 4.
Figure 4.
BSS1/BOP1 mRNA Expression Is Induced by Brz and Light. (A) qRT-PCR analysis of the expression levels of BSS1/BOP1 in wild-type seedlings grown on medium without (Cont.) or with 3 μM Brz (+Brz) in the dark or light for 7 d. The data represent means ± sd from four independent replications. (B) GUS reporter gene expression in transgenic plants expressing BSS1/BOP1 pro:GUS. The samples were grown in the same conditions as in (A) for 3 d. Bars = 5 mm. (C) to (E) The BSS1/BOP1 expression level was calculated by qRT-PCR. Wild-type seedlings grown on medium with different concentrations of Brz (C) and BL (D) in the light for 7 d were used. Dark-grown seedlings exposed to light for 0 to 7 d were used in (E). The data represent means ± sd of four independent replications.
Figure 5.
Figure 5.
Brz Especially Increased BSS1/BOP1-GFP Punctate Structures in the Cytoplasm. (A) BSS1/BOP1-GFP in root cells of 10-d-old seedlings grown on medium with 3 μM Brz (left) or 100 nM BL (right). Cont., mock-treated control. Bars = 10 μm. (B) BSS1/BOP1-GFP in hypocotyl cells of 4-d-old seedlings grown in the dark were treated with 3 μM Brz (+Brz), the same amount of DMSO as mock treatment (Mock), or 100 μM BL (+BL) for 1 h. Bars = 20 μm. (C) to (E) Analysis of BSS1/BOP1-GFP puncta signal intensities upon treatment with Brz and BL (images shown in Supplemental Figure 3B). Seven-day-old BSS1/BIL1-GFP transgenic seedlings were treated for 3 h with 3 μM Brz (Brz), an equal volume of DMSO (Mock), or 100 μM BL (BL). The graphs show the number of puncta per cell (C), the ratio of puncta signal intensity compared with the whole-cell intensity (D) (n = 9), and the signal intensity of puncta (E) (n = 73). The results are represented as means ± se. The signal intensity was measured using ImageJ software (http://rsb.info.nih.gov/ij/). *P < 0.05, **P < 0.01, Student’s t test.
Figure 6.
Figure 6.
Punctate Structures of BSS1/BOP1 Are a Protein Complex in the Cytoplasm. (A) Nonreduced (−DTT) and reduced (+DTT) protein from the plant leaf was analyzed by immunoblotting using an anti-GFP antibody in transgenic plants grown on medium with Brz for 10 d. Oligomeric (O; red arrowhead) and monomeric (M; blue arrowhead) BSS1/BOP1-GFP are shown. BL induced a reduction in the amount of oligomeric and total BSS1. (B) Root cells of BSS1/BOP1-GFP transgenic plants stained with 4 μM FM4-64 for 30 min. Bars = 10 μm. (C) Root cells of BSS1/BOP1-GFP transgenic plants treated with 50 μM BFA for 1 h. Bars = 10 μm. (D) Hypocotyl cells of BSS1/BOP1-promoter:BSS1/BOP1-GFP transgenic plants grown for 4 d on medium with 3 μM Brz. White arrows show BBS1/BOP1-GFP puncta. Bar = 10 μm (E) Effects of ultracentrifugation and detergent treatment on BSS1 oligomers. Total lysates were prepared from the transgenic plants and ultracentrifuged to separate the insoluble (precipitation) and soluble (supernatant) fractions. The insoluble fractions were then treated with the indicated detergents and subjected to further ultracentrifugation. The resulting supernatants and pellets were analyzed by immunoblotting. As a control, the indicated detergent-treated BIL2-GFP (protein localized to the mitochondria) samples were centrifuged as above.
Figure 7.
Figure 7.
BSS1/BOP1 Interacts with BIL1/BZR1 and Inhibits BIL1/BZR1 Transport to the Nucleus from the Cytosol. (A) Phenotypes of the wild type, bss1-1D, bil1-1D, and the bss1-1D bil1-1D double mutant grown on medium containing 3 μM Brz in the dark for 7 d. Bar = 1 mm. (B) Phenotypes of bss1-1D, bil1-1D, and the bss1-1D bil1-1D double mutant grown in soil in long-day conditions for 40 d. (C) Yeast two-hybrid assay between BSS1/BOP1 and BIL1/BZR1 based on measuring β-galactosidase activity. BIL1/BZR1 was fused with the binding domain (BD) and BSS1/BOP1 was fused with the prey domain (AD). Empty vector (E) was used as a control. The results are presented as means ± sd from three independent replications. (D) Coimmunoprecipitation (IP) of BSS1/BOP1 and BIL1/BZR1. Col-0, FLAG-BIL1, BSS1-GFP, and BSS1-GFP FLAG-BIL1 seedlings were grown on plates under light for 23 d. FLAG-BIL1 was immunoprecipitated using an anti-FLAG antibody and immunoblotted using anti-GFP and anti-FLAG antibodies (E) BiFC analysis of the interaction between BSS1/BOP1 (nEYFP-BSS1) and BIL1/BZR1 (BIL1-cEYFP) in Arabidopsis protoplast cells. The protoplast medium contained DMSO, 100 nM BL, or 3 μM Brz, and cells were cultured for 12 h. The bottom panels show protoplasts cotransformed with nYFP-BSS1 and BSS1-cEYFP. YFP, YFP fluorescence; BF, bright field; Merge, merged image of YFP and BF. Arrows point to the nucleus. Bars = 5 μm.
Figure 8.
Figure 8.
BIL1/BZR1-GFP Was Observed as Puncta in the BR-Deficient State. (A) BIL1/BZR1-GFP in root cells of 4-d-old seedlings grown on medium with 3 μM Brz (+Brz) or DMSO (Cont.). Bars = 10 μm. (B) BIL1/BZR1-GFP in root cells of 4-d-old seedlings in the wild-type or bri1-116 background grown in the dark. Bars = 10 μm.
Figure 9.
Figure 9.
BSS1/BOP1 Inhibited the Transport of BIL1/BZR1 from the Cytosol to Nuclei. (A) Images of BIL1/BZR1-GFP in root cells of 4-d-old wild-type or bop1-3 bop2-1 seedlings grown on medium containing DMSO (Cont.) or 3 μM Brz (Brz). Bars = 10 μm. (B) Graph showing the ratio of the nuclear-to-cytosolic signal intensity in root cells of 4-d-old seedlings. The results are presented as means ± se (n = 61). *P < 0.01, Student’s t test. (C) Images of BIL1/BZR1-GFP in root cells of 4-d-old seedlings grown on medium in the wild-type or BSS1-OX2 background after treatment with 3 μM Brz for 3 h. Bars = 10 μm. (D) Graph showing the ratio of the nuclear-to-cytoplasmic signal intensity. The results are presented as means ± sd (n = 27). *P < 0.01, Student’s t test.
Figure 10.
Figure 10.
BSS1/BOP1 Interacts with BES1 and Inhibits BES1 Transport to the Nucleus from the Cytosol. (A) Dark-grown phenotypes of the wild type, bss1-1D, bes1-1D, and the bss1-1D bes1-1D double mutant grown on medium containing 3 μM Brz in the dark for 7 d. Bar = 1 mm. (B) Phenotypes of bss1-1D, bes1-1D, and the bss1-1D bil1-1D double mutant grown in the soil in long-day conditions for 40 d. (C) Interaction between BSS1/BOP1 and BES1 using a yeast two-hybrid assay, as assessed by measuring β-galactosidase activity. cDNA encoding BES1 without the first 20 amino acids was cloned into the pDEST32 binding domain vector (BD). The cDNA of BSS1 was cloned into the pDEST22 prey vector (AD). Empty vector (E) was used as a control. The results are presented as means ± sd from three independent replicates. *P < 0.05, Student’s t test. (D) BiFC analysis of the interaction between BSS1/BOP1 and BES1 in Arabidopsis protoplast cells. The protoplast cells were cotransformed with nEYFP-BSS1 and/or BES1-cEYFP constructs. The protoplast cells were grown in medium containing DMSO as a control experiment. YFP, YFP fluorescence; BF, bright field; Merge, merged image of YFP and BF. Arrows point to the nucleus. Bars = 5 μm.
Figure 11.
Figure 11.
Model of BSS1/BOP1 Function in BR Signaling. In the absence of BR activation by Brz, BSS1/BOP1 mRNA expression was induced. BSS1/BOP forms homooligomers and binds BIL1/BZR1, preventing the transport of BIL1/BZR1 to the nucleus. Upon stimulation of BR, the BSS1/BOP1 oligomer was reduced to a monomer, allowing BIL1/BZR1 to be transferred to the nucleus and to induce the expression of BR-responsive genes. BSS1/BOP1 must regulate BR signaling tightly to prevent the activation of BIL1/BZR1 and BES1 when plants should repress BR signaling, such as in the absence of BR or when seedlings are grown under light.

Similar articles

Cited by

References

    1. Aida M., Ishida T., Fukaki H., Fujisawa H., Tasaka M. (1997). Genes involved in organ separation in Arabidopsis: An analysis of the cup-shaped cotyledon mutant. Plant Cell 9: 841–857. - PMC - PubMed
    1. Arnaud N., Laufs P. (2013). Plant development: Brassinosteroids go out of bounds. Curr. Biol. 23: R152–R154. - PubMed
    1. Asami T., Min Y.K., Nagata N., Yamagishi K., Takatsuto S., Fujioka S., Murofushi N., Yamaguchi I., Yoshida S. (2000). Characterization of brassinazole, a triazole-type brassinosteroid biosynthesis inhibitor. Plant Physiol. 123: 93–100. - PMC - PubMed
    1. Asami T., Mizutani M., Fujioka S., Goda H., Min Y.K., Shimada Y., Nakano T., Takatsuto S., Matsuyama T., Nagata N., Sakata K., Yoshida S. (2001). Selective interaction of triazole derivatives with DWF4, a cytochrome P450 monooxygenase of the brassinosteroid biosynthetic pathway, correlates with brassinosteroid deficiency in planta. J. Biol. Chem. 276: 25687–25691. - PubMed
    1. Asami T., Nakano T., Nakashita H., Sekimata K., Shimada Y., Yoshida S. (2003). The influence of chemical genetics on plant science: Shedding light on functions and mechanism of action of brassinosteroids using biosynthesis inhibitors. J. Plant Growth Regul. 22: 336–349. - PubMed

Publication types

MeSH terms