. 2014:155:1-68.
doi: 10.1002/9781118755815.ch01.

Modeling Viral Capsid Assembly

Affiliations

Modeling Viral Capsid Assembly

Michael F Hagan. Adv Chem Phys. 2014.

Abstract

I present a review of the theoretical and computational methodologies that have been used to model the assembly of viral capsids. I discuss the capabilities and limitations of approaches ranging from equilibrium continuum theories to molecular dynamics simulations, and I give an overview of some of the important conclusions about virus assembly that have resulted from these modeling efforts. Topics include the assembly of empty viral shells, assembly around single-stranded nucleic acids to form viral particles, and assembly around synthetic polymers or charged nanoparticles for nanotechnology or biomedical applications. I present some examples in which modeling efforts have promoted experimental breakthroughs, as well as directions in which the connection between modeling and experiment can be strengthened.


Figures
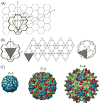
Fig. 1
Fig. 1
The geometry of icosahedral lattices. (A) Different equilateral triangular facets can be constructed on a hexagonal lattice by moving integer numbers of steps along each of the ĥ and lattice vectors. (B) Construction of a T=3 lattice. Twenty copies of the triangular facet (left) obtained by moving one step along each of the ĥ and k̂ lattice vectors are arranged as shown in the middle panel, and then folded to obtain the icosahedral structure shown on the right. To connect this construction to a capsid, note that each pentagon will comprise five proteins in identical environments and each hexagon will comprise six subunits in two different types of local environments, resulting in a total of 180 proteins in three distinct local environments. (C) Example icosahedral capsid structures. From left to right are shown the T=1 satellite tobacco mosaic virus capsid (STMV) PDBID 1A34 [152], the T=3 cowpea chlorotic mottle virus capsid (CCMV) PDBID 1CWP [238], and the T=4 human hepatitis B viral capsid (HBV) PDBID 1QGT [276]. Structures are shown scaled to actual size, and the protein conformations are indicated by color. In each image the 60 pentameric subunits are colored blue. The images of capsids in (C) were obtained from the Viper database [212]. The images in (A) and (B) were reprinted from J. Mol. Biol, Johnson and Speir, 269, 665-675 (1997) Quasi-equivalent viruses: A paradigm for protein assemblies, with permission from Elsevier.
Fig. 2
Fig. 2
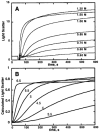
(A) Light scattering measured as a function of time for 5 μM dimer of HBV capsid protein at indicated ionic strengths. Light scatter is approximately proportional to the mass-averaged molecular weight of assemblages and, under conditions of productive assembly, closely tracks the fraction of subunits in capsids (see text). (B) Simulated light scattering for 5 μM subunit with indicated values of the subunit-subunit binding free energy (gb) using the rate equation approach described in section III B. Figures reprinted with permission from Biochemistry, 38, 14644-14652 (1999), A Theoretical Model Successfully Identifies Features of Hepatitis B Virus Capsid Assembly, Zlotnick, Johnson, Wingfield, Stahl, Endres, Copyright (1999) American Chemical Society.
Fig. 3
Fig. 3
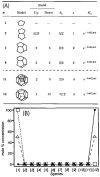
(A) The assembly model for a dodecahedral capsid and the statistical weights associated with symmetries for the intermediates. The columns list respectively the number of intermediates, the lowest energy configuration, the degeneracy for adding an additional subunit (sn in Eq.20 below), the degeneracy for losing a subunit (ŝn in Eq.20), the net degeneracy ( Sndegen in Eq. 3), the number of contacts gained by adding a subunit( njc in Eq. 3), and the corresponding equilibrium constant. Only the first four and last two intermediates are shown; the full set are given in Ref. [286]. (B) The mole fractions of each intermediate calculated using Eq. 5 and the statistical factors in (A) are shown for total subunit concentrations ρT of 0.44μM (□), 0.88μM ((△), and 1.8μM (●). Figures reprinted from J. Mol. Biol, 241, Zlotnick, To Build a Virus Capsid: An Equilibrium Model of the Self Assembly of Polyhedral Protein Complexes, 59-67 Copyright(1994) with permission from Elsevier.
Fig. 4
Fig. 4
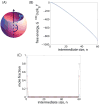
(A) Depiction of the continuum model description of partial capsid intermediates considered by Zandi et al [280]. R is the radius of the capsid and the angle θ characterizes the extent of completion of the capsid. (B) Interaction free energy G(n) as a function of intermediate size n obtained from Eq.6. (C) Predicted mole fractions using Eq. 6 and Eq. 4 for ρT = ρ* (⋄), ρT = 2ρ* (□), and ρT = 5ρ* (◦). gs = −15kBT for (B) and (C).
Fig. 5
Fig. 5
Fraction capsid fc as a function of subunit oversaturation ρ/ρ* predicted by Eq. 10 for the number of subunits in a complete capsid N = 12, 60, and 1000.
Fig. 6
Fig. 6
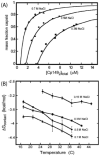
(A) Fraction capsid measured for assembly of empty HBV capsids from capsid protein in which the RNA binding domain has been truncated, Cp149, using SEC as a function of total dimer subunit concentration [CP149]total. Results are shown for indicated salt concentrations, and the lines are fits to the equilibrium model with GNcap=240gbTlog(sN) assuming four contacts per subunit and using the contact energy gb as a salt concentration dependent fit parameter, with the symmetry number of the complete T=4 capsid as sN = 2119/120 [47]. (B) Estimated values of gb as a function of temperature and ionic strength. Reprinted with permission from Ceres and Zlotnick, J. Mol. Biol, 41, 11525-11531 (2002), Weak Protein-Protein Interactions Are Sufficient To Drive Assembly of Hepatitis B Virus Capsids, Copyright (2002) American Chemical Society.
Fig. 7
Fig. 7
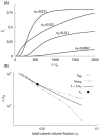
The grand free energy as a function of intermediate size for different free subunit supersaturation values (ρ1/ρ*) as calculated by the continuum model for a capsid with 90 subunits. These curves would correspond to the free energy profiles at increasing times for a reaction which begins with ρ1 = 3ρ* and proceeds toward equilibrium with ρ1 = ρ*.
Fig. 8
Fig. 8
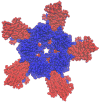
Image of the CCMV pentamer of dimers that experiments [289] indicate is the critical nucleus. Atoms are shown in van der Waals representation and colored according to their quasi-equivalent conformation, with A monomers in blue and B monomers in red. The coordinates were obtained from the CCMV crystal structure, PDBID 1CWP [238] using the Viper oligomer generator [212] and the image was generated with VMD [123].
Fig. 9
Fig. 9
The scaling expression for the median assembly time τ1/2 as a function of subunit concentration predicted by Eq. 18 is compared to full numerical solutions of the rate equations Eq. 14 (see section III B). The numerical results are shown for completion fraction fc (□) and estimated light scattering (+), while the theoretical prediction Eq. 18 is shown as a dashed line. The estimate for the crossover concentration ρc (Eq. 19) above which the light scattering and completion fraction do not match is shown with a • symbol, and the concentration at which the monomer starvation kinetic trap increases overall assembly times ρkt is shown as a ■ symbol. Parameter values are gnuc = 7kBT (≈ 4 kcal/mol) [47], gelong = 2gnuc, gn = 4gnuc, capsid size N = 120 corresponding to 120 dimer subunits in a Hepatitis B Virus capsid [47], the critical nucleus size nnuc = 5, and the subunit association rate constant f = 105 M−1s−1 [126]. Based on data from Ref. [107].
Fig. 10
Fig. 10
The lag time is related to the mean elongation time. (A) Completion fractions fc measured from Brownian dynamics simulations of a particle based model (section III C) are shown as a function of time for indicated total subunit volume fractions (vT). (B) The duration of the lag phases from the simulations shown in (A) are compared to mean capsid elongation times. The crossover volume fraction vc estimated from Eq. 19 is shown as a • symbol. The plotted data is from Ref. [107].
Fig. 11
Fig. 11
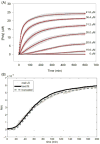
(A) In vitro assembly of HIV CA protein into tubes monitored by absorbance (red diamonds, with thick grey lines indicating error bars) at indicated subunit concentrations compared to best fits using a rate equation model (black lines). (B) Light scattering for HPV LP1 assembly from Casini et al. [44] (light grey diamonds) compared to a continuous time Monte Carlo trajectory using parameters optimized to the data (solid black line). The dashed curve corresponds to a trajectory with parameter values reduced by 2.5 × 10⁵ from their optimal values and negative values truncated to zero, to simulate a threshold level of signal to background scattering. (A) is reprinted with permission from Biochemistry, 51, 4416-4428 (2012), A Trimer of Dimers Is the Basic Building Block for Human Immunodeficiency Virus-1 Capsid Assembly, Tsiang, Niedziela-Majka, Hung, Jin, Hu, Yant, Samuel, Liu, Sakowicz, Copyright (2012) American Chemical Society. (B) is reprinted with permission from Phys. Biol., 7, 045005 (2010), Kumar and Schwartz, A parameter estimation technique for stochastic self-assembly systems and its application to human papillomavirus self-assembly, Copyright (2010) IOP Publishing.
Fig. 12
Fig. 12
Examples of two classes of models for icosahedral shells. (A) A patchy-sphere model with the pentavalent subunit interaction geometry of a T=1 capsid (see Fig. 1C), but spherically symmetric excluded-volume [105]. In the top image, two interacting subunits are shown, with numbered arrows indicating the locations of the 5 distinct attractive patches. The lower image shows an assembled capsid, with patches colored green. (B) An extended subunit representation of a T=1 capsid. In the top image, the large cyan spheres experience repulsive excluded-volume interactions while small yellow spheres on complementary faces experience attractive interactions. The lower image shows a complete capsid, with subunits reduced in size for visibility and the locations of attractive patches indicated by green cylinders. The images in (B) are reprinted with permission from Rapaport, Phys. Rev. E, 70, 051905 (2004), Self-assembly of polyhedral shells: A molecular dynamics study, Copyright (2004) by the American Physical Society.
Fig. 13
Fig. 13
The time evolution of cluster size distributions are shown for three interaction strengths, parameterized by e, for molecular dynamics simulations of the triangular subunit model shown in Fig. 12B. The model capsid comprises 20 subunits; the system has entered a kinetic trap at the highest interaction strength. Figure reprinted with permission from Phys. Biol., 7, 045001 (2010), Rapaport, Modeling capsid self-assembly: design and analysis, Copyright (2010) IOP Publishing.
Fig. 14
Fig. 14
Assembly products at long times for 60-subunit patchy-sphere model T=1 shells as functions of binding energy εb, angular specificity, θm, and total particle concentration ρT. Solid squares indicate parameter sets for which there were significant yields of well-formed capsids fc ≥ 0.3, while open squares indicate poor assembly, fc < 0.3. The dashed line indicates the parameter values above which significant capsid assembly should occur at equilibrium. The location of the five regimes discussed in the text are shown on the phase diagram on the left. Figure based on Ref. [105].
Fig. 15
Fig. 15
Assembly products at long times for a 20-subunit extended subunit T=1 shell as a function of temperature (i.e. inverse of interaction strength) and particle concentration. Representative structures are shown for the well-formed and mis-assembled regions. Figure adapted with permission from Nano Lett., 7, 338-344 (2007), Deciphering the kinetic mechanism of spontaneous self-assembly of icosahedral capsids, Nguyen, Reddy, and Brooks, Copyright (2007) American Chemical Society.
Fig. 16
Fig. 16
Assembly products at long times for a 12-subunit patchy-sphere model icosahedron. The fraction of subunits in target clusters is shown as a function of the patch width σ (measured in radians) and reduced temperature. The inset shows the equivalent plot for a system with the same parameters except without dihedral terms in the interaction potential. The image at the top right shows the target structure, while the lower images show regions of the system for simulation at the indicated parameter values. The white lines show the temperature for the equilibrium transition from assembled clusters to a gas of monomers calculated from umbrella sampling. Figure and images reprinted with permission from J. Chem. Phys., 131, 175102 (2009), Monodisperse self-assembly in a model with protein-like interactions, Wilber, Doye, Louis, and Lewis, Copyright(2009) American Institute of Physics.
Fig. 17
Fig. 17
Population distribution of structures obtained at long times for near optimal parameters using discontinuous molecular dynamics for a T=1 model by Nguyen et al. [190]. The structures were defined by Nguyen et al. [190] as (A) complete icosahedral capsids, (B) oblate capsules, (C) angular capsules, (D) twisted capsules, (E) tubular capsules, (F) prolate capsules, (G) conical capsules, (H) partial capsids, and (I) open mis-aggregates. Figure reprinted with permission from J. Am. Chem. Soc. 131, 2606-14 (2009), Invariant polymorphism in virus capsid assembly, Nguyen, Reddy, and Brooks, Copyright(2009) by the American Chemical Society.
Fig. 18
Fig. 18
The capsid model from Ref.[76]. (A) The model subunit, as viewed from inside the capsid. The gray overlapping spheres interact via repulsive potentials [266], complementary capsomer-capsomer attractors (green spheres at the subunit edges) experience attractive interactions and the capsomer-polymer attractors (blue spheres on the subunit inner surface) experience short-range attractions to polymer segments. Sphere sizes indicate the interaction length scale. (B) Image of a well-formed capsid assembled around a polymer (shown in red). (C) Visualization of the polymer density inside the capsid. The polymer density is averaged over a large number of successful assembly trajectories after completion, for a polymer with length Np = 150 segments. Densities are averaged over the threefold symmetry of the capsomer, but not over the 20-fold symmetry group of the completed capsid. Images reprinted with permission from Phys. Biol., 7, 045003 (2010), Elrad and Hagan, Encapsulation of a polymer by an icosahedral virus, Copyright (2010) IOP Publishing.
Fig. 19
Fig. 19
The capsid model from Ref. [172]. (A) The model subunit. All beads experience repulsive excluded-volume interactions. In addition, pairs of white beads experience short-range attractive interactions and the pink beads have a charge of +e. Electrostatics interactions are represented by Debye Huckel interactions. (B). The low-energy capsid structure. Images reprinted with permission from J. Chem. Phys., 136, 135101 (2012), Langevin dynamics simulation of polymer-assisted virus-like assembly, Mahalik and Muthukumar, Copyright(2012) American Institute of Physics.
Fig. 20
Fig. 20
Kinetic phase diagram showing the dominant assembly product as a function of polymer length Np and capsomer-polymer interaction strength εcp for capsomer-polymer interaction strength εcc = 4.0kBT and subunit concentration log ρT = −7.38. The legend on the right shows snapshots from simulations that typify each dominant configuration. Figure reprinted with permission from Phys. Biol., 7, 045003 (2010), Elrad and Hagan, Encapsulation of a polymer by an icosahedral virus, Copyright (2010) IOP Publishing
Fig. 21
Fig. 21
Doublet virus-like particles assembled from CCMV capsid proteins around tobacco mosaic virus (TMV) RNA, with 6400 nucleotides or approximately twice the number of nucleotides packaged in a native CCMV virion [43]. Negative-stain transmission electron microscopy images are shown and the scale bar is 50 nm. Image provided by C. Knobler and W. Gelbart.
Fig. 22
Fig. 22
Two mechanisms for assembly around a polymer [76]. (A) Strong subunit-subunit interactions and relatively weak subunit-polymer interactions led to a nucleation and growth mechanism, where first a small partial capsid formed on the polymer followed by sequential addition of subunits. (B) Weaker subunit-subunit interactions and stronger subunit-polymer interactions led to a disordered assembly mechanism, where more than 20 subunits (the size of a complete capsid) bound to the polymer in a disordered arrangement, followed by annealing of multiple intermediates and finally completion. Figure reprinted with permission from Phys. Biol., 7, 045003 (2010), Elrad and Hagan, Encapsulation of a polymer by an icosahedral virus, Copyright (2010) IOP Publishing.
Fig. 23
Fig. 23
Snapshots from a simulation in Ref. [172], in which assembly proceeded by the disordered assembly mechanism. Images reprinted with permission from J. Chem. Phys., 136, 135101 (2012), Langevin dynamics simulation of polymer-assisted virus-like assembly, Mahalik and Muthukumar, Copyright(2012) American Institute of Physics.
Fig. 24
Fig. 24
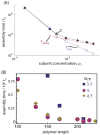
Assembly times depend on subunit concentration and polymer length in simulations of assembly around a polymer. (A) The median overall assembly time τ (▲ symbol), nucleation time τnuc (□ symbol), and elongation time τelong (+ symbol) are shown as a function of subunit density for the model in Fig. 18. Simulations at the lowest concentration used forward flux sampling [4, 5] to overcome the large nucleation barrier. (B) The median elongation time is shown as a function of polymer length for several values of the polymer-subunit interaction strength, εcp. The plot in (B) is reprinted with permission from Phys. Biol., 7, 045003 (2010), Elrad and Hagan, Encapsulation of a polymer by an icosahedral virus, Copyright (2010) IOP Publishing.

Similar articles

Cited by

References

    1. Adolph KW, Butler PJG. Studies on assembly of a spherical plant virus.1. States of aggregation of isolated protein. J Mol Bio. 1974;88(2):327–341. - PubMed
    1. Alberts Bruce. Essential cell biology. Garland Science; New York; London: 2010.
    1. Alder BJ, Wainwright TE. Studies in molecular dynamics.1. General method. J Chem Phys. 1959;31(2):459–466.
    1. Allen RJ, Frenkel D, ten Wolde PR. Simulating rare events in equilibrium or nonequilibrium stochastic systems. J Chem Phys. 2006;124(2) - PubMed
    1. Allen RJ, Warren PB, ten Wolde PR. Sampling rare switching events in biochemical networks. Phys Rev Lett. 2005;94(1) - PubMed

LinkOut - more resources