

doi: 10.1257/jep.27.2.109.
Investing in Preschool Programs
Affiliations
- PMID: 25663745
- PMCID: PMC4318654
- DOI: 10.1257/jep.27.2.109
Item in Clipboard
Investing in Preschool Programs
J Econ Perspect.
2013 Spring.
No abstract available
Figures
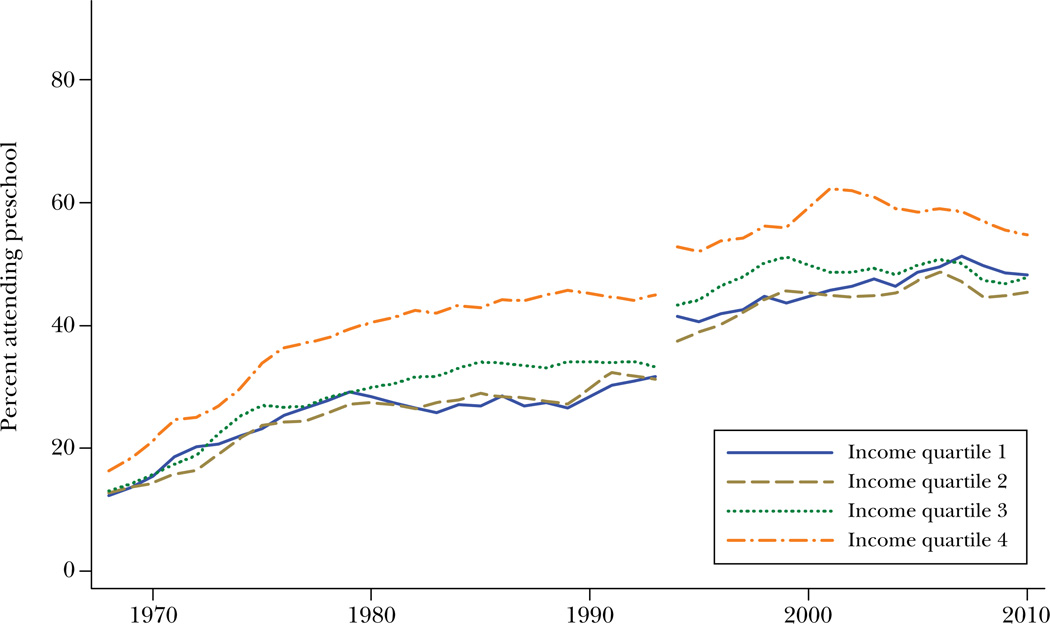
Percent of Three- and Four-year-olds Enrolled in Preschool by Family Income Quartile Source: Authors using data from the October Current Population Survey. Notes: Data represent three-year moving averages. Parents report on whether the child attends “regular school.” The line break in 1994 corresponds to the addition of a question prompt, which defined regular school as including “nursery school, kindergarten or elementary school …” See Magnuson, Meyers, and Waldfogel (2007) for further discussion of how the Current Population Survey compares with other sources of data on preschool enrollment.
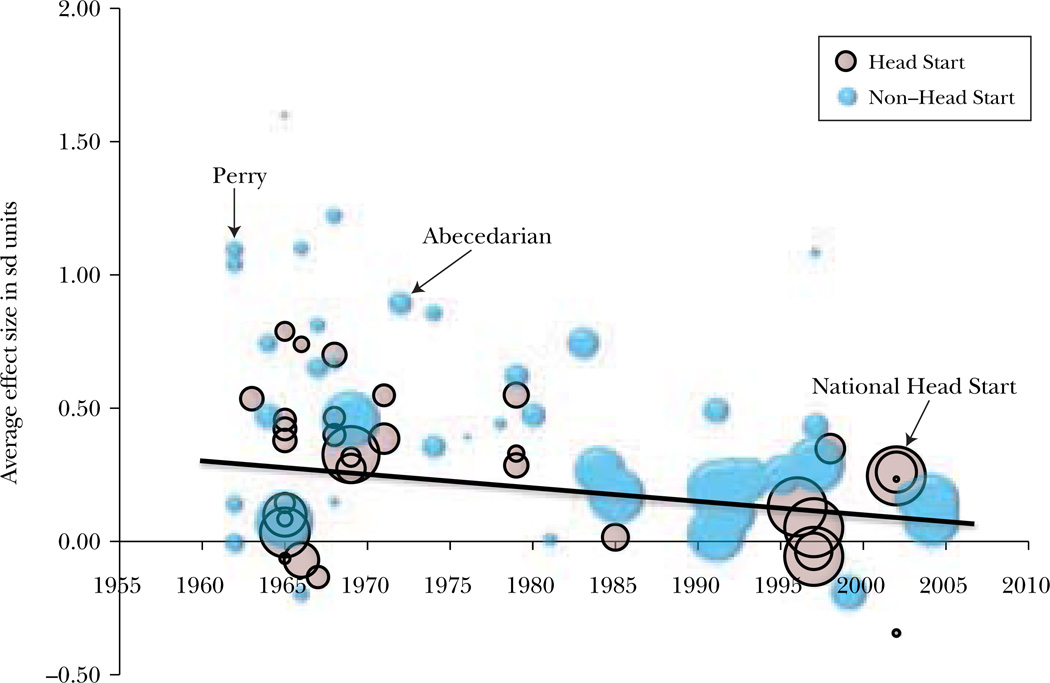
Average Impact of Early Child Care Programs at End of Treatment (standard deviation units) Source: Authors. Notes: Figure 2 shows the distribution of 84 program-average treatment effect sizes for cognitive and achievement outcomes, measured at the end of each program’s treatment period, by the calendar year in which the program began. Reflecting their approximate contributions to weighted results, “bubble” sizes are proportional to the inverse of the squared standard error of the estimated program impact. There is a weighted regression line of effect size by calendar year.
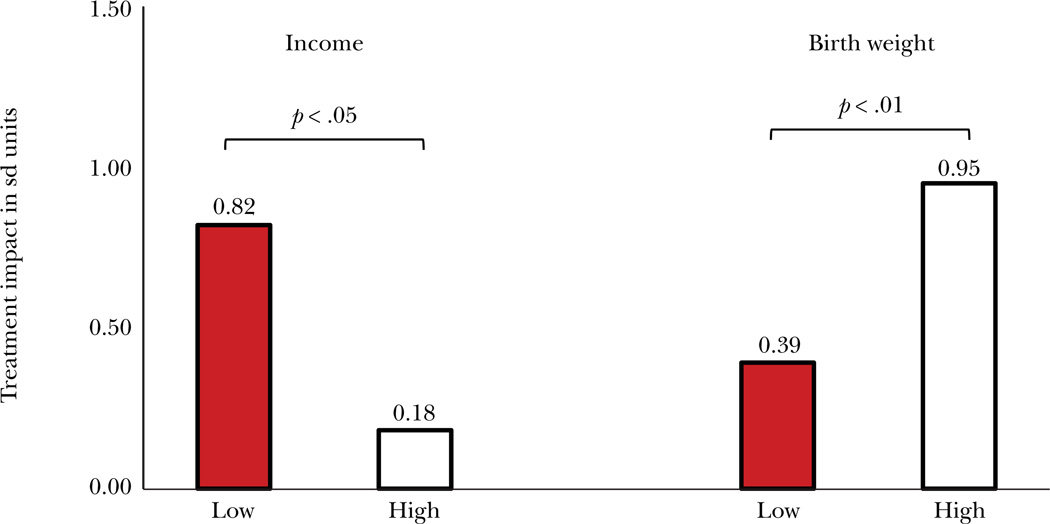
Impacts of the Infant Health and Development Program on Age-3 IQ, by Income and Birth Weight (standard deviation units) Source: Authors. Notes: The figure shows the impact, in standard deviation units, of the Infant Health and Development Program treatment on Age-3 IQ, for lower- and higher-income children and for lower- and higher-birth-weight children in the program. All models also condition on child gender, birth weight, gestational age at birth, neonatal health index, and site indicators.
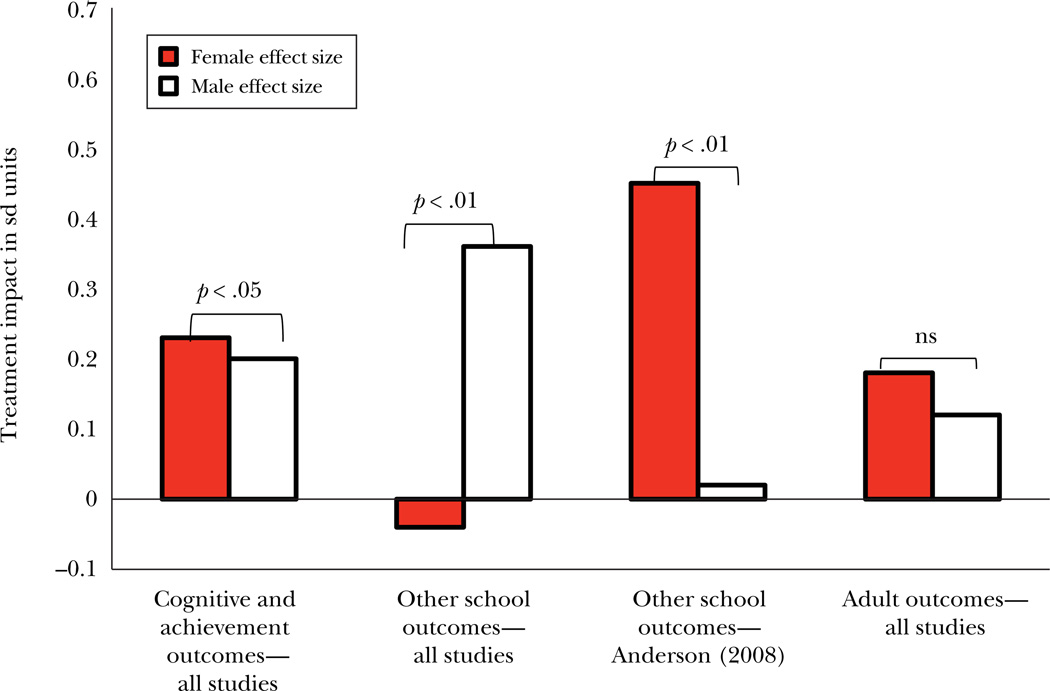
Gender Differences in Early Childhood Education Impacts (standard deviation units) Source: Adapted from Kelchen, Magnuson, Duncan, Schindler, Shager, and Yosikawa (2012), figure 2. Note: This figure looks at outcomes by gender for the three programs evaluated in Anderson (2008)—Perry, Abecedarian, and the Early Training Project—and for a group of 22 programs that included the three programs evaluated in Anderson (2008) plus 19 other programs that estimated program impacts by gender.
References
-
- Adams Gina, Rohacek Monica. More Than a Work Support? Issues around Integrating Child Development Goals into the Child Care Subsidy System. Early Childhood Research Quarterly. 2002;17(4):418–440.
-
- Almlund Mathilde, Duckworth Angela L, Heckman James J, Kautz Tim. IZA Discussion Paper 5500. 2011. Personality Psychology and Economics.
-
- Anderson Michael. Multiple Inference and Gender Differences in the Effects of Early Intervention: A Reevaluation of the Abecedarian, Perry Preschool, and Early Training Projects. Journal of the American Statistical Association. 2008;103(484):1481–1495.
-
- Aos Steve, Lieb Roxanne, Mayfield Jim, Miller Marna, Pennucci Annie. Benefits and Costs of Prevention and Early Intervention Programs for Youth. Washington State Institute for Public Policy; 2004. Sep 12, http://www.wsipp.wa.gov/rptfi les/04-07-3901.pdf.
-
- Steven Barnett W, Carolan Megan E, Fitzgerald Jen, Squires James H. The State of Preschool 2011: State Preschool Yearbook. Rutgers: National Institute for Early Education Research; 2011.
Grants and funding
LinkOut - more resources
Full Text Sources
Other Literature Sources
Medical