. 2015 Feb;9(2):113-119.
doi: 10.1038/nphoton.2014.323.

Swept confocally-aligned planar excitation (SCAPE) microscopy for high speed volumetric imaging of behaving organisms

Affiliations

Swept confocally-aligned planar excitation (SCAPE) microscopy for high speed volumetric imaging of behaving organisms

Matthew B Bouchard et al. Nat Photonics. 2015 Feb.

Abstract

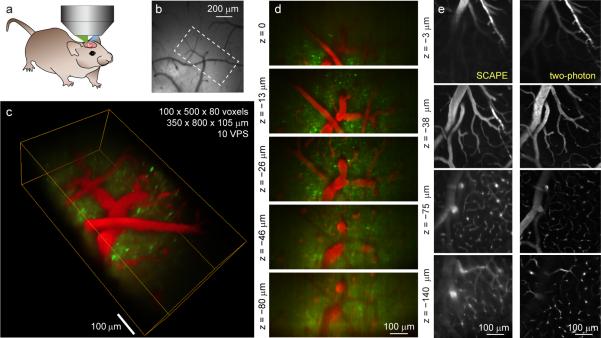
We report a new 3D microscopy technique that allows volumetric imaging of living samples at ultra-high speeds: Swept, confocally-aligned planar excitation (SCAPE) microscopy. While confocal and two-photon microscopy have revolutionized biomedical research, current implementations are costly, complex and limited in their ability to image 3D volumes at high speeds. Light-sheet microscopy techniques using two-objective, orthogonal illumination and detection require a highly constrained sample geometry, and either physical sample translation or complex synchronization of illumination and detection planes. In contrast, SCAPE microscopy acquires images using an angled, swept light-sheet in a single-objective, en-face geometry. Unique confocal descanning and image rotation optics map this moving plane onto a stationary high-speed camera, permitting completely translationless 3D imaging of intact samples at rates exceeding 20 volumes per second. We demonstrate SCAPE microscopy by imaging spontaneous neuronal firing in the intact brain of awake behaving mice, as well as freely moving transgenic Drosophila larvae.


Figures

Figure 1
Figure 1. SCAPE imaging geometry and image formation
(a) Illustrates SCAPE's scanning-descanning geometry that sweeps an oblique light sheet back and forth across the sample while the descanned detection plane remains stationary. The only moving component is the slowly oscillating polygonal scanning mirror. (b) Shows how the oblique light sheet illuminates the sample, while emitted light is collected by the same objective lens (‘scan’, ‘lateral’ and ‘depth’ (x’-y’-z’) directions define the non-Cartesia SCAPE coordinate system). (c) Illustrates how images are captured as the light sheet sweeps (mCherry-MHC Drosophila larva). (d) SCAPE resolution depends upon the axial and lateral resolutions of the low NA input light sheet (Ri,lat and Ri,ax), the higher NA detection side (Rd,lat and Rd,ax), and the relative angle between them. (e) Fourier-optics modeled point spread function (PSF) for an Olympus XLUMPlanFl 20x/0.95W objective [20, 21]. See Supplemental sections for additional optical layouts, simulations and performance analysis.
Figure 2
Figure 2. SCAPE microscopy in mouse brain
(a) Shows SCAPE image acquisition geometry, (b-d) Imaging in an awake, behaving mouse with intravascualar Texas red dextran (red), and GCaMP6f in superficial dendrites from layer V neurons (green). b) Camera image of exposed cortex showing approximate SCAPE field of view, c: Rendering of a single 350 × 800 × 105 microns (x’-y’-z’) volume acquired in 0.1 seconds (see Supplemental movie M1). d) Individual x’-y’ planes extracted from the same SCAPE volume (each plane is an average of 5 sequential time-points). (e) Comparison between two-photon microscopy and SCAPE in a urethane-anesthetized mouse with intravascular FITC-dx at 4 different depths (linear grayscale). Slower, higher x’ resolution SCAPE acquisition demonstrates that 5-10 micron capillaries can be resolved to depths of at least 140 microns with 488 nm excitation. Supplemental movie M2 shows depth slices to 200 microns. Supplemental Figure S7 shows x-z and y-z projections.
Figure 3
Figure 3. SCAPE microscopy of neuronal calcium dynamics in awake mouse brain
(a). Camera image of exposed cortex showing SCAPE field of view. Yellow line shows location of the conventional two-photon axial section shown in (b), yellow box indicates SCAPE depth range. (c) shows a volume rendering (Amira™ volren) of the dendritic trees captured by SCAPE, each corresponding to a specific event during the 180 second acquisition period. Color-matched raw time-courses for each dendritic tree are shown in (d) (many more events were also identified, see Supplemental Figure S7 and supplemental movie M3). (e) shows maps of onset and decay dynamics within a single dendritic tree, calculated as F(t) = F(t0)e t/τ. Plots in (f) show time-courses extracted from regions indicated by colored arrowheads in (e). Branches 2 and 3 (b2, b3) show very similar dynamics, while points along branch 1 (b1) exhibit very different onset and decay dynamics in both sequential firing events.
Figure 4
Figure 4. SCAPE of freely moving mhc-Gal4,UAS-CD8:GFP 1st instar Drosophila melanogaster larvae
(a) shows the en-face imaging geometry employed, in which the larva was able to freely crawl and move within the field of view. (b) Shows a large field of view SCAPE image of the entire larva. White square indicates location of zoomed images shown in (c), where different depth sections and sequential images acquired at 20 VPS reveal the dynamics of a single heartbeat (linear grayscale). (d) shows a volume rendering of a section of these data, while (e) shows a kymograph of 2 micron thick section of the y’ plane indicated in (d), capturing both a peristaltic wave as the animal moves, and the rhythmic beating of its heart tube. Orange line shows the time of the volume shown in (d). Supplemental movies M4 and M5 show these data as a full 4D dynamic volume.
Figure 5
Figure 5. SCAPE microscopy of cellular structure-function and 3D cell tracking in freely moving Drosophila larvae
a) SCAPE volume renderings of a 3rd instar mhc-Gal4, UASGCaMP6f, UAS-CD8:mCherry Drosophila larva expressing both calcium sensitive GCaMP (green) and a structural mCherry (red) marker in smooth muscle. The (non-sequential) image sequence, acquired at 10 VPS, shows pulses of GCaMP6f fluorescence corresponding to muscle contractions. (b) GCaMP dynamics extracted from a slower moving larva. (c) High resolution SCAPE rendering showing sub-cellular resolution in an ex-vivo 1st instar NompC-QF, QUAS-tdTomato; ppk-Gal4, UAS-mCD8::GFP larva expressing GFP and tdTomato in class III sensory + chordotonal neurons, and class IV sensory neurons, respectively. (d) In-vivo SCAPE volume sequence (nonsequential) of same during free motion. (e) The output of a 4D motion tracking algorithm showing the 3D location of specific neurons (circles in (d)) over time, permitting extraction of dynamic intensity signals during free movement. See also supplemental movies M6-M8.

References

    1. Akerboom J, et al. Optimization of a GCaMP calcium indicator for neural activity imaging. J Neurosci. 2012;32:13819–13840. - PMC - PubMed
    1. Chen T-W, et al. Ultrasensitive fluorescent proteins for imaging neuronal activity. Nature. 2013;499:295–300. - PMC - PubMed
    1. Dodt H-U, et al. Ultramicroscopy: three-dimensional visualization of neuronal networks in the whole mouse brain. Nature Methods. 2007;4:331–336. - PubMed
    1. Verveer PJ, et al. High-resolution three-dimensional imaging of large specimens with light sheet-based microscopy. Nat Methods. 2007;4:311–313. - PubMed
    1. Keller PJ, et al. Fast, high-contrast imaging of animal development with scanned light sheet-based structured-illumination microscopy. Nat Meth. 2010;7:637–642. - PMC - PubMed