

Exploratory Analysis in Time-Varying Data Sets: a Healthcare Network Application
- PMID: 25664281
- PMCID: PMC4319218
Exploratory Analysis in Time-Varying Data Sets: a Healthcare Network Application
Abstract
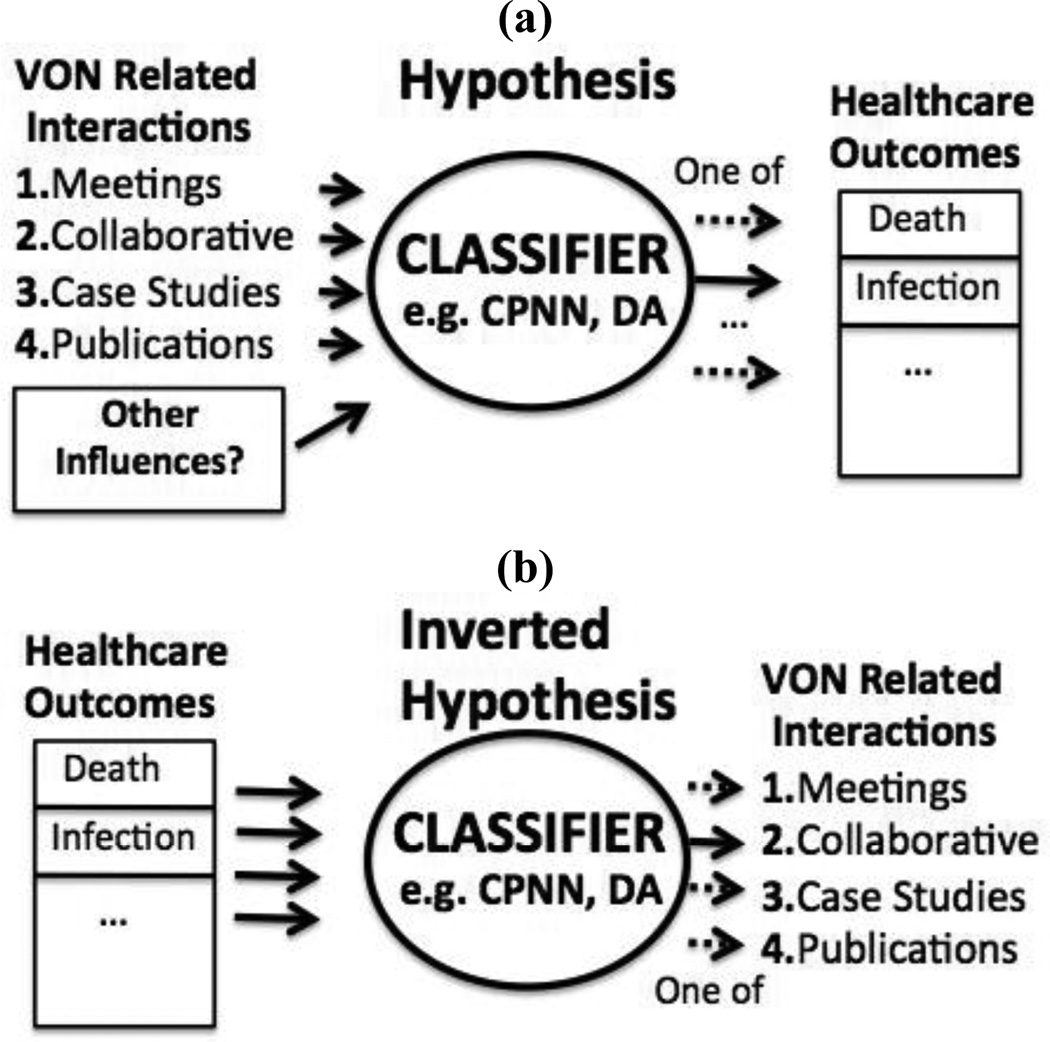
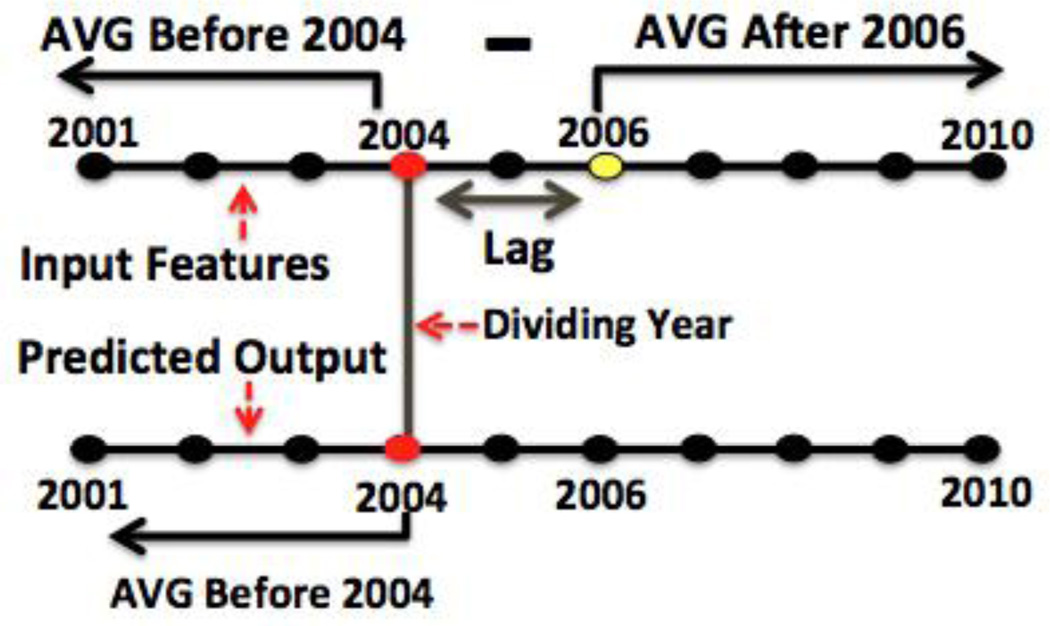
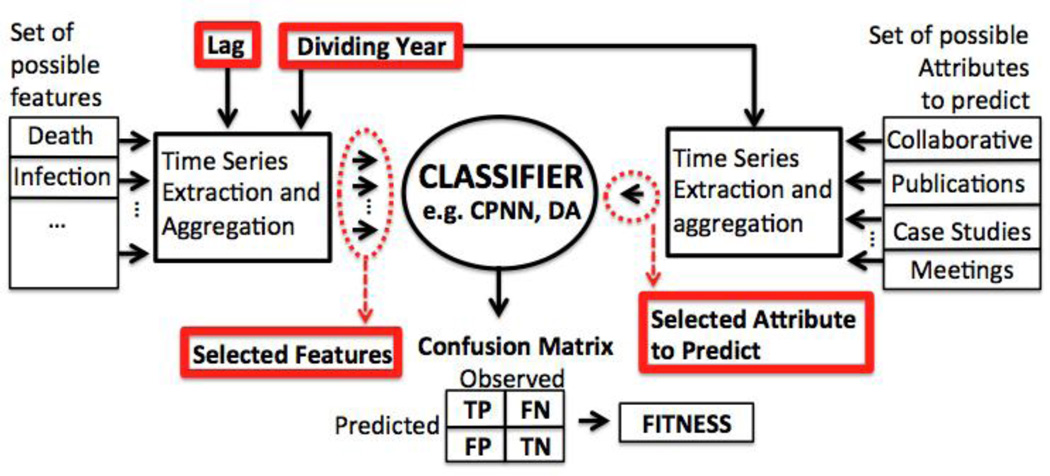
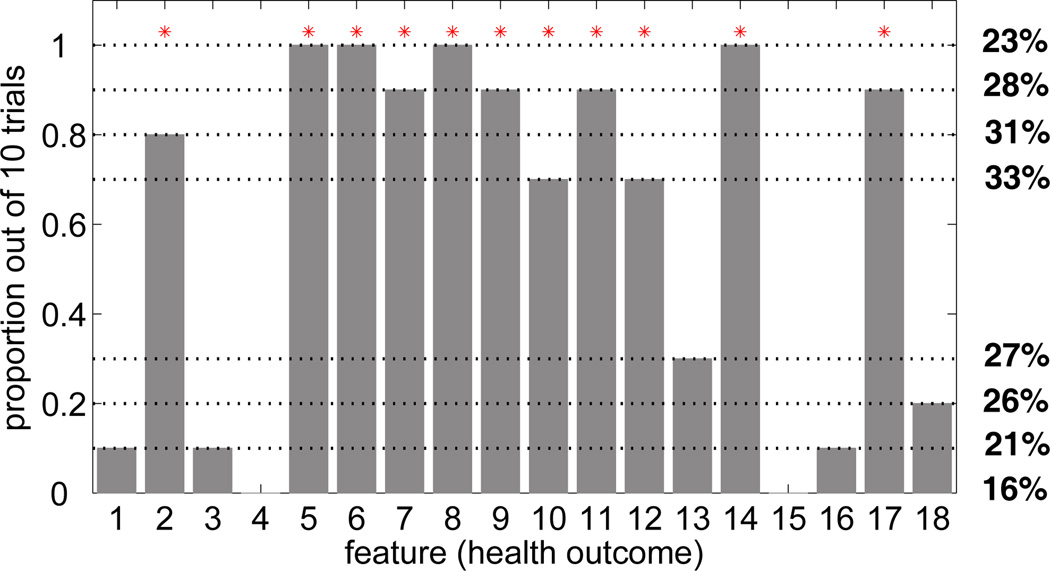
We introduce a new method for exploratory analysis of large data sets with time-varying features, where the aim is to automatically discover novel relationships between features (over some time period) that are predictive of any of a number of time-varying outcomes (over some other time period). Using a genetic algorithm, we co-evolve (i) a subset of predictive features, (ii) which attribute will be predicted (iii) the time period over which to assess the predictive features, and (iv) the time period over which to assess the predicted attribute. After validating the method on 15 synthetic test problems, we used the approach for exploratory analysis of a large healthcare network data set. We discovered a strong association, with 100% sensitivity, between hospital participation in multi-institutional quality improvement collaboratives during or before 2002, and changes in the risk-adjusted rates of mortality and morbidity observed after a 1-2 year lag. The proposed approach is a potentially powerful and general tool for exploratory analysis of a wide range of time-series data sets.
Keywords: Artificial intelligence; genetic algorithm; knowledge discovery; pattern recognition.
Figures
References
-
- Banks A. Cross-national time-series data archive 1815–2007. Jerusalem, Israel: Databanks International; 2008.
-
- Bernstein I, Horbar J, Badger G, Ohlsson A, Golan A, et al. Morbidity and mortality among very-low-birth-weight neonates with intrauterine growth restriction. American journal of obstetrics and gynecology. 2000;182(1):198–206. - PubMed
-
- DeHaas D, Craig J, Rickert C, Haake P, Stor K, Eppstein M. Feature selection and classification in noisy epistatic problems using a hybrid evolutionary approach. poster and published extended abstract accepted for Genetic and Evolutionary Computation Conference (GECCO) 2007
-
- Fayyad U, Piatetsky-Shapiro G, Smyth P. From data mining to knowledge discovery in databases. AI magazine. 1996;17(3):37.
-
- Hecht-Nielsen R. Counterpropagation networks. Applied optics. 1987;26(23):4979–4983. - PubMed
Grants and funding
LinkOut - more resources
Full Text Sources