. 2015:2015:376474.
doi: 10.1155/2015/376474. Epub 2015 Jan 15.

Strain amplification analysis of an osteocyte under static and cyclic loading: a finite element study

Affiliations

Strain amplification analysis of an osteocyte under static and cyclic loading: a finite element study

Liping Wang et al. Biomed Res Int. 2015.

Abstract

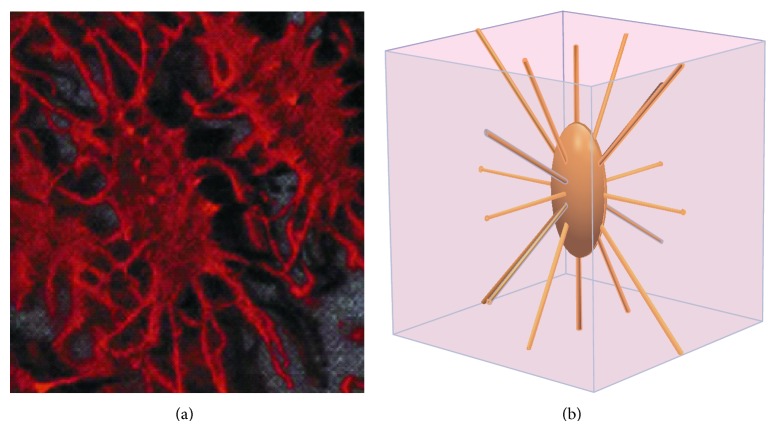
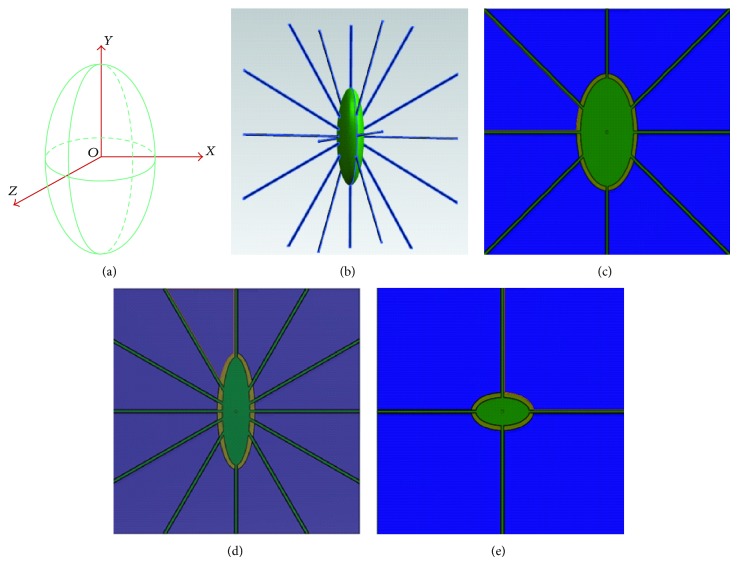
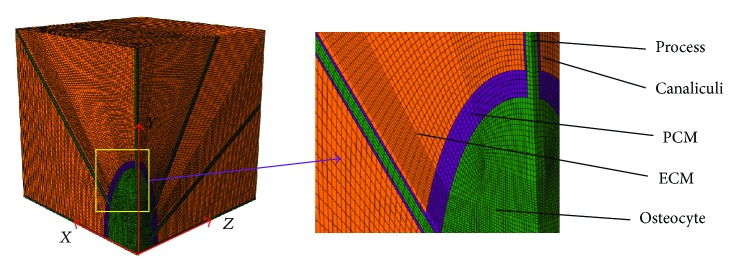
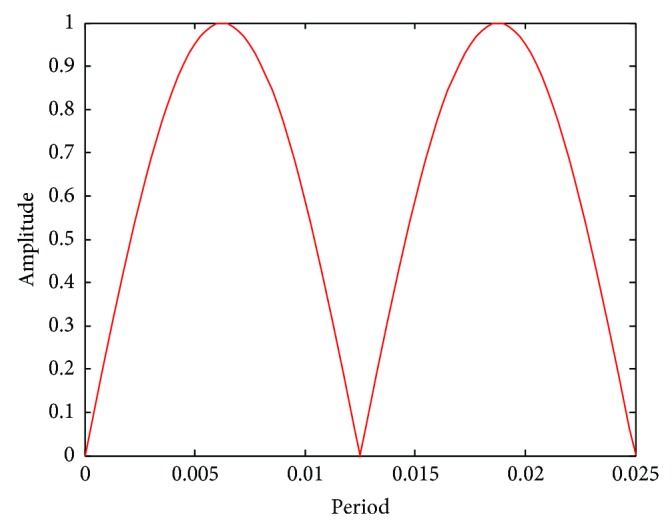
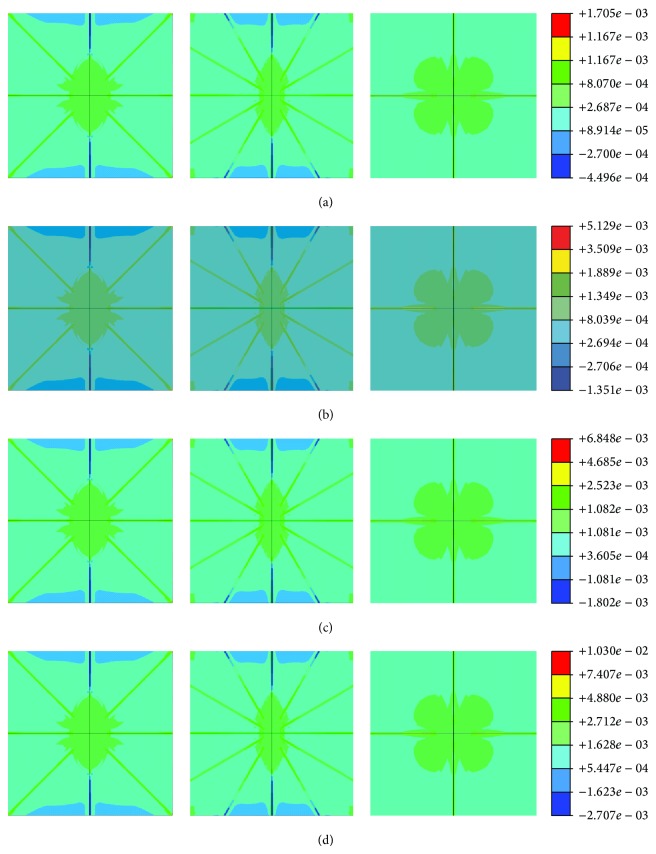
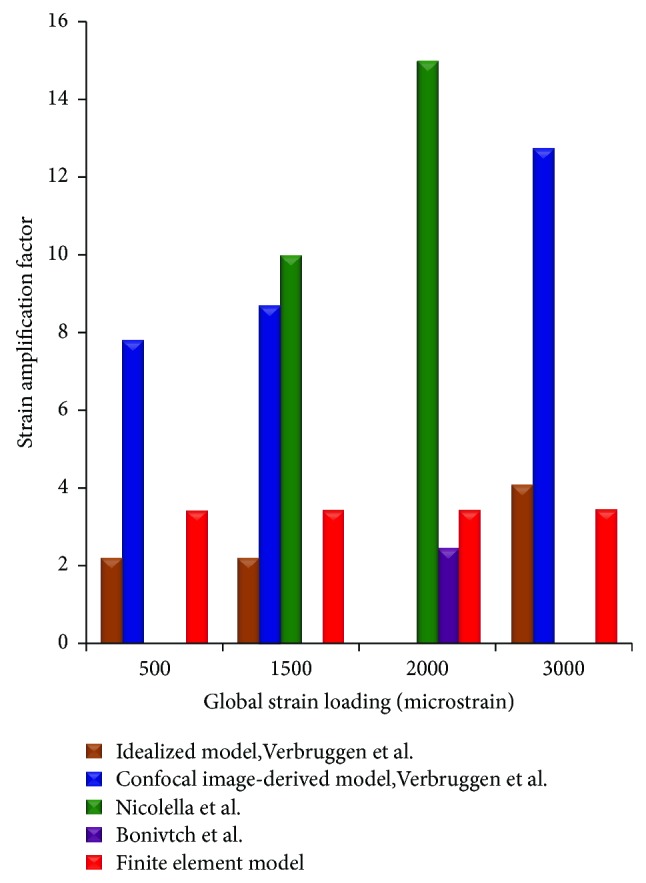
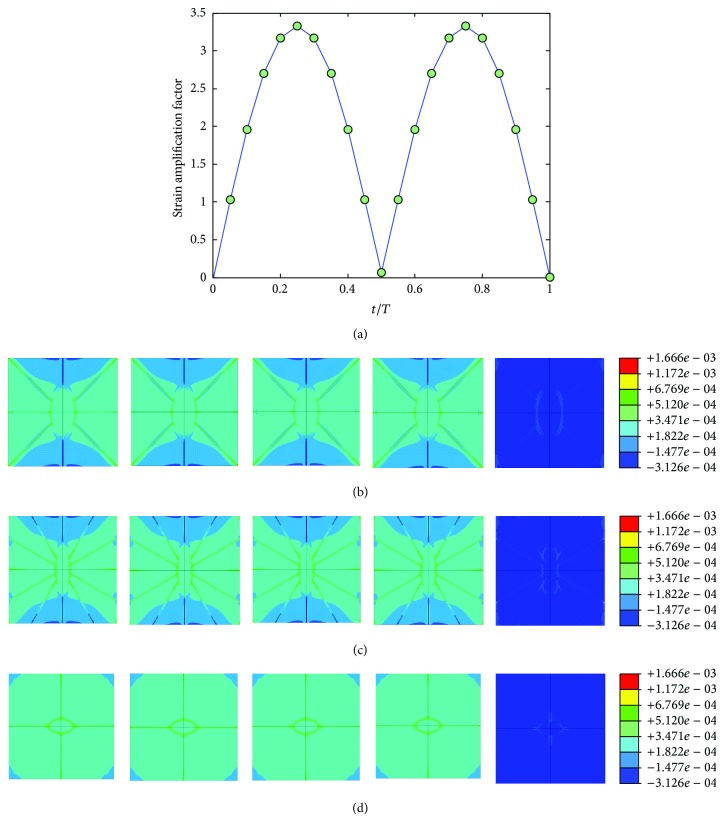
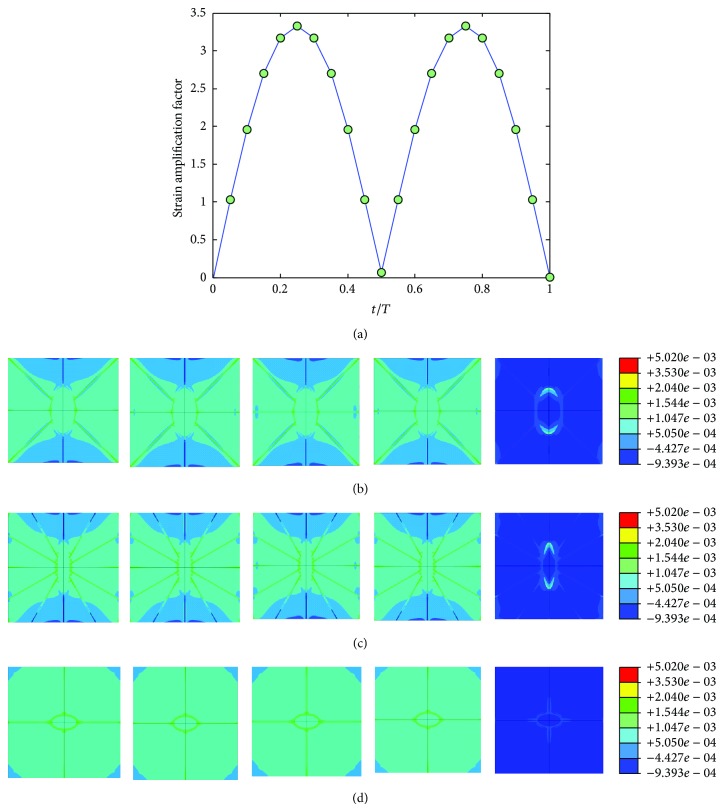
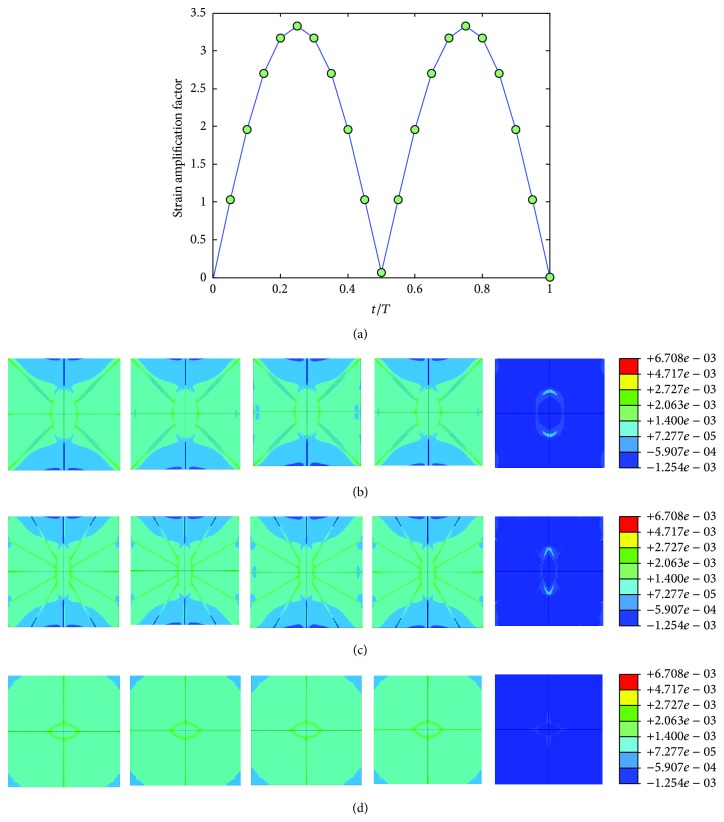
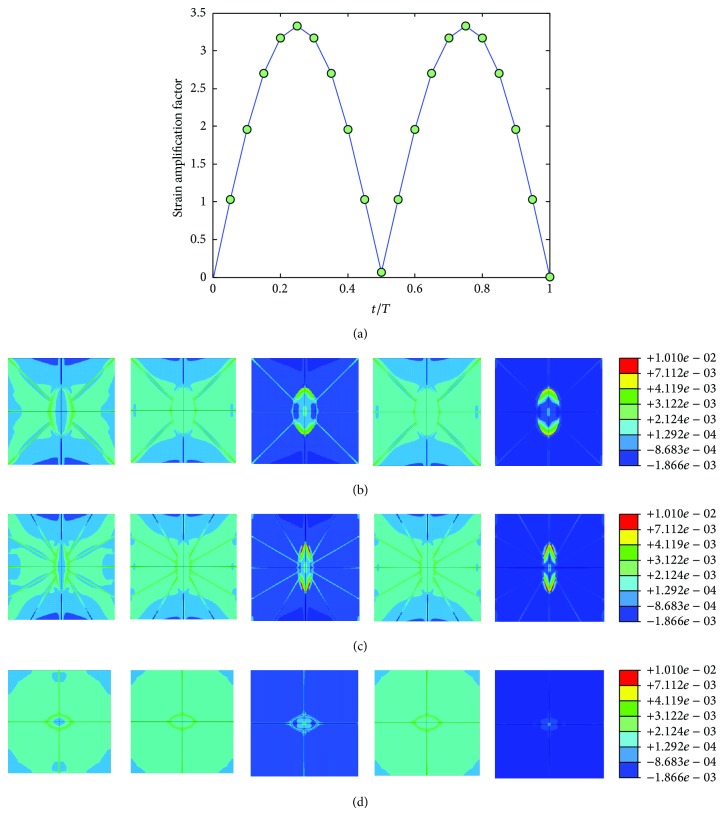
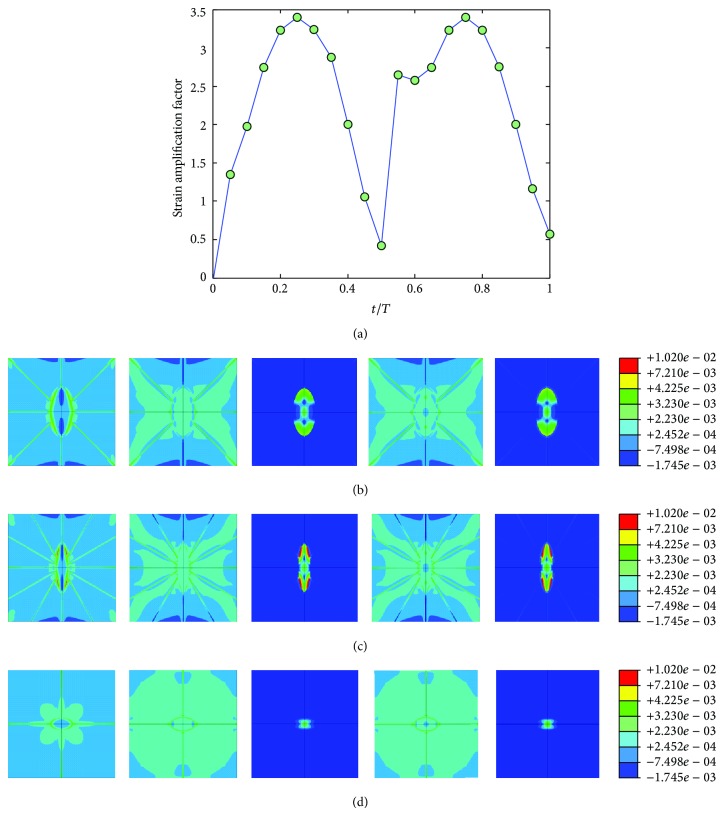
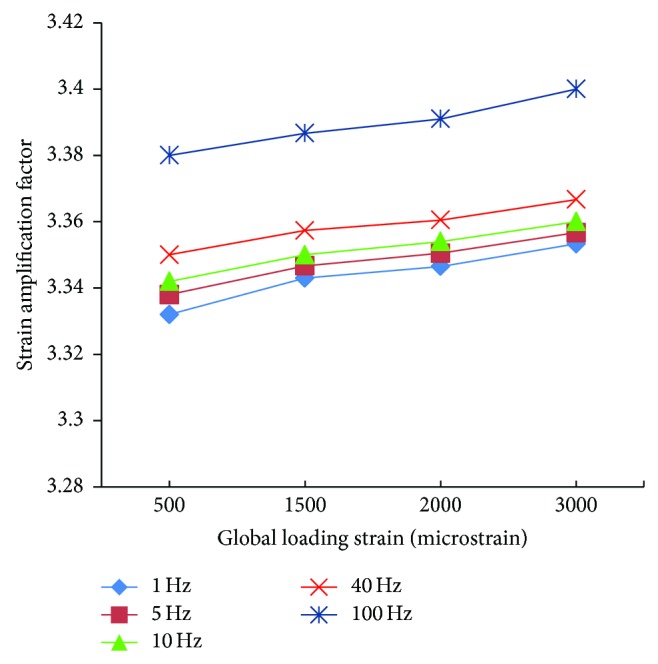
Osteocytes, the major type of bone cells which reside in their lacunar and canalicular system within the bone matrix, function as biomechanosensors and biomechanotransducers of the bone. Although biomechanical behaviour of the osteocyte-lacunar-canalicular system has been investigated in previous studies mostly using computational 2-dimensional (2D) geometric models, only a few studies have used the 3-dimensional (3D) finite element (FE) model. In the current study, a 3D FE model was used to predict the responses of strain distributions of osteocyte-lacunar-canalicular system analyzed under static and cyclic loads. The strain amplification factor was calculated for all simulations. Effects on the strain of the osteocyte system were investigated under 500, 1500, 2000, and 3000 microstrain loading magnitudes and 1, 5, 10, 40, and 100 Hz loading frequencies. The maximum strain was found to change with loading magnitude and frequency. It was observed that maximum strain under 3000-microstrain loading was higher than those under 500, 1500, and 2000 microstrains. When the loading strain reached the maximum magnitude, the strain amplification factor of 100 Hz was higher than those of the other frequencies. Data from this 3D FE model study suggests that the strain amplification factor of the osteocyte-lacunar-canalicular system increases with loading frequency and loading strain increasing.


Figures

Figure 1
Figure 1
The osteocyte-lacunar-canalicular system. (a) Photomicrograph of osteocytes embedded in bone matrix (adopted from [34]); (b) schematic geometry of cubic volume of bone surrounding one osteocyte lacuna with canaliculi and processes.
Figure 2
Figure 2
(a) The schematic diagram of an osteocyte lacuna, where Z is the intermediate axis, Y the major axis, and X the minor axis of the lacuna in the local coordinate system. Osteocyte lacuna and canaliculi are shown schematically: (b) osteocyte cell body (green) with processes (blue), (c) X-Y plane, (d) Z-Y plane, and (e) X-Z plane.
Figure 3
Figure 3
One-eighth symmetry FE mesh model includes ECM, PCM with canaliculi, and osteocyte cell body with processes.
Figure 4
Figure 4
Effects of load cycle on the model.
Figure 5
Figure 5
Strain distribution of half FE model in X-Y plane (left), Y-Z plane (middle), and X-Z plane (right), respectively, under different global loading, (a) 500-microstrain global loading, (b) 1500-microstrain global loading, (c) 2000-microstrain global loading, and (d) 3000-microstrain global loading.
Figure 6
Figure 6
The strain amplification factor of FE mesh model compared with reference data from the literature.
Figure 7
Figure 7
Strain amplification factors and strain distribution by application of a sinusoidal global strain load of 500 microstrains at the frequency of 1 Hz, (a) strain amplification factors versus one loading period, (b) when t = 0.1T, 0.25T, 0.5T, 0.75T, and 1T, strain distribution in X-Y plane, (c) when t = 0.1T, 0.25T, 0.5T, 0.75T, and 1T, strain distribution in Y-Z plane, and (d) when t = 0.1T, 0.25T, 0.5T, 0.75T, and 1T, strain distribution in X-Z plane.
Figure 8
Figure 8
Strain amplification factors and strain distribution by application of a sinusoidal global strain load of 1500 microstrains at the frequency of 5 Hz, (a) strain amplification factors versus one loading period, (b) when t = 0.1T, 0.25T, 0.5T, 0.75T, and 1T, strain distribution in X-Y plane, (c) when t = 0.1T, 0.25T, 0.5T, 0.75T, and 1T, strain distribution in Y-Z plane, and (d) when t = 0.1T, 0.25T, 0.5T, 0.75T, and 1T, strain distribution in X-Z plane.
Figure 9
Figure 9
Strain amplification factors and strain distribution by application of a sinusoidal global strain load of 2000 microstrains at the frequency of 10 Hz, (a) strain amplification factors versus one loading period, (b) when t = 0.1T, 0.25T, 0.5T, 0.75T, and 1T, strain distribution in X-Y plane, (c) when t = 0.1T, 0.25T, 0.5T, 0.75T, and 1T, strain distribution in Y-Z plane, and (d) when t = 0.1T, 0.25T, 0.5T, 0.75T, and 1T, strain distribution in X-Z plane.
Figure 10
Figure 10
Strain amplification factors and strain distribution by application of a sinusoidal global strain load of 3000 microstrains at the frequency of 40 Hz, (a) strain amplification factors versus one loading period, (b) when t = 0.1T, 0.25T, 0.5T, 0.75T, and 1T, strain distribution in X-Y plane, (c) when t = 0.1T, 0.25T, 0.5T, 0.75T, and 1T, strain distribution in Y-Z plane, and (d) when t = 0.1T, 0.25T, 0.5T, 0.75T, and 1T, strain distribution in X-Z plane.
Figure 11
Figure 11
Strain amplification factors and strain distribution by application of a sinusoidal global strain load of 3000 microstrains at the frequency of 100 Hz, (a) strain amplification factors versus one loading period, (b) when t = 0.1T, 0.25T, 0.5T, 0.75T, and 1T, strain distribution in X-Y plane, (c) when t = 0.1T, 0.25T, 0.5T, 0.75T, and 1T, strain distribution in Y-Z plane, and (d) when t = 0.1T, 0.25T, 0.5T, 0.75T, and 1T, strain distribution in X-Z plane.
Figure 12
Figure 12
Comparison of strain amplification factors at different frequencies and loading strains all at t = 0.5T.

Similar articles

Cited by

References

    1. Bonewald L. F. The amazing osteocyte. Journal of Bone and Mineral Research. 2011;26(2):229–238. doi: 10.1002/jbmr.320. - DOI - PMC - PubMed
    1. Franz-Odendaal T. A., Hall B. K., Witten P. E. Buried alive: how osteoblasts become osteocytes. Developmental Dynamics. 2006;235(1):176–190. doi: 10.1002/dvdy.20603. - DOI - PubMed
    1. Knothe Tate M. L., Adamson J. R., Tami A. E., Bauer T. W. The osteocyte. International Journal of Biochemistry and Cell Biology. 2004;36(1):1–8. doi: 10.1016/S1357-2725(03)00241-3. - DOI - PubMed
    1. You L.-D., Weinbaum S., Cowin S. C., Schaffler M. B. Ultrastructure of the osteocyte process and its pericellular matrix. Anatomical Record Part A: Discoveries in Molecular, Cellular, and Evolutionary Biology. 2004;278(2):505–513. - PubMed
    1. Zhang K., Barragan-Adjemian C., Ye L., et al. E11/gp38 selective expression in osteocytes: regulation by mechanical strain and role in dendrite elongation. Molecular and Cellular Biology. 2006;26(12):4539–4552. doi: 10.1128/MCB.02120-05. - DOI - PMC - PubMed

Publication types

LinkOut - more resources