. 2015 Mar;14(3):343-51.
doi: 10.1038/nmat4206. Epub 2015 Feb 9.

Hydraulic fracture during epithelial stretching

Affiliations

Hydraulic fracture during epithelial stretching

Laura Casares et al. Nat Mater. 2015 Mar.

Abstract

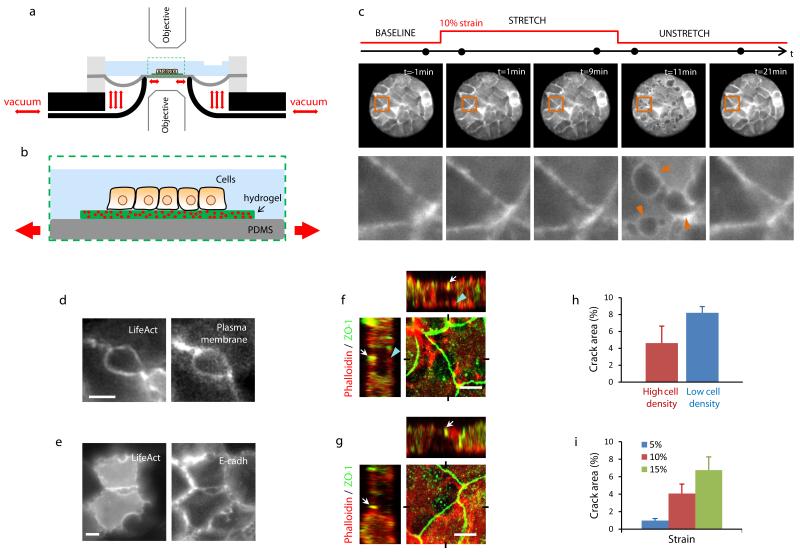
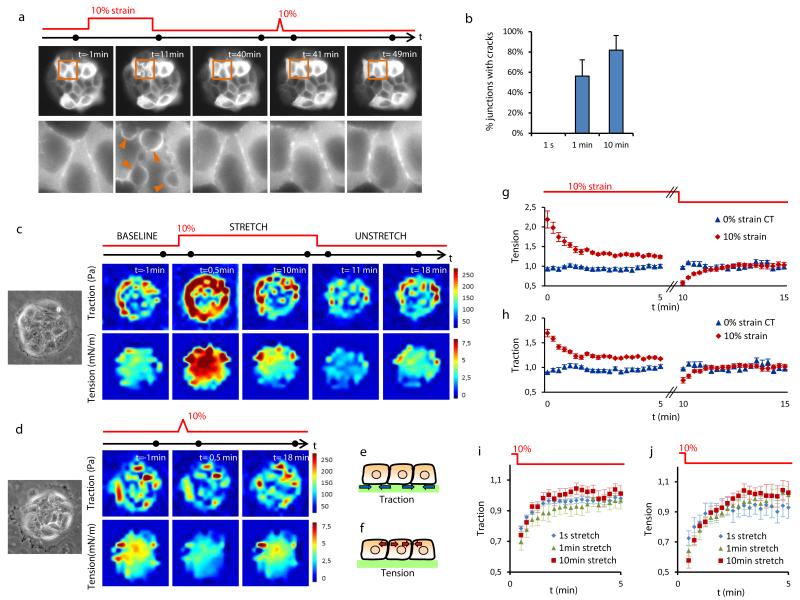
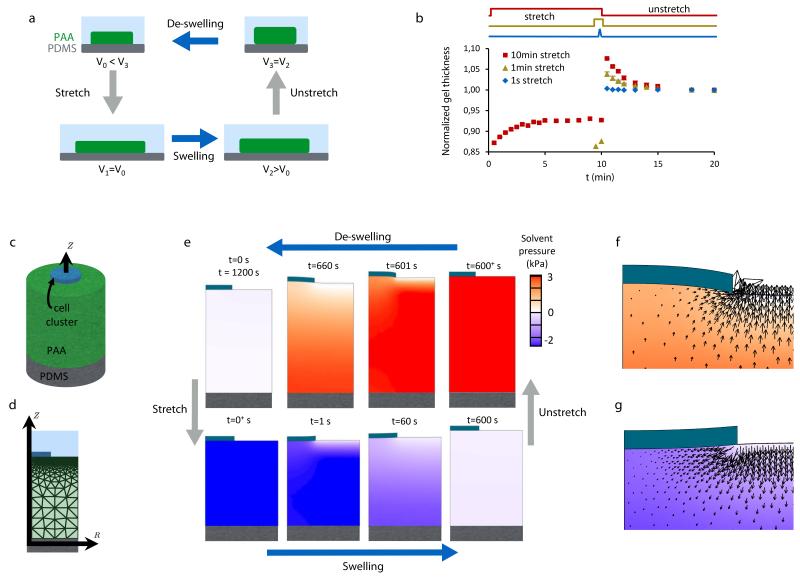
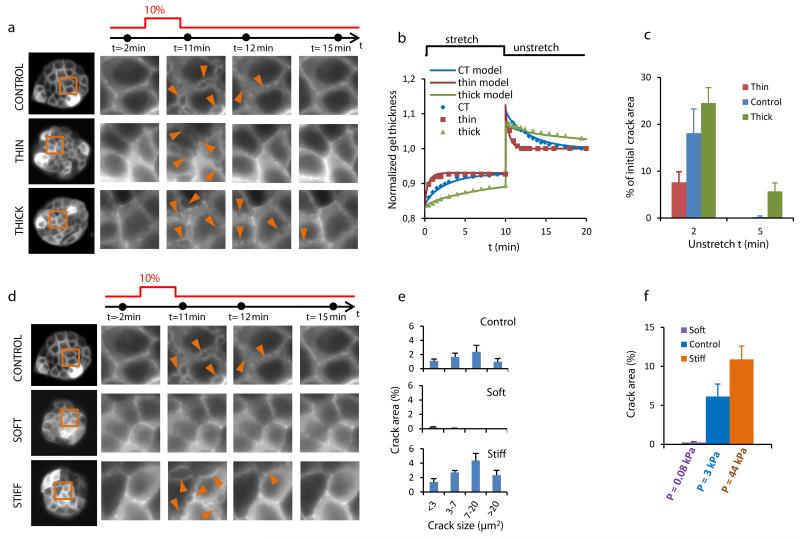
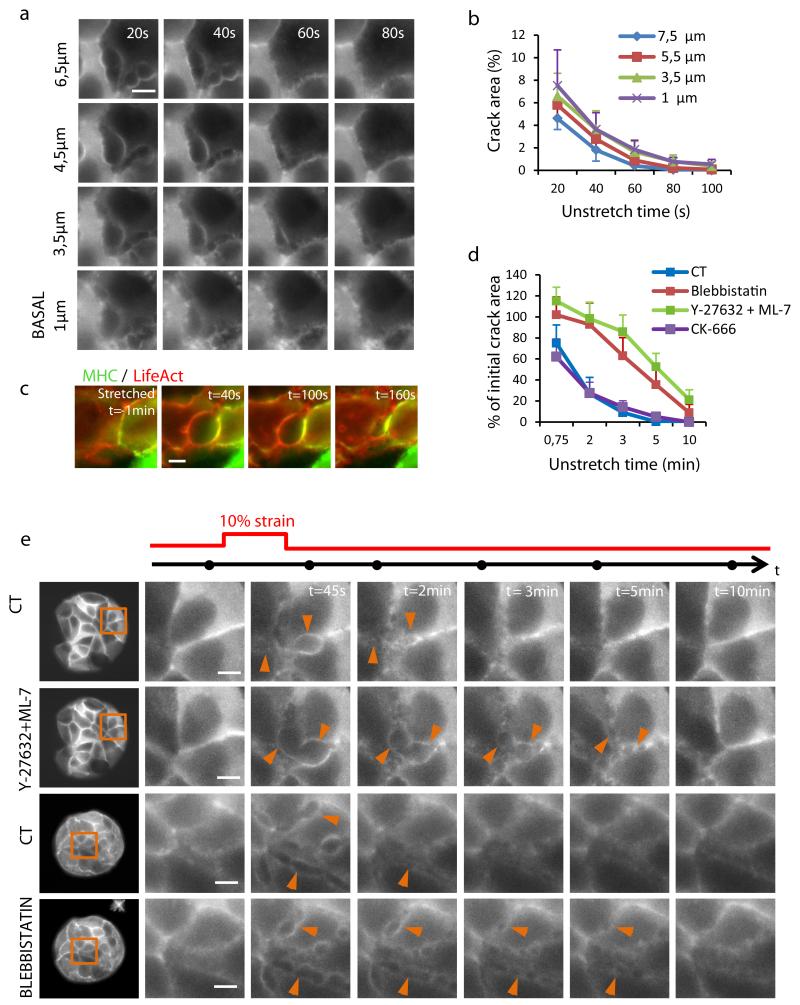
The origin of fracture in epithelial cell sheets subject to stretch is commonly attributed to excess tension in the cells' cytoskeleton, in the plasma membrane, or in cell-cell contacts. Here, we demonstrate that for a variety of synthetic and physiological hydrogel substrates the formation of epithelial cracks is caused by tissue stretching independently of epithelial tension. We show that the origin of the cracks is hydraulic; they result from a transient pressure build-up in the substrate during stretch and compression manoeuvres. After pressure equilibration, cracks heal readily through actomyosin-dependent mechanisms. The observed phenomenology is captured by the theory of poroelasticity, which predicts the size and healing dynamics of epithelial cracks as a function of the stiffness, geometry and composition of the hydrogel substrate. Our findings demonstrate that epithelial integrity is determined in a tension-independent manner by the coupling between tissue stretching and matrix hydraulics.


Figures

Figure 1
Figure 1. Epithelial fracture during stretch/unstretch maneuvers
a, Scheme of the stretching device (see Methods and Supplementary Fig. 1). b, Zoomed view of the region enclosed by a dashed rectangle in (a). c, LifeAct-GFP MDCK cluster before, during and after a 10 min pulse of 10% biaxial strain. The bottom row is a zoom of the region highlighted in the upper row. Arrowheads point at cracks after stretch cessation. The acquisition time of each snap shot is marked by a black dot on the time axis (top). d, Live fluorescence images of MDCK cells expressing LifeAct-Ruby (left) and a fluorescently-labeled plasma membrane green marker (right). Images were obtained 30 s after stretch cessation. Scale bar, 5μm. e, Live fluorescence images of MDCK cells expressing LifeAct-GFP (left) and E-cad-RFP (right). Images were obtained 30 s after stretch cessation. Scale bar, 5μm. f-g, Confocal x-y, x-z and y-z sections of cracks. Cells were fixed immediately after stretch cessation and stained for F-actin (phalloidin, red) and ZO-1 (green) (Supplementary methods). Sections show that ZO-1 remained intact at the apical surface (white arrows). In (f), a discontinuous actin layer was present at the basal surface of the cluster (blue arrowheads) and the largest crack diameter was located in the medial plane. In (g), no basal actin layer was present and the largest crack diameter was located in the basal plane. See Supplementary Fig. 6 for confocal sections of additional cracks (Scale bar, 5 μm). h, Crack area in epithelial clusters at high density (37±3 cells/pattern, mean±SEM, n=5) and low density (19±1 cells/pattern, mean±SEM, n=5). Representative images of the clusters before and after stretch are shown in Supplementary Fig. 9. i, Dependence of crack area with strain (n=6). In (h) and (i), crack area was expressed as a percentage of the total pattern area. Epithelial clusters are 80 μm in diameter.
Figure 2
Figure 2. Cracks are independent of epithelial tension
a, Time-lapse imaging of patterned clusters (top) and zoomed regions (bottom) of MDCK cells expressing LifeAct-GFP before and after application of successive pulses of 10 min and 1s duration. Arrowheads point at cracks. The acquisition time of each snap shot is marked by a black dot on the time axis. b, Percentage of junctions with cracks after stretch pulses of 1 s, 1 min or 10 min duration. Stretch pulses were applied consecutively to each pattern, in a random order and spaced by >15 min (n=6 different patterns). c,d, Colour maps showing traction forces (top) and epithelial tension (bottom) before, during and after a 10 min (c) or 1 s (d) stretch pulses. Phase contrast images on the left show the measured MDCK cell cluster. e,f, Schemes illustrating the physical meaning of traction and tension in the epithelial clusters. g,h, Traction forces and tension during and after a 10 min duration and 10% strain pulse versus a 0% strain (both normalized to baseline levels). i,j, Traction forces and tension after stretch pulses of different duration normalized to baseline levels. Error bars in g-j show SEM of n=6 clusters per condition. Epithelial clusters are 80 μm in diameter.
Figure 3
Figure 3. Stretch induces poroelastic flows and pressure beneath the cell cluster
a, Illustration of the coupling between hydrogel stretching and swelling. Immediately after a rapid stretch or unstretch maneuver, the hydrogel volume is conserved. With time, the free energy balance in the hydrogel causes poroelastic flows that lead to progressive swelling or de-swelling of the hydrogel. b, Time evolution of PAA hydrogel thickness during and after stretch pulses of 1 s, 1 min, and 10 min (normalized to baseline levels). Stretch pulses were applied successively to each pattern, in a random order and spaced by >15 min (n=4 different patterns, error bars are SEM). c, Idealization of the gel underneath an epithelial cluster as a cylindrical region covered by a disc-like impermeable barrier (modeled epithelial clusters are 80 μm in diameter and the gel is 156 μm in thickness). This gel domain is modeled with the large deformation poroelastic theory (Supplementary Note 1). d, Axisymmetric finite element discretization of the system shown in (c). e, Solvent pressure and deformation of the gel during the stretch-unstretch maneuver in the presence of an impermeable disc-like barrier as predicted by the model. f, Solvent flow pattern near the edge of the epithelial cluster 6 s after stretch cessation. g, Solvent flow pattern near the edge of the epithelial cluster 6 s after stretch application.
Figure 4
Figure 4. The origin of cracks is hydraulic
a, (left) Clusters of MDCK cells expressing LifeAct-GFP on PAA hydrogels of different thickness. (right) Time-lapse evolution of the regions highlighted in orange on left panels before and after a 10 min pulse of 10% biaxial stretch. The acquisition time of each snap shot is marked by a black dot on the time axis (top). Arrowheads point to a subset of cracks. b, Time evolution of the thickness of three PAA hydrogels of same stiffness (12 kPa) but different initial thickness (CT=168 μm, thin=54 μm, thick=358 μm) during and after application of a 10 min stretch pulse. Solid lines are fits of the poroelastic model described in Supplementary Note 1. c, Percentage of the initial crack area that remains open 2 and 5 min after unstretching hydrogels of different thickness (n=4 per condition, CT=156.3± 9.8 μm, thin=59.3±3.8 μm, thick=345.0±15.3 μm, mean±SEM). d, (left) Clusters of MDCK expressing LifeAct-GFP on PAA hydrogels of same initial thickness but different stiffness (0.2, 12, 200kPa). (right) Time-lapse evolution of the regions highlighted on left panels before and after a 10 min 10% biaxial stretch. e, Distribution of crack size 45 s after unstretch in clusters attached to hydrogels of different stiffness (0.2kPa, 12kPa and 200kPa). f, Percentage of crack area 45s after stretch cessation in clusters attached to substrates of different stiffness. Values on the x-axis are hydraulic pressures at the cell-gel interface estimated from the poroelastic theory (Supplementary Note 1). Error bars show SEM. Epithelial clusters are 80 μm in diameter.
Figure 5
Figure 5. Cracks seal from apical to basal plane in a myosin dependent fashion
a, Live fluorescence images of MDCK cells expressing LifeAct-GFP showing the time evolution of cracks after stretch at different z-planes. Arrowheads point at one representative crack. b, Crack area expressed as a percentage of pattern area at different z-planes and times after stretch cessation (height increases from basal to apical). c, Live imaging of cells expressing LifeAct-Ruby and MHC-GFP during stretch and at different times during crack sealing. d, Time evolution of crack area expressed as a percentage of crack area in untreated controls immediately after stretch cessation. Error bars show SEM of n=4 clusters per condition. e, (left) Clusters of MDCK cells expressing LifeAct-GFP or LifeAct-Ruby before (CT) and after 30 min incubation with 30 μM Y-27632 and 60 μM ML-7 or 80 μM Blebbistatin. (right) Magnified views of regions highlighted on left panels before and after a 10 min 10% biaxial stretch. Note that the same cluster was used successively for control and treatment. Arrowheads point at representative cracks. The acquisition time of each snap shot is marked by a black dot on the time axis (top). Scale bar, 5μm. Epithelial clusters are 80 μm in diameter.

Comment in

  • Cell mechanics: Hydraulic cracking.
    Moeendarbary E, Charras G. Moeendarbary E, et al. Nat Mater. 2015 Mar;14(3):268-9. doi: 10.1038/nmat4229. Nat Mater. 2015. PMID: 25698432 No abstract available.

References

    1. Alberts B. Molecular Biology of the cell. 2002 Garland Science.
    1. Fung YC. Biomechanics: mechanical properties of living tissues. 1993
    1. Guillot C, Lecuit T. Mechanics of epithelial tissue homeostasis and morphogenesis. Science. 2013;340:1185–1189. - PubMed
    1. Bosveld F, et al. Mechanical control of morphogenesis by Fat/Dachsous/Four-jointed planar cell polarity pathway. Science. 2012;336:724–727. - PubMed
    1. He B, Doubrovinski K, Polyakov O, Wieschaus E. Apical constriction drives tissue-scale hydrodynamic flow to mediate cell elongation. Nature. 2014;508:392–396. - PMC - PubMed

Publication types