. 2015 Feb 9;10(2):e0117222.
doi: 10.1371/journal.pone.0117222. eCollection 2015.

Puffing topography and nicotine intake of electronic cigarette users

Affiliations

Puffing topography and nicotine intake of electronic cigarette users

Rachel Z Behar et al. PLoS One. .

Abstract

Background: Prior electronic cigarette (EC) topography data are based on two video analyses with limited parameters. Alternate methods for measuring topography are needed to understand EC use and nicotine intake.

Objectives: This study evaluated EC topography with a CReSS Pocket device and quantified nicotine intake.

Methods: Validation tests on pressure drop, flow rate, and volume confirmed reliable performance of the CReSS Pocket device. Twenty participants used Blu Cigs and V2 Cigs for 10 minute intervals with a 10-15 minute break between brands. Brand order was reversed and repeated within 7 days Data were analyzed to determine puff duration, puff count, volume, flow rate, peak flow, and inter-puff interval. Nicotine intake was estimated from cartomizer fluid consumption and topography data.

Results: Nine patterns of EC use were identified. The average puff count and inter-puff interval were 32 puffs and 17.9 seconds. All participants, except one, took more than 20 puffs/10 minutes. The averages for puff duration (2.65 seconds/puff), volume/puff (51 ml/puff), total puff volume (1,579 ml), EC fluid consumption (79.6 mg), flow rate (20 ml/s), and peak flow rate (27 ml/s) were determined for 10-minute sessions. All parameters except total puff count were significantly different for Blu versus V2 EC. Total volume for Blu versus V2 was four-times higher than for conventional cigarettes. Average nicotine intake for Blu and V2 across both sessions was 1.2 ± 0.5 mg and 1.4 ± 0.7 mg, respectively, which is similar to conventional smokers.

Conclusions: EC puffing topography was variable among participants in the study, but often similar within an individual between brands or days. Puff duration, inter-puff interval, and puff volume varied from conventional cigarette standards. Data on total puff volume and nicotine intake are consistent with compensatory usage of EC. These data can contribute to the development of a standard protocol for laboratory testing of EC products.


Conflict of interest statement

Competing Interests: The authors have declared that no competing interests exist.

Figures

Figure 1
Figure 1. CReSS Pocket Validation Tests.
(A) Pressure drop validation tests for each brand with and without the CReSS Pocket connected to the smoking machine (n = 4). (B) Flow rate validation tests for each brand connected to the CReSS Pocket puffed at three different flow rates using a smoking machine (n = 3). (C) Volume/puff validation tests for each brand performed by manually pulling a 60 ml syringe to approximately 40 ml (n = 3). For all validation tests, values are the means ± SD. In Fig. 1A, SD are small and do not show well.
Figure 2
Figure 2. Frequency distribution of puff count for all users.
Frequency distribution of total puff counts for all users broken down into different puff number intervals (N = 20).
Figure 3
Figure 3. Total volumes for all user sessions.
Total volume for each session of Blu and V2 on Day 1 and 2 for all users (N = 20).
Figure 4
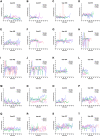
Figure 4. Nine topography patterns of EC use were detected for puff count vs puff duration.
(A-C) are users who had consistently low puff durations. (D, E) are users with midrange puff durations. (F, G) are users with high puff durations. (H-J) are users with erratic puff durations across all sessions. (K, L) are users who consistently had fewer total puffs. (M, N) are users with consistently higher total puff counts. (O, P) are users who varied puff counts across all sessions. (Q-S) are users who had different puff counts on Day 1 and Day 2. (T) is a user who puffed Blu more times than V2.
Figure 5
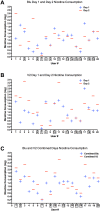
Figure 5. Nicotine intake for all users.
(A) Nicotine intake for all users for Blu on Day 1 and Day 2. (B) Nicotine intake for all users for V2 on Day 1 and Day 2. (C) Nicotine intake for all users with Blu Days 1 and 2 combined and V2 Days 1 and 2 combined. Black boxes around user numbers indicate a nicotine intake difference that was ≤ 0.2mg, which was considered to be similar nicotine intake from day to day or brand to brand.

References

    1. Ayers JW, Ribisl KM, Brownstein JS (2011) Tracking the rise in popularity of electronic nicotine delivery systems (electronic cigarettes) using search query surveillance. Am J Prev Med 40: 448–453. 10.1016/j.amepre.2010.12.007 - DOI - PubMed
    1. Chen IL, Husten CG (2014) Introduction to tobacco control supplement. Tob Control 23 Suppl 2: ii1–3. 10.1136/tobaccocontrol-2013-051504 - DOI - PMC - PubMed
    1. Trtchounian A, Talbot P (2011) Electronic nicotine delivery systems: is there a need for regulation? Tob Control 20: 47–52. 10.1136/tc.2010.037259 - DOI - PubMed
    1. Trtchounian A, Williams M, Talbot P (2010) Conventional and electronic cigarettes (e-cigarettes) have different smoking characteristics. Nicotine Tob Res 12: 905–912. 10.1093/ntr/ntq114 - DOI - PubMed
    1. Williams M, Ghai S, Talbot P (2014) Disposable electronic cigarettes and electronic hookahs: evaluation of performance. Nicotine Tob Res. 10.1093/ntr/ntu118 - DOI - PMC - PubMed

Publication types