. 2015 Mar;33(3):269-276.
doi: 10.1038/nbt.3154. Epub 2015 Feb 9.

Decoding the regulatory network of early blood development from single-cell gene expression measurements

Affiliations

Decoding the regulatory network of early blood development from single-cell gene expression measurements

Victoria Moignard et al. Nat Biotechnol. 2015 Mar.

Abstract

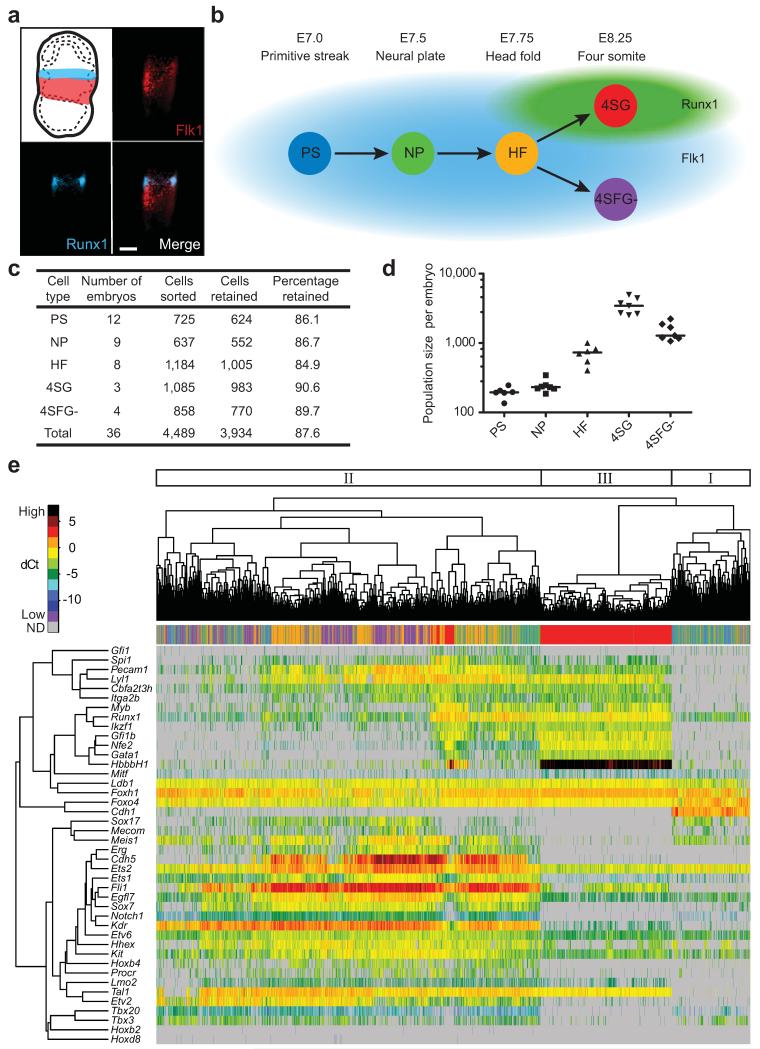
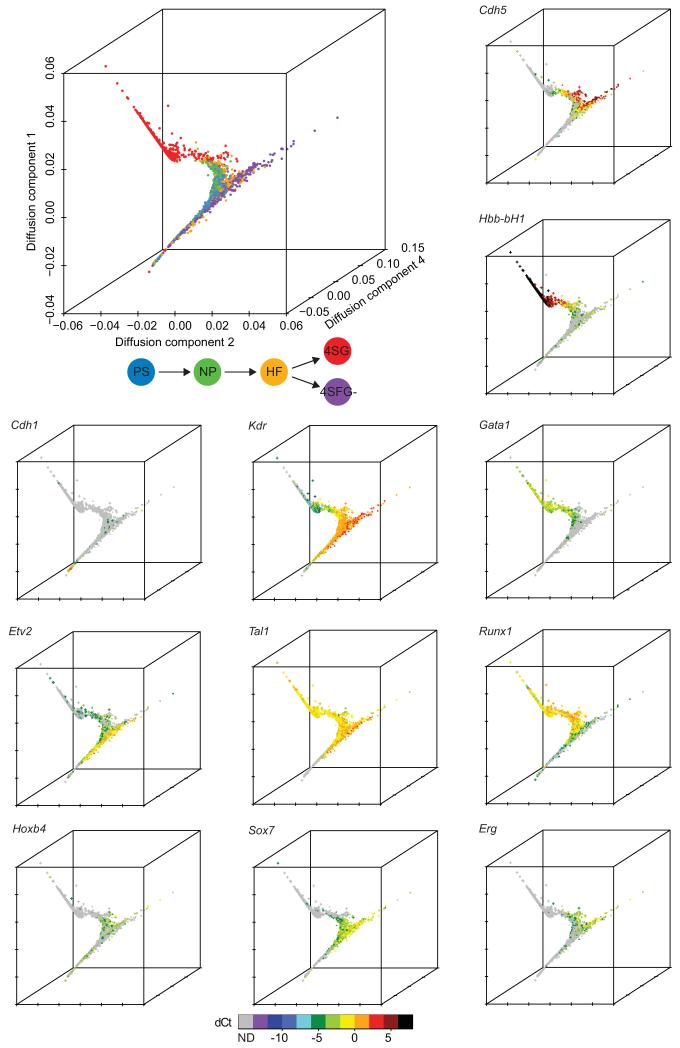
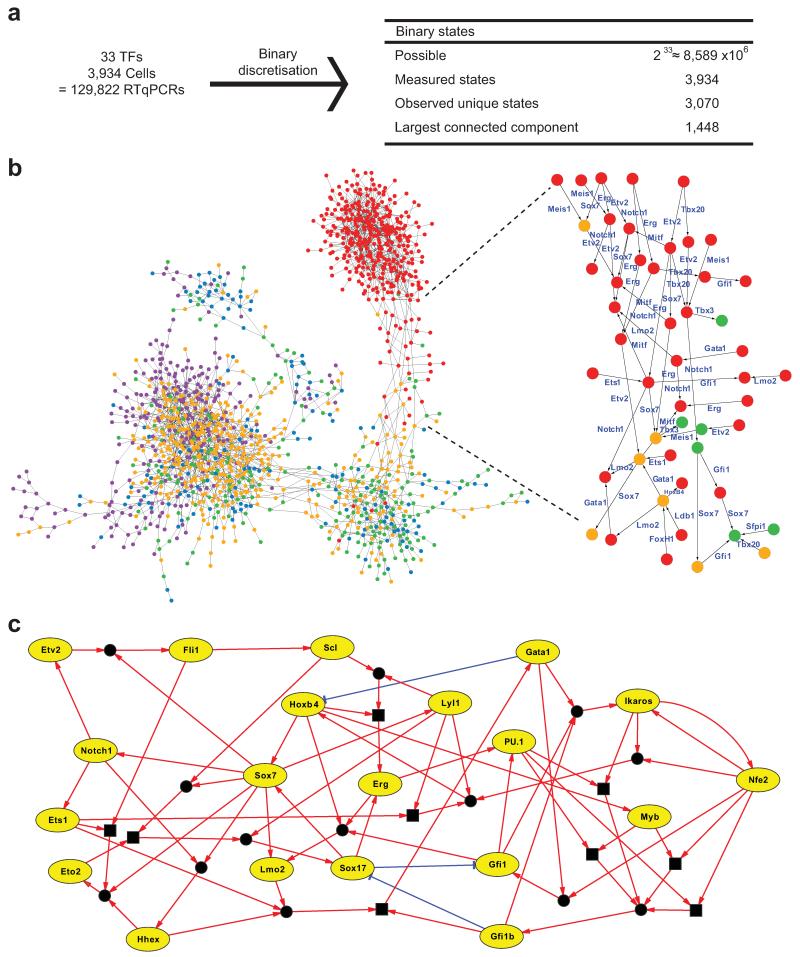
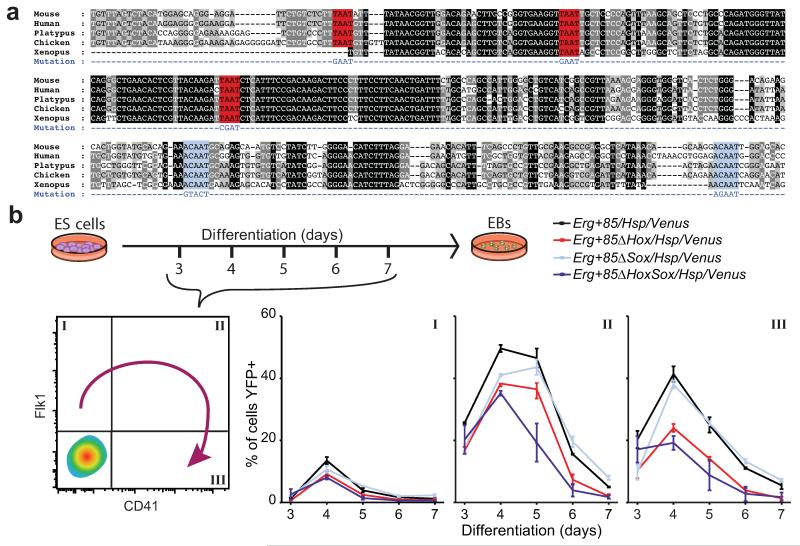
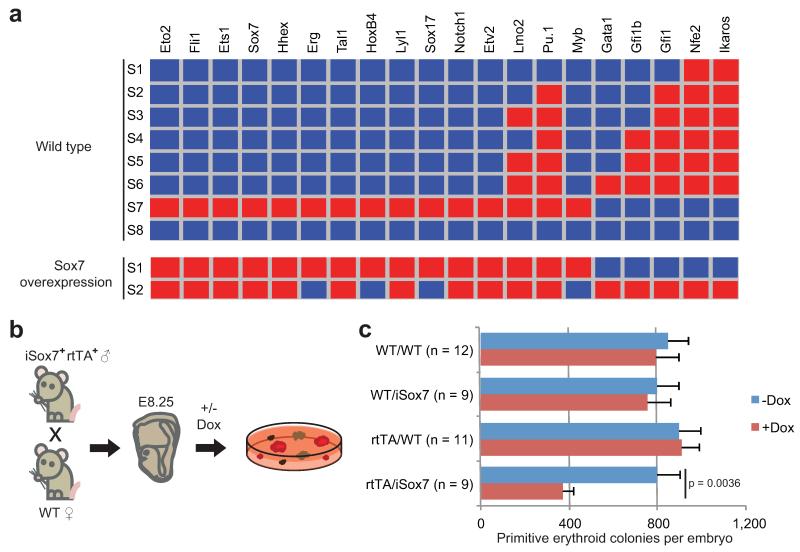
Reconstruction of the molecular pathways controlling organ development has been hampered by a lack of methods to resolve embryonic progenitor cells. Here we describe a strategy to address this problem that combines gene expression profiling of large numbers of single cells with data analysis based on diffusion maps for dimensionality reduction and network synthesis from state transition graphs. Applying the approach to hematopoietic development in the mouse embryo, we map the progression of mesoderm toward blood using single-cell gene expression analysis of 3,934 cells with blood-forming potential captured at four time points between E7.0 and E8.5. Transitions between individual cellular states are then used as input to develop a single-cell network synthesis toolkit to generate a computationally executable transcriptional regulatory network model of blood development. Several model predictions concerning the roles of Sox and Hox factors are validated experimentally. Our results demonstrate that single-cell analysis of a developing organ coupled with computational approaches can reveal the transcriptional programs that underpin organogenesis.


Figures

Figure 1
Figure 1. Single-cell gene expression analysis of early blood development
(a) Flk1 and Runx1 staining in E7.5 mesoderm and blood band, respectively. Scale bar is 100 μm. (b) Single cells sorted from five populations at four anatomically distinct stages from E7.0-8.25. (c) Quantification of cells sorted and retained for analysis after quality control. (d) Quantification of Flk1+, GFP+ or Flk1+GFP− cells in embryos at each time point from FACS data (Supplementary Fig. 1a). Line indicates median. (e) Unsupervised hierarchical clustering of gene expression for the 33 TFs and 7 markers in all cells. Coloured bar indicates embryonic stage. Major clusters indicated. ND, not detected.
Figure 2
Figure 2. Diffusion plots identify developmental trajectories
Diffusion plot of all 3934 cells calculated from the expression of 33 TFs and seven marker genes (top left). Blue, PS; green, NP; orange, HF; red, 4SG; purple, 4SFG. The expression levels of individual genes were then overlaid onto the diffusion plot to highlight patterns of expression (see Supplementary Fig. 5 for additional genes). Circle, PS; diamond, NP; triangle, HF; cross, 4SG; square, 4SFG (visible in high resolution version of figure).
Figure 3
Figure 3. Regulatory network synthesis from single-cell expression profiles
(a) Discretisation of 3,934 expression profiles for 33 TFs yields 3,070 unique binary states, 1448 of which can be connected by single-gene changes to yield a state graph. (b) Representation of resulting state graph, coloured by first embryonic stage appearing in each state. Blue, PS; green, NP; orange, HF; red, 4SG; purple, 4SFG. Magnification of fate transition towards 4SG states, with for example Sox7 expression switching off along all routes. (c) Representation of synthesised asynchronous Boolean network models for core network of 20 TFs. Green edges indicate activation; red edges indicate repression. Square boxes represent AND operations. Circles connecting edges indicate multiple update rules.
Figure 4
Figure 4. Network analysis predicts transcriptional interactions
(a) Alignment of mammalian Erg+85 enhancer. Hox sites, red. Sox sites, light blue. (b) Percentage of Flk1+CD41−, Flk1+CD41+ and Flk1−CD41+ cells on days 3-7 of differentiation expressing YFP. Data are mean and s.e.m of triplicate differentiations of 2-3 clones per construct. P-values are reported in Supplementary Table 6.
Figure 5
Figure 5. In silico perturbations predict key regulators of blood development
(a) Network stable states for wild-type and Sox7 overexpression. Red indicates expressed; blue indicates not expressed. (b) Colony assays with or without doxycycline from genotyped E8.25 embryos from iSox7+rtTA+ mice crossed with wild types. (c) Quantification of primitive erythroid colonies after 4 days (mean and s.e.m for the number of embryos indicated). P-value was determined using the student’s t-test for the number of embryos indicated.

Comment in

  • Singling out blood development.
    Fast EM, Zon LI. Fast EM, et al. Nat Biotechnol. 2015 Mar;33(3):260-1. doi: 10.1038/nbt.3168. Nat Biotechnol. 2015. PMID: 25748916 Free PMC article.

References

    1. Shalaby F, et al. A requirement for Flk1 in primitive and definitive hematopoiesis and vasculogenesis. Cell. 1997;89:981–90. - PubMed
    1. Shalaby F, et al. Failure of blood-island formation and vasculogenesis in Flk-1-deficient mice. Nature. 1995;376:62–6. - PubMed
    1. Guo G, et al. Resolution of cell fate decisions revealed by single-cell gene expression analysis from zygote to blastocyst. Dev. Cell. 2010;18:675–85. - PubMed
    1. Yan L, et al. Single-cell RNA-Seq profiling of human preimplantation embryos and embryonic stem cells. Nat. Struct. Mol. Biol. 2013;20:1131–9. - PubMed
    1. Xue Z, et al. Genetic programs in human and mouse early embryos revealed by single-cell RNA sequencing. Nature. 2013;500:593–7. - PMC - PubMed

Publication types

Associated data