. 2015 Mar;22(3):192-198.
doi: 10.1038/nsmb.2962. Epub 2015 Feb 9.

A global profile of replicative polymerase usage

Affiliations

A global profile of replicative polymerase usage

Yasukazu Daigaku et al. Nat Struct Mol Biol. 2015 Mar.

Abstract

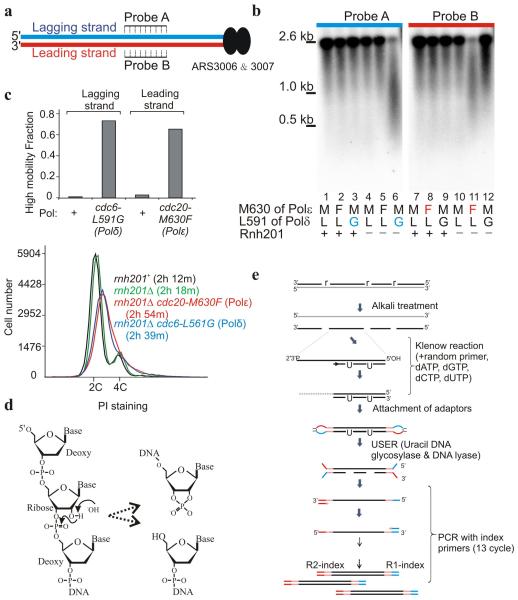
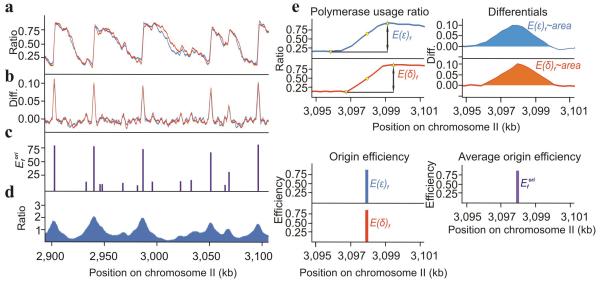
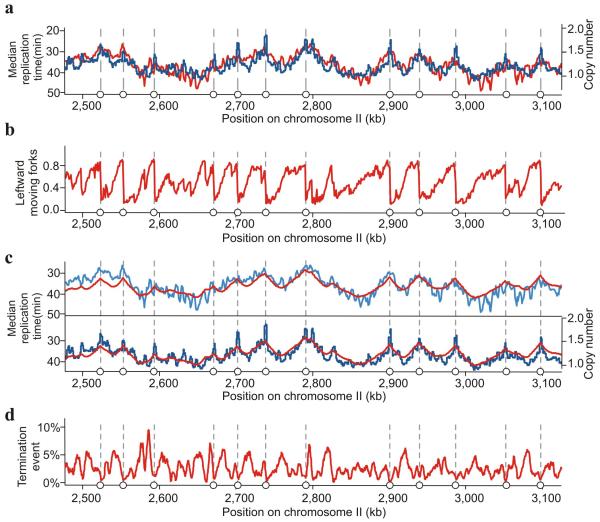
Three eukaryotic DNA polymerases are essential for genome replication. Polymerase (Pol) α-primase initiates each synthesis event and is rapidly replaced by processive DNA polymerases: Polɛ replicates the leading strand, whereas Polδ performs lagging-strand synthesis. However, it is not known whether this division of labor is maintained across the whole genome or how uniform it is within single replicons. Using Schizosaccharomyces pombe, we have developed a polymerase usage sequencing (Pu-seq) strategy to map polymerase usage genome wide. Pu-seq provides direct replication-origin location and efficiency data and indirect estimates of replication timing. We confirm that the division of labor is broadly maintained across an entire genome. However, our data suggest a subtle variability in the usage of the two polymerases within individual replicons. We propose that this results from occasional leading-strand initiation by Polδ followed by exchange for Polɛ.


Figures

Figure 1
Figure 1
rNMP incorporation into DNA in Polδ (cdc6–L591G) and Polε (cdc20–M630F) cells. (a) Schematic representation of the region flanking ARS3006 and 3007. Leading and lagging strands are represented by red and blue lines, respectively. (b) Southern blot of digested and alkali treated genomic DNA hybridized with probes indicated in panel a. (c) Top: the proportion of high mobility product from rnh201Δ cells in experiments equivalent to panel b. Bottom: flow cytometry analysis of wild type, rnh201Δ, rnh201Δ cdc20 –M630F (Polε) and rnh201Δ cdc6–L591G (Polδ) cells with population doubling times in parenthesis. (d) Hydrolysis at the misincorporated RNA molecule. The 2′ OH group of the rNMP is susceptible to nucleophilic attack (left), causing cleavage of the sugar backbone and the generation of a cyclic 2′3′ phosphate and a 5′ OH group. (e) Schematic of library preparation. Position of incorporated ribonucleotides shown as “r”.
Figure 2
Figure 2
Polymerase usage across the fission yeast genome. (a) Total counts of the flanking 5′ nucleotide of the sequenced reads assigned to 300 bp bins plotted for a representative region (Polε (cdc20–M630F; red), Polδ (cdc6–L519G; blue). (b) Ratio of the relative reads in each bin for Polε (cdc20–M630F: (ε/[ε+δ], red) and Polδ (cdc6–L519G: (δ/[δ+ε], blue) plotted for the same region. (c) Smoothed data providing a map of polymerase usage (see also supplementary Fig. 2). Supplementary datasets to visualise the whole genome are listed in supplementary Table 2.
Figure 3
Figure 3
Identification of replication origins. (a) The usage of Polε on the Watson (blue) and Polδ on the Crick (red) strand. (b) The differential (Diff.) of the polymerase usage plots from panel a. (c) Origin efficiencies (Efori) calculated from Pu–seq data. (d) A comparative map of origins generated by BrdU IP–seq from YD18 cells synchronised by cdc25 (G2) block and release into HU (see also supplementary Fig. 2). Supplementary datasets to visualise the whole genome are listed in supplementary Table 2. (e) Example of how origin efficiencies were quantified. Top left: Established minima and maxima (yellow triangles) around the reciprocal peaks (yellow dots) identified from panel b. Top right: example region of differentials from panel b. Bottom left: Differences between the above identified maxima and minima (E(δ)f and E(ε)f). Bottom right: Averaged differences producing the relative origin efficiency (Efori).
Figure 4
Figure 4
Genome replication timing in S. pombe. (a) Flow cytometry profiles of cells synchronised in G2 by elutriation, washed into fresh media and allowed to progress through mitosis and into S phase. (b) The percentage of cells in G2, mitosis, S phase and post S phase cells. (c) The population–average genome copy number calculated for each time point. The period in which cells in the population are in S phase is shaded blue. (d) Visualisation of DNA copy number during the S phase time course across a representative region. Open circles define origins.
Figure 5
Figure 5
Characterisation of DNA replication profiles. (a) Comparison of Trep (median replication time – the time at which 50% of the locus is replicated) calculated from the synchronous culture by marker frequency analysis (see Fig. 4d; red) and the normalised copy number of each locus from a single population of cells sorted by FACS from an asynchronous culture (sort–seq; blue). Open circles define origins. (b) The percentage of leftward moving forks calculated from the Pu–seq data. (c) Comparison of Trep derived from marker frequency analysis and sort–seq with Trep determined by Pu–seq. In both panels the red line represents Trep calculated from the Pu–seq data. In the top panel, the blue line represents Trep calculated from the marker frequency analysis. In the bottom panel, the blue line shows the copy numbers derived from sort–seq. (d) The calculated percentage of replication termination events from the Pu–seq data for each locus. Supplementary datasets to visualise the whole genome are listed in supplementary Table 2.
Figure 6
Figure 6
Asymmetric polymerase usage within a replicon. (a) Two example regions showing polymerase usage across inter–origin regions. Top panels: the ratios of usage of Polε (red) and Polδ (blue) on the Watson Strand and Crick strand. Bottom panels: total polymerase usage on duplex DNA. (b) Top: the 85 inter–origin regions between high efficiency origins (Efori > 40%) of >30 kb which do not contain lower efficiency origins (20% < Efori < 40%) are displayed as a heat map aligned to the 3 chromosomes (right bar). Light pink represents early replicating regions, brown represents late replicating regions (see supplementary Fig. 1c). Each row represents an inter–origin region. The horizontal axis shows the relative position between origins. Bottom: average values. SD = standard deviation. Supplementary datasets to visualise the whole genome are listed in supplementary Table 2.

Similar articles

Cited by

References

    1. Bartkova J, et al. DNA damage response as a candidate anti-cancer barrier in early human tumorigenesis. Nature. 2005;434:864–70. - PubMed
    1. Gorgoulis VG, et al. Activation of the DNA damage checkpoint and genomic instability in human precancerous lesions. Nature. 2005;434:907–13. - PubMed
    1. Rhind N, Gilbert DM. DNA replication timing. Cold Spring Harb. Perspect. Biol. 2013;5:a010132. - PMC - PubMed
    1. Stillman B. Origin recognition and the chromosome cycle. FEBS Lett. 2005;579:877–84. - PubMed
    1. Hawkins M, et al. High-resolution replication profiles define the stochastic nature of genome replication initiation and termination. Cell reports. 2013;5:1132–41. - PMC - PubMed

References for Online Methods

    1. Moreno S, Klar A, Nurse P. Molecular genetic analysis of fission yeast Schizosaccharomyces pombe. Methods Enzymol. 1991;194:795–823. - PubMed
    1. Watson AT, Garcia V, Bone N, Carr AM, Armstrong J. Gene tagging and gene replacement using recombinase-mediated cassette exchange in Schizosaccharomyces pombe. Gene. 2008;407:63–74. - PubMed
    1. Lipkin D, Talbert PT, Cohn M. The Mechanism of the Alkaline Hydrolysis of Ribonucleic Acids. J. Am. Chem. Soc. 1954;76:2871–2872.
    1. Zhang Z, Theurkauf WE, Weng Z, Zamore PD. Strand-specific libraries for high throughput RNA sequencing (RNA-Seq) prepared without poly(A) selection. Silence. 2012;3:9. - PMC - PubMed
    1. Marguerat S, et al. Quantitative analysis of fission yeast transcriptomes and proteomes in proliferating and quiescent cells. Cell. 2012;151:671–83. - PMC - PubMed

Publication types

MeSH terms

Associated data