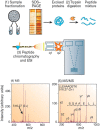
Proteomic challenges: sample preparation techniques for microgram-quantity protein analysis from biological samples
- PMID: 25664860
- PMCID: PMC4346912
- DOI: 10.3390/ijms16023537
Proteomic challenges: sample preparation techniques for microgram-quantity protein analysis from biological samples
Abstract
Proteins regulate many cellular functions and analyzing the presence and abundance of proteins in biological samples are central focuses in proteomics. The discovery and validation of biomarkers, pathways, and drug targets for various diseases can be accomplished using mass spectrometry-based proteomics. However, with mass-limited samples like tumor biopsies, it can be challenging to obtain sufficient amounts of proteins to generate high-quality mass spectrometric data. Techniques developed for macroscale quantities recover sufficient amounts of protein from milligram quantities of starting material, but sample losses become crippling with these techniques when only microgram amounts of material are available. To combat this challenge, proteomicists have developed micro-scale techniques that are compatible with decreased sample size (100 μg or lower) and still enable excellent proteome coverage. Extraction, contaminant removal, protein quantitation, and sample handling techniques for the microgram protein range are reviewed here, with an emphasis on liquid chromatography and bottom-up mass spectrometry-compatible techniques. Also, a range of biological specimens, including mammalian tissues and model cell culture systems, are discussed.
Figures


References
-
- Tonge R., Shaw J., Middleton B., Rowlinson R., Rayner S., Young J., Pognan F., Hawkins E., Currie I., Davison M. Validation and development of fluorescence two-dimensional differential gel electrophoresis proteomics technology. Proteomics. 2001;1:377–396. doi: 10.1002/1615-9861(200103)1:3<377::AID-PROT377>3.0.CO;2-6. - DOI - PubMed
-
- Tanaka K., Waki H., Ido Y., Akita S., Yoshida Y., Yoshida T., Matsuo T. Protein and polymer analyses up to m/z 100,000 by laser ionization time-of-flight mass spectrometry. Rapid Commun. Mass Spectrom. 1988;2:151–153. doi: 10.1002/rcm.1290020802. - DOI
Publication types
MeSH terms
Substances
Grants and funding
LinkOut - more resources
Full Text Sources
Other Literature Sources

