. 2015 Mar;47(3):209-16.
doi: 10.1038/ng.3214. Epub 2015 Feb 9.

A Big Bang model of human colorectal tumor growth

Affiliations

A Big Bang model of human colorectal tumor growth

Andrea Sottoriva et al. Nat Genet. 2015 Mar.

Abstract

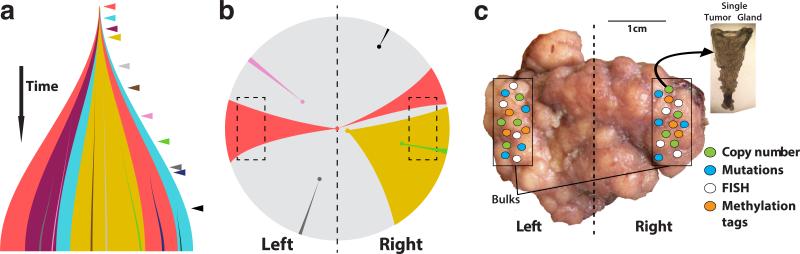
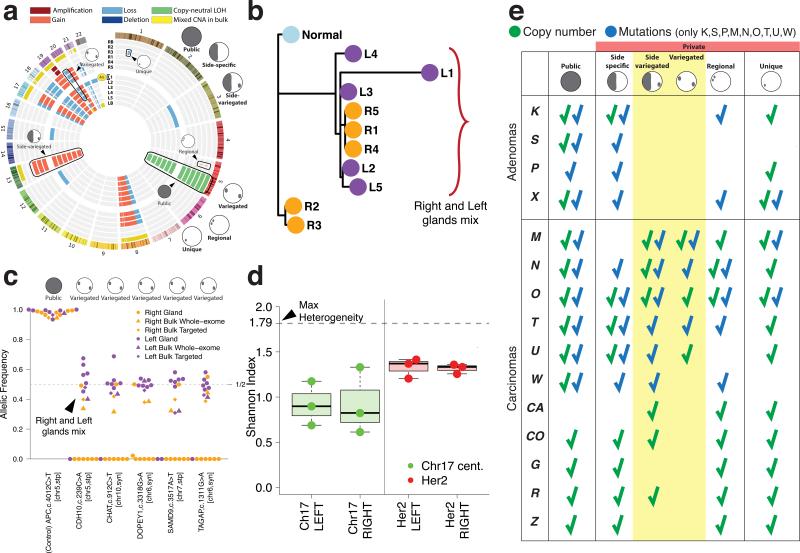
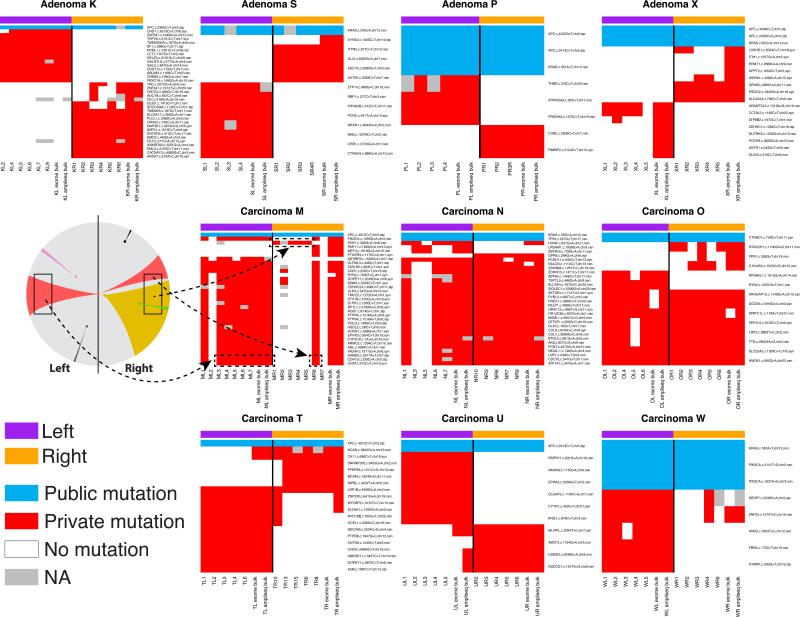
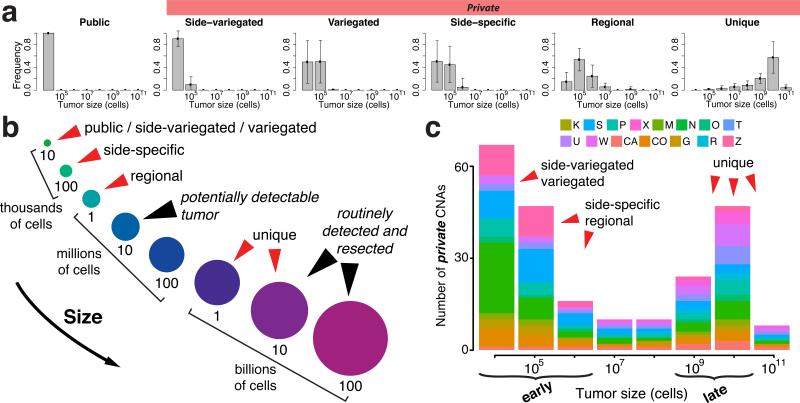
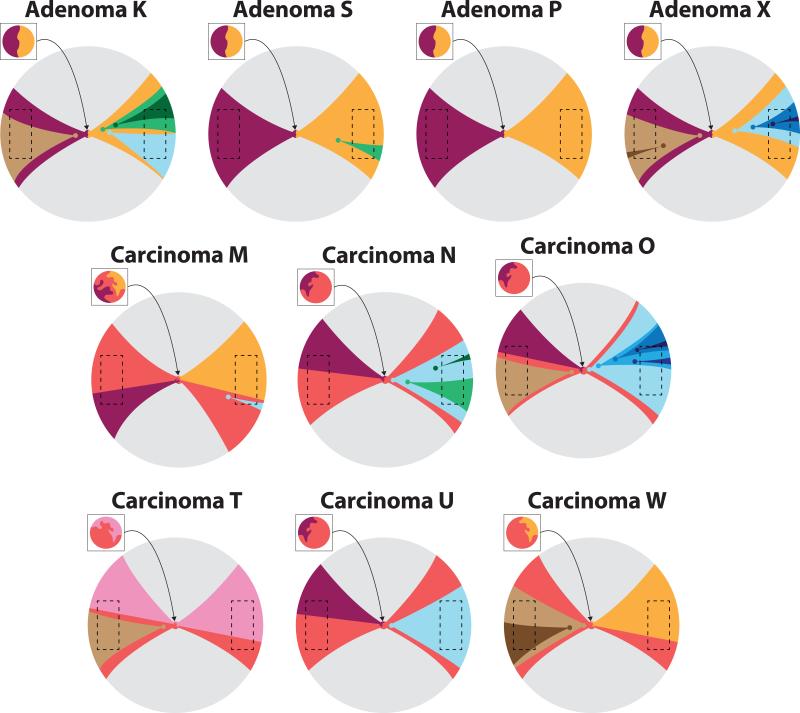
What happens in early, still undetectable human malignancies is unknown because direct observations are impractical. Here we present and validate a 'Big Bang' model, whereby tumors grow predominantly as a single expansion producing numerous intermixed subclones that are not subject to stringent selection and where both public (clonal) and most detectable private (subclonal) alterations arise early during growth. Genomic profiling of 349 individual glands from 15 colorectal tumors showed an absence of selective sweeps, uniformly high intratumoral heterogeneity (ITH) and subclone mixing in distant regions, as postulated by our model. We also verified the prediction that most detectable ITH originates from early private alterations and not from later clonal expansions, thus exposing the profile of the primordial tumor. Moreover, some tumors appear 'born to be bad', with subclone mixing indicative of early malignant potential. This new model provides a quantitative framework to interpret tumor growth dynamics and the origins of ITH, with important clinical implications.


Figures

Figure 1
Figure 1. The Big Bang model of tumor growth
(a) After initiation, a tumor grows predominantly as a single expansion populated by numerous heterogeneous sub-clones. ITH results from private mutations (colored arrowheads) continuously accumulating due to replication errors. In addition to public mutations present in the first transformed cell, private mutations acquired early persist and become pervasive in the final tumor, while remaining non-dominant (colored segments). Late-arising mutations are only present in small regions of the tumor. (b) In the Big Bang model, the pervasiveness of private mutations depends on when the mutation occurs during growth, rather than selection for that mutation. The schematic illustrates how early private alterations, despite remaining non-dominant, are pervasive within the tumor (e.g. red and yellow), and can be found in distant regions, thus appearing variegated (e.g. red). This is due to aberrant sub-clone mixing in the primordial tumor, followed by scattering during expansion. Late alterations will be restricted to small regions (e.g. black) and are essentially undetectable by conventional whole exome sequencing (WES). Distance from the dashed vertical axis indicates increasingly late mutations. Dashed boxes indicate sampled regions. (c) We sampled an average of 23 individual tumor glands (<10,000 cells) from distant regions (~0.5cm3 in size, 1cm scale shown) and bulk (left, right) samples. Samples were profiled using several genomic techniques, including copy number analysis, WES and targeted sequencing, neutral methylation tag sequencing, and FISH, providing a panoramic view of genomic alterations throughout the tumor at multiple spatial scales.
Figure 2
Figure 2. The spatial distribution of ITH reveals sub-clone mixing and the absence of clonal expansions
(a) Circos plot representation of CNAs in individual glands and bulk samples for carcinoma M (shown throughout this figure). (b) Gland-level CNAs were employed to reconstruct the tumor phylogeny. Mixing of glands from opposite regions is apparent, where right and left glands are colored orange and purple, respectively. (c) Targeted sequencing of patient-specific mutations in individual glands revealed variegation in subsets of glands from opposite sides, thus confirming sub-clone mixing at the mutational level. A public APC mutation is illustrated as a clonal control (with LOH noted on chr 5). (d) FISH performed using HER2 probes (red) and corresponding chr 17 centromere (green) probes revealed high variability in copy number states between cells within a gland, as summarized by the Shannon Index. For each group, boxplots show the median, limited by the 25th (Q1) and 75th (Q3) percentiles, where whiskers represent the most extreme of the maximum or Q3+1.5(Q3–Q1) and the minimum or Q1–1.5(Q3–Q1), respectively. The maximum possible ITH value (“Max Heterogeneity”) corresponds to an index of 1.79 (99% of the FISH counts, range 0–5). (e) Summary of the characteristic spatial patterns and types of alterations in each tumor. While adenomas were characterized by low chromosomal instability and the segregation of alterations, carcinomas harbored side-variegated and variegated alterations (7/11 at the copy number level and 6/6 at the mutational level).
Figure 3
Figure 3. Single-gland targeted sequencing confirms the predictions of the Big Bang model and exposes variegation in carcinomas but not adenomas
Heat maps indicate the presence of representative public and private mutations across multiple individual glands per tumor, where targeted sequencing and whole-exome sequencing of the bulk tumor is included for comparison. In all the adenomas, private mutations are confined to a single tumor side (regional and side-specific events), whereas in invasive carcinomas the same private mutation is found in distant regions of the neoplasm, despite remaining non-dominant. These patterns of genetic variegation are indicative of sub-clone mixing in the early neoplasm followed by scattering. For representative carcinoma M, the mutational data are summarized according to the schematic in Figure 1b, where variegated mutations (red) occurred early and scattered to distant tumor regions. Regional mutations (yellow) occurred later and were confined to smaller regions of the neoplasm.
Figure 4
Figure 4. Inference on the genomic data verifies that most detectable ITH occurs early during tumor growth
(a) The inferred mutational timeline is indicated for different classes of CNAs for all tumors, where time is represented in relation to tumor volume. In particular, the posterior probability distribution of tumor size (number of cells) is illustrated for each class of alteration. The results show that both public alterations, as well as the majority of private alterations (including side-specific, side-variegated, and variegated) occur very early after the transition to an advanced neoplasm, whilst the tumor is less than one million cells, whereas unique mutations occur late. Error bars represent the standard deviation. (b) A schematic representation of the mutational timeline (from panel a) illustrates that the majority of detectable non-unique alterations occur early, while the tumor is orders of magnitude smaller than can be clinically detected. As reliable estimates of cell cycle time are not available and somatic alterations depend on cell division rates rather than time, tumor size is used as surrogate of time. (c) By applying the inferred mutational timeline to the whole genome CNA profiles for each patient, it is apparent that early CNAs dominate the genomic landscape. Here, early events correspond to alterations that took place when the tumor was <106 cells and late alterations correspond to those that occurred after the tumor reached 109 cells. For simplicity, only private alterations are represented since all public alterations occur early.
Figure 5
Figure 5. Schematic representation of spatio-temporal Big Bang growth dynamics
For each tumor profiled at the mutational level, the phylogeny was reconstructed from the single gland and bulk tumor data (see Online Methods) in order to define sub-clones, or groups of glands harboring the same private mutations. The relative timing during which each sub-clone arose was specified based on the inferred mutational timeline (Figure 4a and Supplementary Figure S9c) for the different classes of private alterations (variegated/side-specific/regional/unique). By combining information on the mutational timeline and tumor sub-clonal architecture, we can approximately reconstruct patient-specific spatio-temporal evolutionary dynamics, as shown in this schematic. Here the topographical distribution of different sub-clones is illustrated by distinct colors and distance from the tumor origin (arrowhead) indicates increasingly late alterations. Variegated and side-variegated sub-clones occurred very early within the primordial tumor (<1 million cells) and are shown within the inset square representing the zoomed-in view of the primordial neoplasm. Regional and unique sub-clones arose later and are represented outside the inset square. Dashed boxes represent regions of the tumor that were experimentally sampled. This schematic shows how in the Big Bang tumor model, the prevalence of a private mutation depends on when it arose during tumor expansion, rather than selection for that mutation. The schematic also illustrates that although all tumors exhibit Big Bang dynamics, sub-clone mixing is restricted to carcinomas, whereas adenomas are characterized by sub-clone segregation.

Comment in

References

    1. Greaves M, Maley CC. Clonal evolution in cancer. Nature. 2012;481:306–313. - PMC - PubMed
    1. Vogelstein B, et al. Cancer genome landscapes. Science. 2013;339:1546–1558. - PMC - PubMed
    1. Basanta D, Anderson ARA. Exploiting ecological principles to better understand cancer progression and treatment. Interface Focus. 2013;3:20130020. - PMC - PubMed
    1. Fearon ER, Fearon ER, Vogelstein B, Vogelstein B. A genetic model for colorectal tumorigenesis. Cell. 1990;61:759–767. - PubMed
    1. Siegmund KD, et al. Inferring clonal expansion and cancer stem cell dynamics from DNA methylation patterns in colorectal cancers. Proc. Natl. Acad. Sci. U.S.A. 2009;106:4828–4833. - PMC - PubMed

Publication types

Associated data