Reinforcement learning models and their neural correlates: An activation likelihood estimation meta-analysis
- PMID: 25665667
- PMCID: PMC4437864
- DOI: 10.3758/s13415-015-0338-7
Reinforcement learning models and their neural correlates: An activation likelihood estimation meta-analysis
Abstract
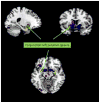
Reinforcement learning describes motivated behavior in terms of two abstract signals. The representation of discrepancies between expected and actual rewards/punishments-prediction error-is thought to update the expected value of actions and predictive stimuli. Electrophysiological and lesion studies have suggested that mesostriatal prediction error signals control behavior through synaptic modification of cortico-striato-thalamic networks. Signals in the ventromedial prefrontal and orbitofrontal cortex are implicated in representing expected value. To obtain unbiased maps of these representations in the human brain, we performed a meta-analysis of functional magnetic resonance imaging studies that had employed algorithmic reinforcement learning models across a variety of experimental paradigms. We found that the ventral striatum (medial and lateral) and midbrain/thalamus represented reward prediction errors, consistent with animal studies. Prediction error signals were also seen in the frontal operculum/insula, particularly for social rewards. In Pavlovian studies, striatal prediction error signals extended into the amygdala, whereas instrumental tasks engaged the caudate. Prediction error maps were sensitive to the model-fitting procedure (fixed or individually estimated) and to the extent of spatial smoothing. A correlate of expected value was found in a posterior region of the ventromedial prefrontal cortex, caudal and medial to the orbitofrontal regions identified in animal studies. These findings highlight a reproducible motif of reinforcement learning in the cortico-striatal loops and identify methodological dimensions that may influence the reproducibility of activation patterns across studies.
Conflict of interest statement
The authors declare no financial conflicts of interest that may have biased the present work.
Figures


Similar articles
-
Expected value and prediction error abnormalities in depression and schizophrenia.Brain. 2011 Jun;134(Pt 6):1751-64. doi: 10.1093/brain/awr059. Epub 2011 Apr 10. Brain. 2011. PMID: 21482548
-
Prediction error in reinforcement learning: a meta-analysis of neuroimaging studies.Neurosci Biobehav Rev. 2013 Aug;37(7):1297-310. doi: 10.1016/j.neubiorev.2013.03.023. Epub 2013 Apr 6. Neurosci Biobehav Rev. 2013. PMID: 23567522 Review.
-
Heterarchical reinforcement-learning model for integration of multiple cortico-striatal loops: fMRI examination in stimulus-action-reward association learning.Neural Netw. 2006 Oct;19(8):1242-54. doi: 10.1016/j.neunet.2006.06.007. Epub 2006 Sep 20. Neural Netw. 2006. PMID: 16987637
-
How we learn to make decisions: rapid propagation of reinforcement learning prediction errors in humans.J Cogn Neurosci. 2014 Mar;26(3):635-44. doi: 10.1162/jocn_a_00509. Epub 2013 Oct 29. J Cogn Neurosci. 2014. PMID: 24168216
-
Dialogues on prediction errors.Trends Cogn Sci. 2008 Jul;12(7):265-72. doi: 10.1016/j.tics.2008.03.006. Epub 2008 Jun 21. Trends Cogn Sci. 2008. PMID: 18567531 Review.
Cited by
-
The neurocognitive role of working memory load when Pavlovian motivational control affects instrumental learning.PLoS Comput Biol. 2023 Dec 8;19(12):e1011692. doi: 10.1371/journal.pcbi.1011692. eCollection 2023 Dec. PLoS Comput Biol. 2023. PMID: 38064498 Free PMC article.
-
Dissociable roles of left and right temporoparietal junction in strategic competitive interaction.Soc Cogn Affect Neurosci. 2019 Oct 1;14(10):1037-1048. doi: 10.1093/scan/nsz082. Soc Cogn Affect Neurosci. 2019. PMID: 31680151 Free PMC article.
-
Mapping adolescent reward anticipation, receipt, and prediction error during the monetary incentive delay task.Hum Brain Mapp. 2019 Jan;40(1):262-283. doi: 10.1002/hbm.24370. Epub 2018 Sep 21. Hum Brain Mapp. 2019. PMID: 30240509 Free PMC article.
-
Understanding the Neurocomputational Mechanisms of Antidepressant Placebo Effects.J Psychiatr Brain Sci. 2021;6:e210001. doi: 10.20900/jpbs.20210001. Epub 2021 Feb 15. J Psychiatr Brain Sci. 2021. PMID: 33732892 Free PMC article.
-
Neural correlates of appetitive extinction in humans.Soc Cogn Affect Neurosci. 2017 Jan 1;12(1):106-115. doi: 10.1093/scan/nsw157. Soc Cogn Affect Neurosci. 2017. PMID: 27803289 Free PMC article.
References
-
- Balleine BW, Dickinson A. Goal-directed instrumental action: contingency and incentive learning and their cortical substrates. Neuropharmacology. 1998;37(4–5):407–419. - PubMed
-
- Behrens TEJ, Woolrich MW, Walton ME, Rushworth MFS. Learning the value of information in an uncertain world. Nat Neurosci. 2007;10(9):1214–1221. http://www.nature.com/neuro/journal/v10/n9/suppinfo/nn1954_S1.html. - PubMed
Publication types
MeSH terms
Grants and funding
LinkOut - more resources
Full Text Sources
Other Literature Sources

