

Defective NOD2 peptidoglycan sensing promotes diet-induced inflammation, dysbiosis, and insulin resistance
- PMID: 25666722
- PMCID: PMC4364944
- DOI: 10.15252/emmm.201404169
Defective NOD2 peptidoglycan sensing promotes diet-induced inflammation, dysbiosis, and insulin resistance
Abstract
Pattern recognition receptors link metabolite and bacteria-derived inflammation to insulin resistance during obesity. We demonstrate that NOD2 detection of bacterial cell wall peptidoglycan (PGN) regulates metabolic inflammation and insulin sensitivity. An obesity-promoting high-fat diet (HFD) increased NOD2 in hepatocytes and adipocytes, and NOD2(-/-) mice have increased adipose tissue and liver inflammation and exacerbated insulin resistance during a HFD. This effect is independent of altered adiposity or NOD2 in hematopoietic-derived immune cells. Instead, increased metabolic inflammation and insulin resistance in NOD2(-/-) mice is associated with increased commensal bacterial translocation from the gut into adipose tissue and liver. An intact PGN-NOD2 sensing system regulated gut mucosal bacterial colonization and a metabolic tissue dysbiosis that is a potential trigger for increased metabolic inflammation and insulin resistance. Gut dysbiosis in HFD-fed NOD2(-/-) mice is an independent and transmissible factor that contributes to metabolic inflammation and insulin resistance when transferred to WT, germ-free mice. These findings warrant scrutiny of bacterial component detection, dysbiosis, and protective immune responses in the links between inflammatory gut and metabolic diseases, including diabetes.
Keywords: diabetes; glucose; metabolic inflammation; microbiome; obesity.
© 2015 The Authors. Published under the terms of the CC BY 4.0 license.
Figures
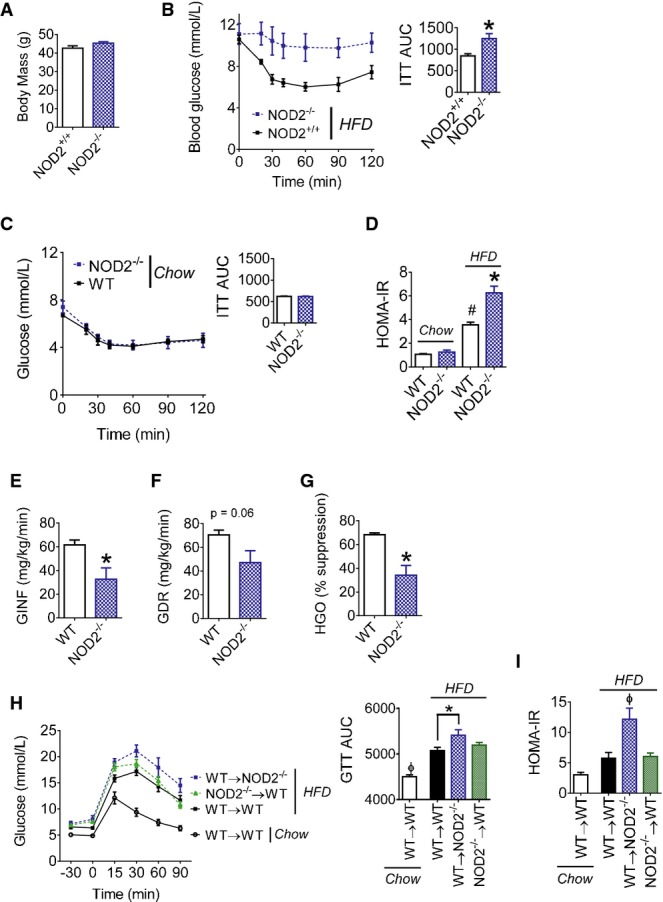
A, B Body mass (A), blood glucose, and the cumulative area under the curve (AUC) (B) during insulin tolerance tests (ITT; 1.0 IU/kg i.p.) in NOD2+/+ (n = 8) and NOD2−/− (n = 10) littermate mice fed a HFD for 16 weeks, *P = 0.001.
C Blood glucose and the cumulative AUC during insulin tolerance tests (ITT; 0.5 IU/kg i.p.) in chow-fed WT (n = 6) and NOD2−/− (n = 6) mice.
D HOMA insulin resistance (IR) index in weight-matched chow- (n = 7) or HFD-fed (n = 10) WT and NOD2−/− mice, #P = 0.0001 (WT chow versus WT HFD) and *P = 0.0001 (WT HFD versus NOD2−/− HFD).
E, F Glucose infusion rate (GINF) (E) and glucose disposal rate (GDR) (F) during hyperinsulinemic euglycemic clamps in weight-matched WT (n = 4) and NOD2−/− (n = 3) mice fed a HFD for 16 weeks, *P = 0.02.
G Percentage of hepatic glucose output (HGO) suppression during hyperinsulinemic euglycemic clamps in weight-matched WT (n = 4) and NOD2−/− (n = 3) mice fed a HFD for 16 weeks, *P = 0.005.
H Blood glucose and cumulative AUC during glucose tolerance tests (GTT; 1.0 g/kg) in chow-fed (n = 3) or HFD-fed WT and NOD2−/− mice (n > 8 for all groups) after bone marrow transplantation, *P = 0.04 and ϕP = 0.01.
I HOMA-IR in chow-fed (n = 3) or HFD-fed WT and NOD2−/− mice (n > 8 for all groups) after bone marrow transplantation, ϕP = 0.003.
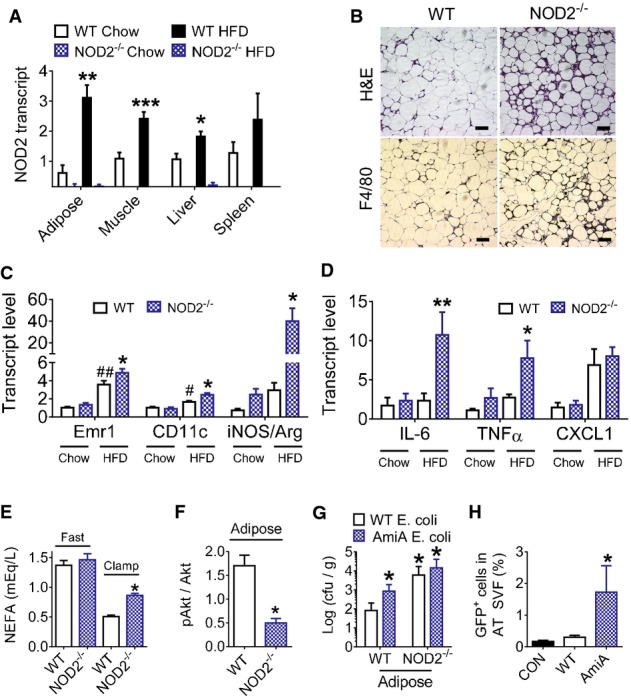
A Transcript levels of NOD2 in various tissues of chow-fed (n = 5, all tissues in both genotypes) and 16 week HFD-fed (n = 6) WT and NOD2−/− mice, *P = 0.005, **P = 0.001, and ***P = 0.0004.
B H&E histology and IHC of the macrophage marker F4/80 in adipose tissue from HFD-fed WT and NOD2−/− mice (representative of n = 5 WT and n = 6 NOD2−/− mice). Scale bar equals 50 μm.
C, D Quantification of immune cell and inflammatory markers (C) and pro-inflammatory cytokines (D) in adipose tissue of chow-fed (n = 5 in both genotypes) or HFD-fed (n = 11 in both genotypes) WT and NOD2−/− mice, *P = 0.04, **P = 0.02, ##P = 0.004, and #P = 0.04.
E Quantification of serum non-esterified fatty acids (NEFA) in fasted and clamped HFD-fed WT (n = 4) and NOD2−/− (n = 3) mice, *P = 0.0001.
F Quantification of insulin-stimulated pAktSer473 in gonadal adipose tissue at the end of the clamp in HFD-fed WT (n = 5) and NOD2−/− mice (n = 5), *P = 0.04.
G The number of ampicillin-resistant E. coli cfu per gram of visceral adipose tissue was determined in WT (n = 5) and NOD2−/− (n = 5) mice after oral administration of 109 cfu of WT or mutant (ΔamiA) DsRed-labeled E. coli, *P = 0.02.
H Quantification of GFP-positive E. coli in the adipose tissue stromal vascular fraction (SVF) from WT mice with no oral bacterial administration (CON,n = 3) or after administration of 109 cfu WT GFP-positive E. coli (n = 4) or ΔamiAGFP-positive E. coli (n = 4), *P = 0.03.
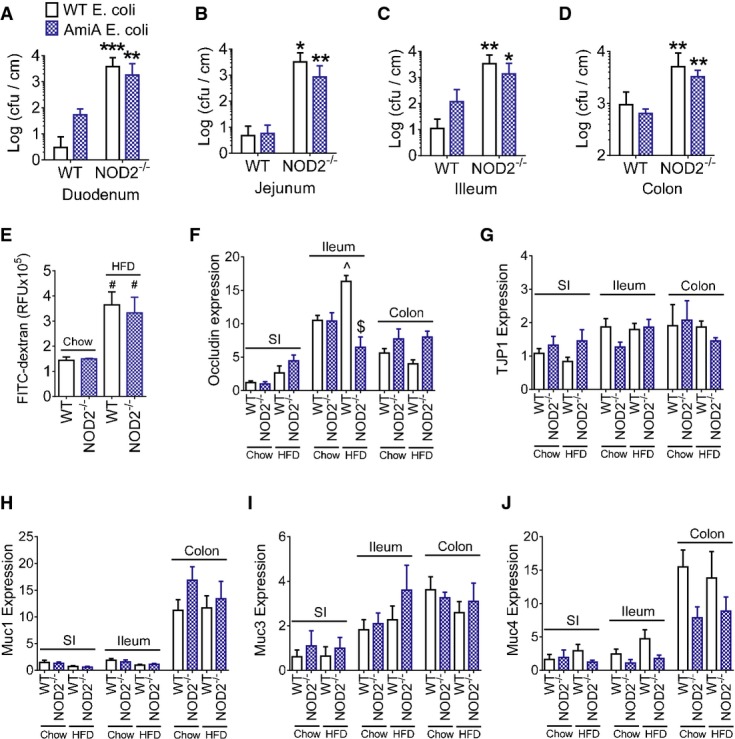
A-D The number of ampicillin-resistant E. coli cfu per cm of gut mucosa in the duodenum (A), jejunum (B), ileum (C), and colon (D) 2 h after oral administration of 109 cfu of WT E. coli in WT (n = 4) and NOD2−/− (n = 6) mice or ΔamiA E. coli in WT (n = 5) and NOD2−/− (n = 6) mice. *Significantly different from WT mice, *P = 0.04, **P = 0.02, and ***P = 0.01.
E FITC detected in the serum 4 h after oral gavage of FITC-dextran in chow-fed WT (n = 4) and NOD2−/− mice (n = 3) and HFD-fed WT (n = 4) and NOD2−/− mice (n = 5) mice, #Significantly different from chow-fed mice, P = 0.02.
F-J Quantification of tight junction markers occludin (F) and TJP1 (G) and mucins (H–J) in the small intestine (SI), illeum, and colon of chow-fed WT (n = 9), chow-fed NOD2−/− (n = 8), HFD-fed WT (n = 9), and HFD-fed NOD2−/− mice (n = 7). ^Significantly different from chow-fed mice in the same gut segment, P = 0.002. $Significantly different from WT HFD-fed mice in the same gut segment, P = 0.0001.
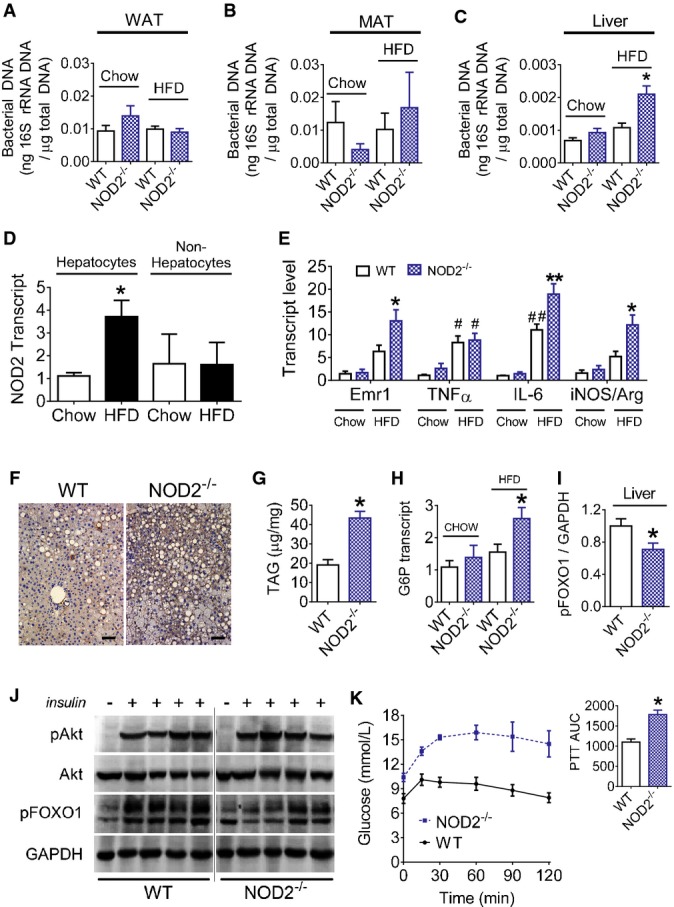
A-C Quantification of bacterial DNA in the gonadal white adipose tissue (A) (WAT,n = 14–16 mice for all groups), mesenteric adipose tissue (B) (MAT,n = 10–15 mice for all groups), and liver (C) (n = 10–12 mice for all groups) of chow-fed and 16 week HFD-fed WT and NOD2−/− mice, *P = 0.0002.
D Quantification of NOD2 transcripts in hepatocyte and non-hepatocyte cell populations of liver from chow-fed (n = 10) and HFD-fed (n = 6) WT mice, *P = 0.006.
E Quantification of macrophage and inflammatory markers in liver of chow-fed (n = 5 in both genotypes) or HFD-fed (n = 11 in both genotypes) WT and NOD2−/− mice (n = 6 for IL-6 analysis), *P = 0.02, **P = 0.0001, #P = 0.02, and ##P = 0.002.
F Representative liver IHC for the macrophage marker F4/80 (representative of n = 5 WT and n = 6 NOD2−/− mice). Scale bar equals 50 μm.
G Quantification of hepatic triglycerides (TAG) in HFD-fed WT (n = 6) and NOD2−/− (n = 6) mice, *P = 0.0002.
H Quantification of hepatic G6P transcript levels in chow-fed (n = 5) and HFD-fed (n = 11) WT and NOD2−/− mice, *P = 0.02.
I, J Quantification (I) and immunoblots (J) of insulin-stimulated pFOXO1Ser256 in liver lysates after vena cava injection of insulin (0.5 IU/kg) in HFD-fed WT (n = 4) and NOD2−/− (n = 4) mice, *P = 0.0498.
K Blood glucose and quantification of the AUC during a 120-min pyruvate tolerance test (PTT, 2.0 g/kg pyruvate, i.p.) in HFD-fed WT (n = 6) and NOD2−/− mice (n = 6), *P = 0.0005.
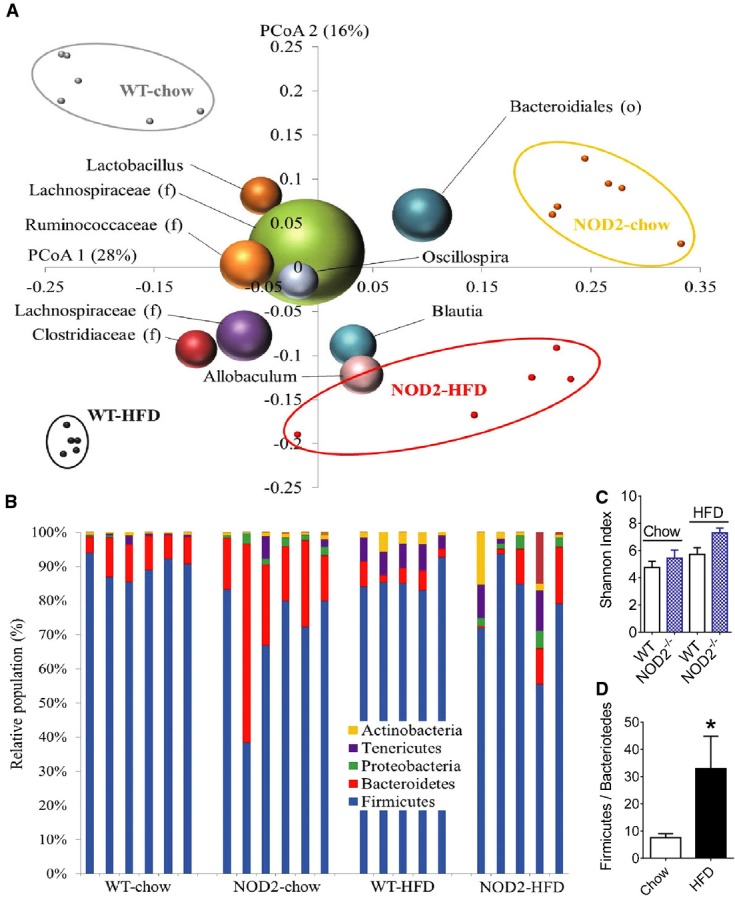
A Unweighted UniFrac principal coordinates analysis (PCoA) plot illustrating the relative degree that genotype (NOD2−/− versus WT, PCoA1: 28%) and diet (chow versus HFD, PCoA2: 16%) defined the diversity of the microbiota in the cecum. The most abundant bacterial genus are labeled and superimposed on the same PCoA plot. Each small dot is a mouse, and the size of the sphere representing a taxon is proportional to the mean relative abundance of the taxon across all samples.
B Bar graph showing the relative abundance of phyla from each mouse cecum, where each bar is a separate mouse.
C Alpha diversity represented by the Shannon index in chow-fed (n = 6) and HFD-fed (n = 5) WT and NOD2−/− mice. Values are mean ± SEM.
D Impact of diet on the Firmicutes/Bacteroidetes ratio in the cecum of chow-fed (n = 12) and HFD-fed (n = 10) mice. *Significantly different from chow-fed mice, P = 0.03. An unpaired t-test was used. Values are mean ± SEM.
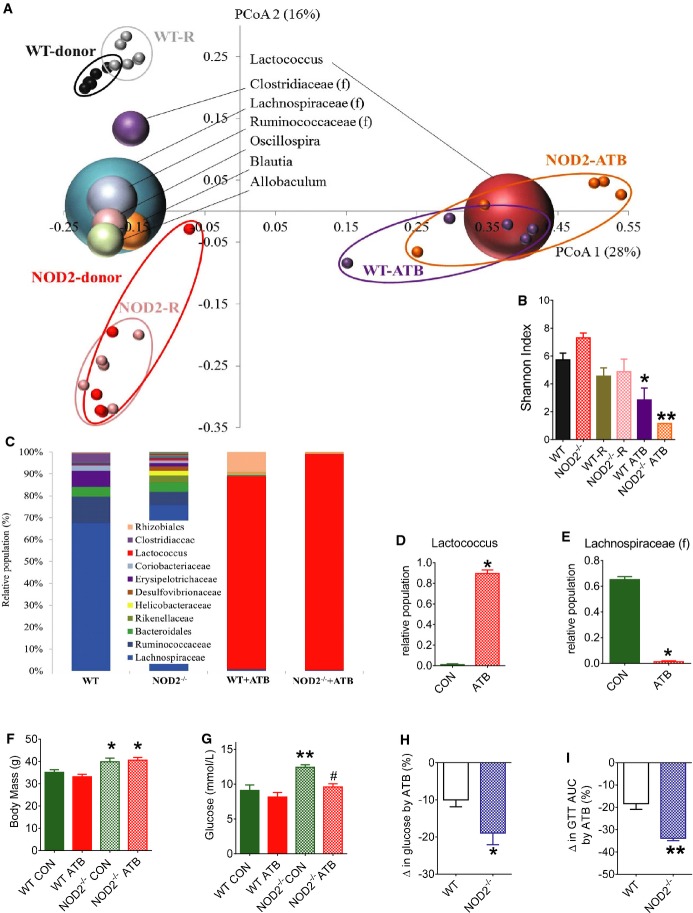
A Principal coordinates analysis (PCoA) performed on pairwise unweighted UniFrac distances in HFD-fed mice shows a strong antibiotic effect (PCoA1: 28%) and a strong similarity within donors and recipients (R) from the microbiota transfer experiment into germ-free mice (PCoA2: 16%). All mice were fed a HFD, each small dot is a mouse, and the most abundant bacterial genus are labeled and superimposed on the same PCoA plot. The size of the sphere representing a taxon is proportional to the mean relative abundance of the taxon across all samples.
B Alpha diversity represented by the Shannon index (n ≥ 5/group), *P = 0.03 and **P = 0.0001.
C Average relative abundance of the major genus in the cecum of each group of mice (n ≥ 5/group).
D, E Impact of antibiotics (ATB) on relative population of Lactococcus genus and Lachnospiraceae family in all mice (E) (n ≥ 10/group), *P = 0.0001.
F, G Body mass (F) and fasting blood glucose (G) in 16 week HFD-fed WT and NOD2−/− mice without (CON) or with ATB in the drinking water for the final 4 weeks of the HFD (n ≥ 5/group), *P = 0.04, **P = 0.0008, and #P = 0.004.
H, I Percentage change in fasting blood glucose (H) and AUC during GTTs (I) that was induced by ATB in HFD-fed WT and NOD2−/− mice (n ≥ 5/group), *P = 0.04 and **P = 0.005.
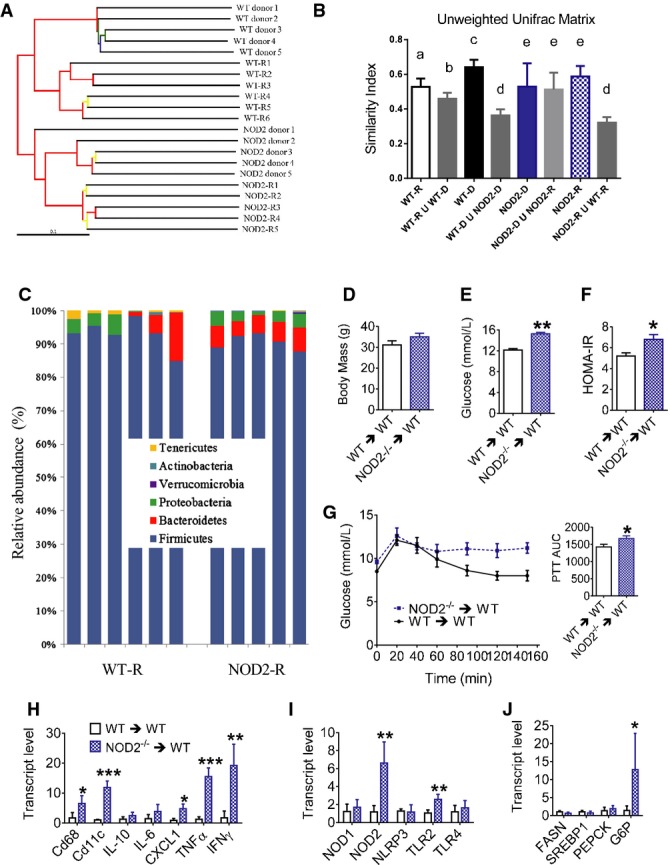
A Hierarchical cluster tree built using UPGMA (unweighted pair group method with arithmetic mean) based on the unweighted UniFrac distance matrix. Each branch represents a numbered mouse from each group of WT donor, WT-R (WT recipient, which are WT germ-free mice that received WT donor flora), NOD2−/− donor, or NOD2-R (NOD2 recipient, which are WT germ-free mice that received NOD2−/− donor flora). Branches in the UPGMA tree are colored according to their jackknife support: red, 75–100%; yellow, 50–75%; green, 25–50%; and blue, < 25% support.
B Calculation of the unweighted UniFrac matrix similarity index showed the level of successful transfer of the microbiome to recipient mice evidenced by results comparing the similarity within each group to the union (U) between different conditions. Conditions with different letters (a, b c, d, e) in the similarity index denote a statistical difference compared to all other conditions without the same letter, where the minimal statistical values for all comparisons are: aP = 0.01, bP = 0.04, cP = 0.004, dP = 0.0001, and eP = 0.002.
C Relative abundance of phyla in the cecum from each recipient mouse.
D Body mass in weight-matched HFD-fed WT-R (n = 5) and NOD2-R (n = 4) mice, 5 weeks after colonization of germ-free mice.
E, F Fasting blood glucose (E) and HOMA insulin resistance (IR) index (F) in weight-matched HFD-fed WT-R (n = 5) and NOD2-R (n = 4) mice, 5 weeks after colonization of germ-free mice, *P = 0.02 and **P = 0.0001.
G Blood glucose and quantification of the AUC during a PTT in HFD-fed WT-R (n = 7) and NOD2-R (n = 6) mice, *P = 0.01.
H, I Quantification of immune cell and inflammatory markers (H) and PRRs (I) in adipose tissue of weight-matched HFD-fed WT-R (n = 5) and NOD2-R (n = 4) mice, *P = 0.01, **P = 0.001, and ***P = 0.0001.
J Quantification of metabolic transcripts in the liver of weight-matched HFD-fed WT-R (n = 5) and NOD2-R (n = 4) mice, *P = 0.04.
References
-
- Amar J, Chabo C, Waget A, Klopp P, Vachoux C, Bermúdez-Humarán LG, Smirnova N, Bergé M, Sulpice T, Lahtinen S, et al. Intestinal mucosal adherence and translocation of commensal bacteria at the early onset of type 2 diabetes: molecular mechanisms and probiotic treatment. EMBO Mol Med. 2011;3:559–572. - PMC - PubMed
-
- Bäckhed F. Programming of Host Metabolism by the Gut Microbiota. Ann Nutr Metab. 2011;58:44–52. - PubMed
-
- Bäckhed F. Host responses to the human microbiome. Nutr Rev. 2012;70:S14–S17. - PubMed
-
- Barreau F, Madre C, Meinzer U, Berrebi D, Dussaillant M, Merlin F, Eckmann L, Karin M, Sterkers G, Bonacorsi S, et al. Nod2 regulates the host response towards microflora by modulating T cell function and epithelial permeability in mouse Peyer's patches. Gut. 2010;59:207–217. - PubMed
Publication types
MeSH terms
Substances
LinkOut - more resources
Full Text Sources
Other Literature Sources
Molecular Biology Databases
