

Overall response rate, progression-free survival, and overall survival with targeted and standard therapies in advanced non-small-cell lung cancer: US Food and Drug Administration trial-level and patient-level analyses
- PMID: 25667291
- PMCID: PMC4356710
- DOI: 10.1200/JCO.2014.59.0489
Overall response rate, progression-free survival, and overall survival with targeted and standard therapies in advanced non-small-cell lung cancer: US Food and Drug Administration trial-level and patient-level analyses
Abstract
Purpose: To conduct analyses exploring trial-level and patient-level associations between overall response rate (ORR), progression-free survival (PFS), and overall survival (OS) in advanced non-small-cell lung cancer (NSCLC) trials.
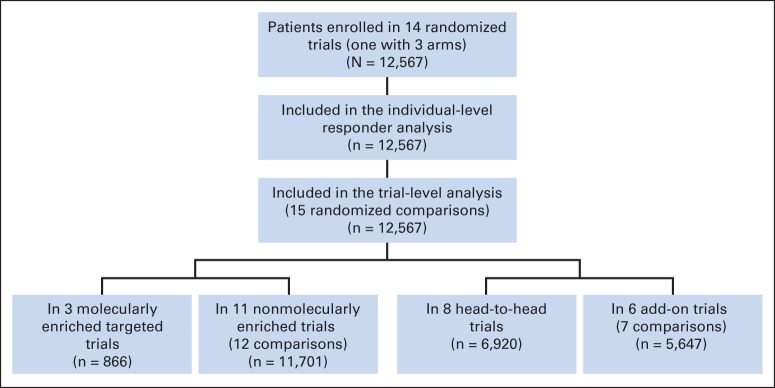
Methods: We identified 14 trials (N = 12,567) submitted to US Food and Drug Administration since 2003 of treatments for advanced NSCLC. Only randomized, active-controlled trials with more than 150 patients were included. Associations between trial-level PFS hazard ratio (HR), OS HR, and ORR odds ratio were analyzed using a weighted linear regression model. Patient-level responder analyses comparing PFS and OS between patients with and without an objective response were performed using pooled data from all studies.
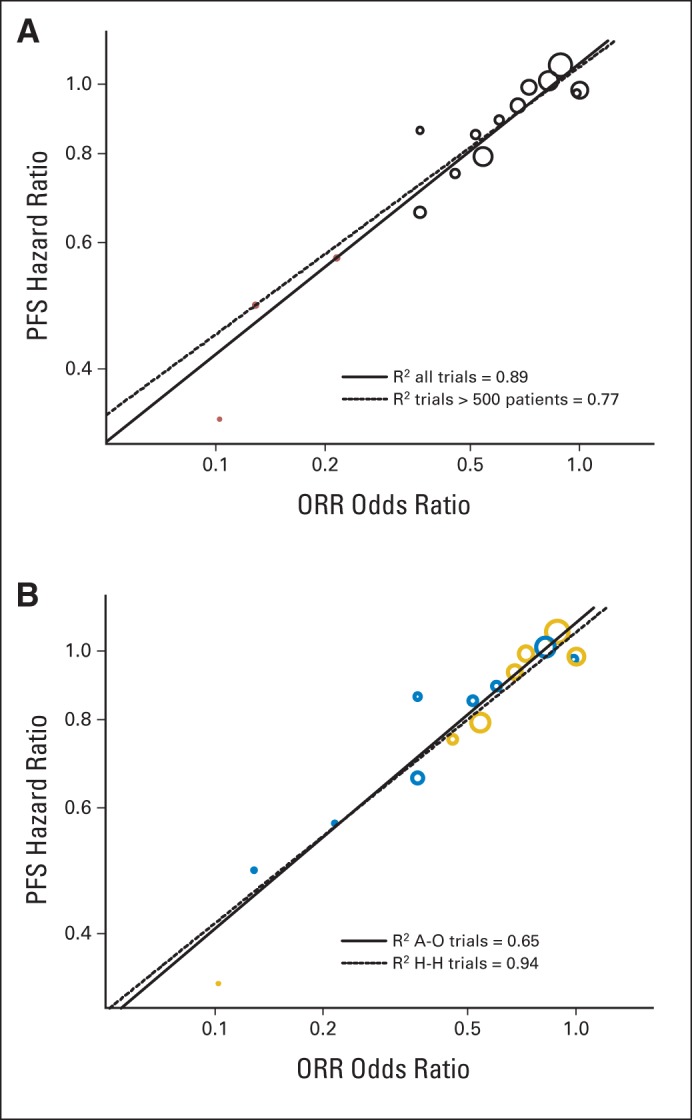
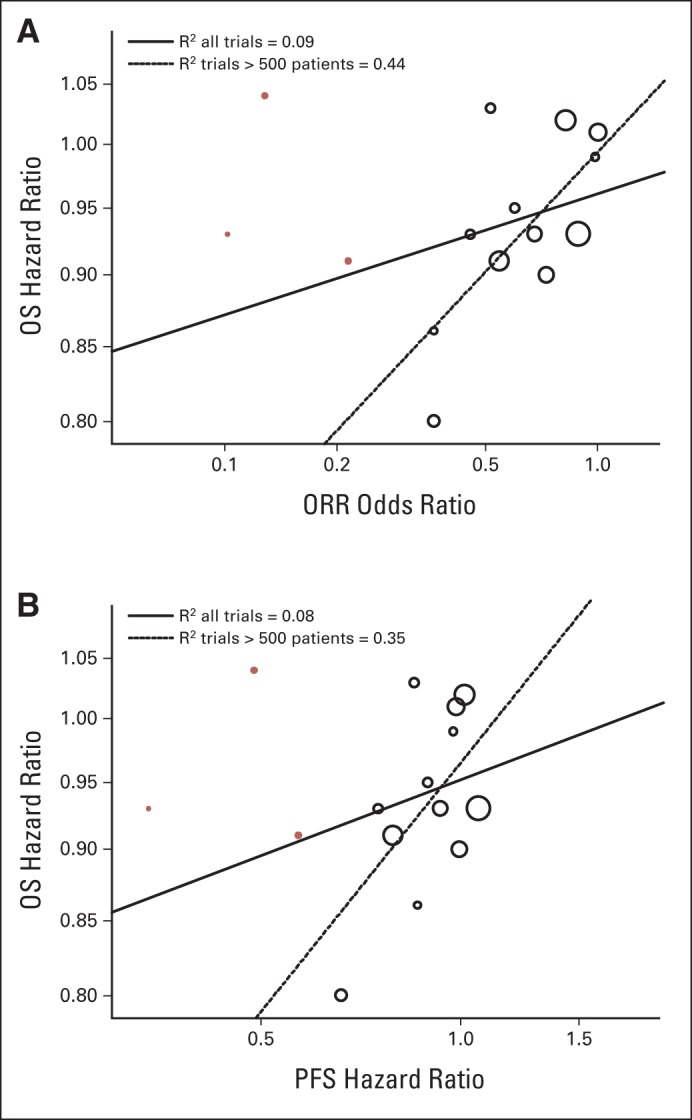
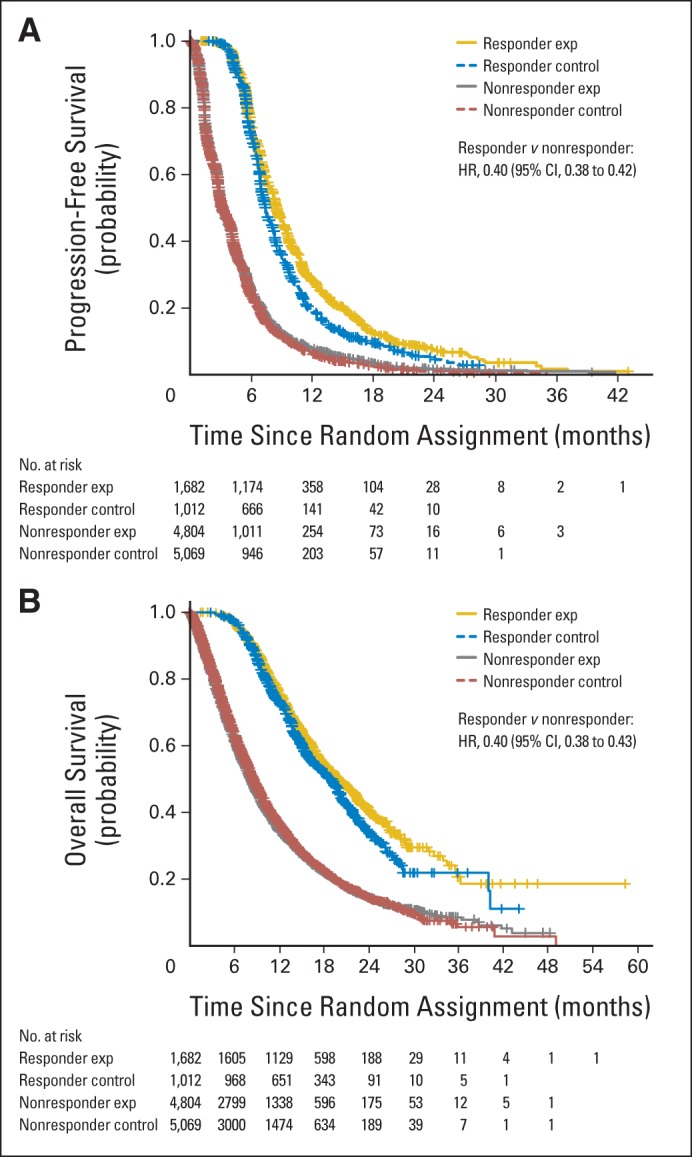
Results: In the trial-level analysis, the association between PFS and ORR was strong (R(2) = 0.89; 95% CI, 0.80 to 0.98). There was no association between OS and ORR (R(2) = 0.09; 95% CI, 0 to 0.33) and OS and PFS (R(2) = 0.08; 95% CI, 0 to 0.31). In the patient-level responder analyses, patients who achieved a response had better PFS and OS compared with nonresponders (PFS: HR, 0.40; 95% CI, 0.38 to 0.42; OS: HR, 0.40; 95% CI, 0.38 to 0.43).
Conclusion: On a trial level, there is a strong association between ORR and PFS. An association between ORR and OS and between PFS and OS was not established, possibly because of cross-over and longer survival after progression in the targeted therapy and first-line trials. The patient-level analysis showed that responders have a better PFS and OS compared with nonresponders. A therapy in advanced NSCLC with a large magnitude of effect on ORR may have a large PFS effect.
© 2015 by American Society of Clinical Oncology.
Conflict of interest statement
Authors' disclosures of potential conflicts of interest are found in the article online at
Figures
References
-
- Siegel R, Ma J, Zou Z, et al. Cancer statistics, 2014. CA Cancer J Clin. 2014;64:9–29. - PubMed
-
- Pao W, Girard N. New driver mutations in non-small-cell lung cancer. Lancet Oncol. 2011;12:175–180. - PubMed
-
- Khozin S, Blumenthal GM, Jiang X, et al. US Food and Drug Administration approval summary: Erlotinib for the first-line treatment of metastatic non-small cell lung cancer with epidermal growth factor receptor exon 19 deletions or exon 21 (L858R) substitution mutations. Oncologist. 2014;19:774–779. - PMC - PubMed
Publication types
MeSH terms
LinkOut - more resources
Full Text Sources
Other Literature Sources
Medical
