. 2015 May;21(9-10):1621-32.
doi: 10.1089/ten.TEA.2014.0115.

Osteogenic performance of donor-matched human adipose and bone marrow mesenchymal cells under dynamic culture

Affiliations

Osteogenic performance of donor-matched human adipose and bone marrow mesenchymal cells under dynamic culture

Wei Wu et al. Tissue Eng Part A. 2015 May.

Abstract

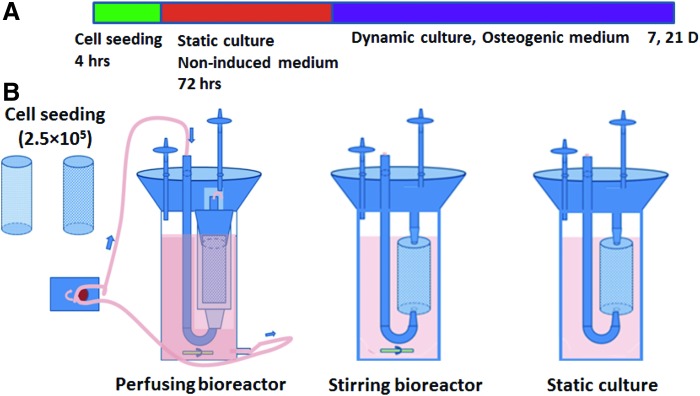
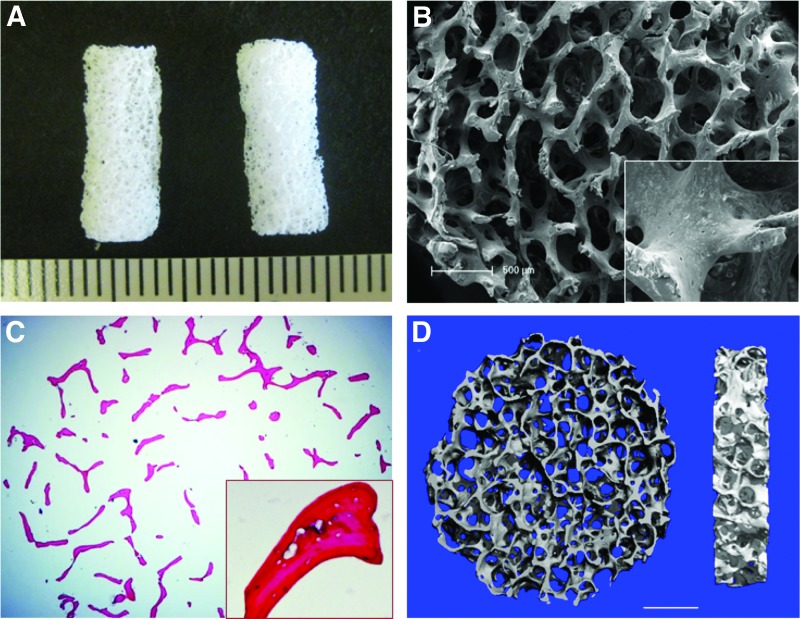
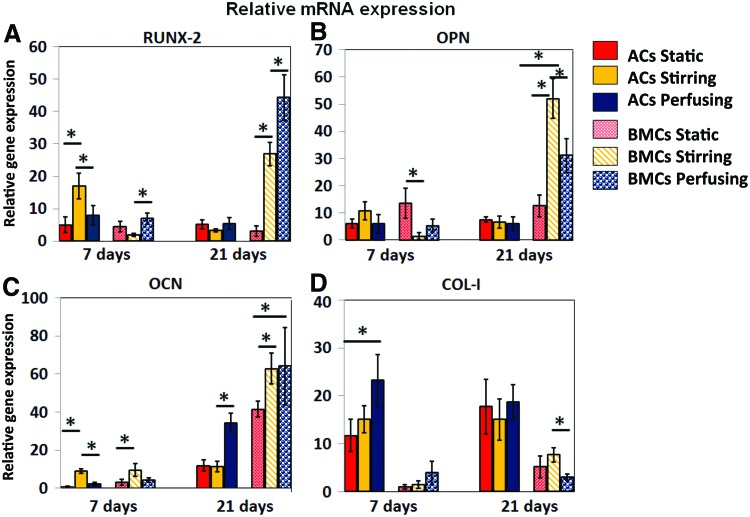
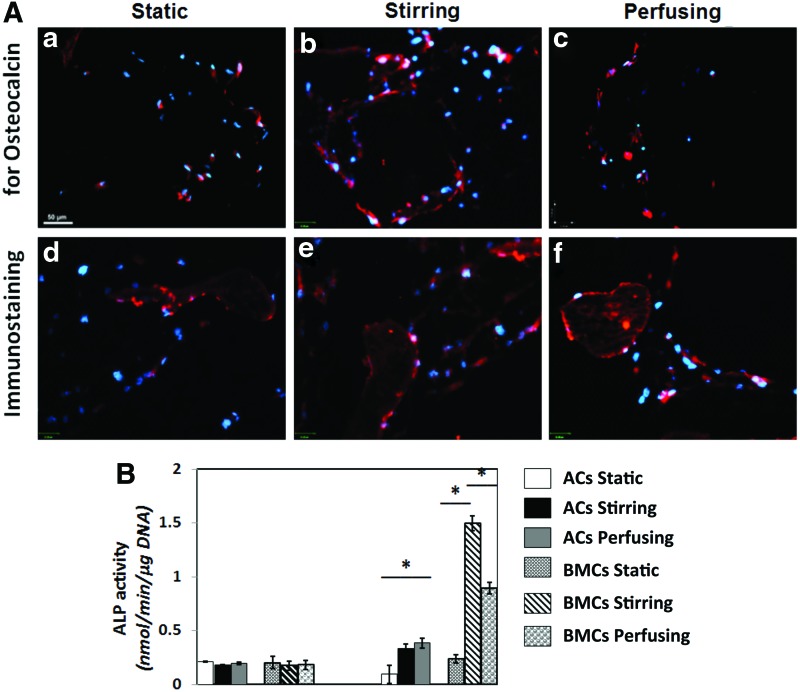
Adipose-derived mesenchymal cells (ACs) and bone marrow-derived mesenchymal cells (BMCs) have been widely used for bone regeneration and can be seeded on a variety of rigid scaffolds. However, to date, a direct comparison of mesenchymal cells (MC) harvested from different tissues from the same donor and cultured in identical osteogenic conditions has not been investigated. Indeed, it is unclear whether marrow-derived or fat-derived MC possess intrinsic differences in bone-forming capabilities, since within-patient comparisons have not been previously done. This study aims at comparing ACs and BMCs from three donors ranging in age from neonatal to adult. Matched cells from each donor were studied in three distinct bioreactor settings, to determine the best method to create a viable osseous engineered construct. Human ACs and BMCs were isolated from each donor, cultured, and seeded on decellularized porcine bone (DCB) constructs. The constructs were then subjected to either static or dynamic (stirring or perfusion) bioreactor culture conditions for 7-21 days. Afterward, the constructs were analyzed for cell adhesion and distribution and osteogenic differentiation. ACs demonstrated higher seeding efficiency than BMCs. However, static and dynamic culture significantly increased BMCs proliferation more than ACs. In all conditions, BMCs demonstrated stronger osteogenic activity as compared with ACs, through higher alkaline phosphatase activity and gene expression for various bony markers. Conversely, ACs expressed more collagen I, which is a nonspecific matrix molecule in most connective tissues. Overall, dynamic bioreactor culture conditions enhanced osteogenic gene expression in both ACs and BMCs. Scaffolds seeded with BMCs in dynamic stirring culture conditions exhibit the greatest osteogenic proliferation and function in vitro, proving that marrow-derived MC have superior bone-forming potential as compared with adipose-derived cells.


Figures

<b>FIG. 1.</b>
FIG. 1.
Schematics of the staged bioreactor operation. (A) Culturing procedure for all of the constructs. (B) Three different home-made bioreactors were used: A perfusion bioreactor was driven by peristaltic pump; the constructs were held in by silicon tubing, inserted into the plastic chamber, and underwent medium perfusion. Stirring bioreactors rely on stirring flow driven by a magnetic bar on the bottom. Constructs in static culture had no dynamic fluid flow. Color images available online at www.liebertpub.com/tea
<b>FIG. 2.</b>
FIG. 2.
Characterization of decellularized bone (DCB). (A) Gross appearance of cylindrical DCB scaffold. (B) Representative scanning electron microscope (SEM) micrographs of DCB show a highly interconnected and porous structure. The lacuna were empty after decellularization (inset). (C) Hematoxylin and eosin (H&E) staining of DCB shows complete removal of cells in matrices, and (D) micro-computed tomography (Micro-CT) demonstrates that the porosity of DCB is 91.10%±2.31% and pore sizes ranging from 250 to 400 μm (n=3), scale bar=1 mm. Color images available online at www.liebertpub.com/tea
<b>FIG. 3.</b>
FIG. 3.
Characterization of adipose-derived mesenchymal cells (ACs) and bone marrow-derived mesenchymal cells (BMCs) from the same donors (n=3). (A, B) Examination cellular morphology for ACs under a phase-contrast microscope at the first passage (10×). (C, D) Examination of mesenchymal cells (MCs) surface marker expression, including CD44, CD73, CD90, and CD105, by flow cytometry at the first cell passage from different groups, and percentage of positively stained cells from three different donors were shown in (E, * means p<0.05). Color images available online at www.liebertpub.com/tea
<b>FIG. 4.</b>
FIG. 4.
Characterization of cell attachment and cell seeding efficiency for constructs cultured at 24 h after cell seeding. SEM micrographs show cell spreading and flattening in both ACs (A) and BMCs (B) on the surface of trabeculae, scale bar=50 μm. DAPI staining shows more ACs (C) distributed in pores of scaffold than BMCs (D), scale bar=100 μm (E) DNA quantification shows that ACs were seeded with a higher efficiency than BMCs; values are mean±standard error, *p<0.05. Analysis was performed in triplicate, n=3. Color images available online at www.liebertpub.com/tea
<b>FIG. 5.</b>
FIG. 5.
Construct tissue formation after 7 days of culture. H&E staining of constructs was presented as lower magnification (a, d, g, j, m, p scale bar=500 μm) and higher magnification (b, e, h, k, n, q scale bar=200 μm). DAPI staining for cell nuclei was also shown for each construct (c, f, i, l, o, r scale bar=50 μm). Color images available online at www.liebertpub.com/tea
<b>FIG. 6.</b>
FIG. 6.
Construct tissue formation after 21 days of culture. H&E staining of constructs was presented as lower magnification (a, d, g, j, m, p scale bar=500 μm) and higher magnification (b, e, h, k, n, q scale bar=200 μm). DAPI staining for cell nuclei was also shown for each construct (c, f, i, l, o, r scale bar=50 μm). Color images available online at www.liebertpub.com/tea
<b>FIG. 7.</b>
FIG. 7.
Microstructure of constructs and DNA quantification for evaluation of cell proliferation. (A) SEM micrographs for ACs constructs (a–c) and BMCs constructs (d–f) after 7 days in culture. (B) SEM micrographs for ACs constructs (g–i) and BMCs constructs (j–l) after 21 days in culture. Scale bar=100 μm. (C) DNA quantification for constructs cultured for 7 days. (D) DNA quantification for constructs cultured for 21 days, indicating that both ACs and BMCs cultured with stirring bioreactors have the highest cellularization among all groups. Values represent mean±standard error, *p<0.05. Analysis was performed in triplicate, n=3.
<b>FIG. 8.</b>
FIG. 8.
The relative gene expression of osteogenic markers measured by real-time quantitative polymerase chain reaction (qPCR). The data shown represent the mean±SD (n=3) *p<0.05. (A) RUNX-2 gene expression, ACs in stirring culture, and BMCs in perfusion culture express more RUNX-2 after 7 days in culture; while BMCs in perfusion culture express more at day 21. (B) Osteopontin (OPN) gene expression, BMCs in static culture express more in 7 days; while BMCs in stirring culture express more at day 21. (C) OCN gene expression, ACs and BMCs in stirring culture express more at day 7; while ACs and BMCs in perfusion culture express more at day 21. (D) COL-I gene expression, ACs in perfusion culture express more in 7 days; while BMCs in stirring culture express more at day 21. Color images available online at www.liebertpub.com/tea
<b>FIG. 9.</b>
FIG. 9.
Immunofluorescence staining for osteocalcin (OCN) (A) in ACs constructs (a–c) and BMCs constructs (d–f) from different bioreactors. (scale bar=50 μm). (B) Measurement of alkaline phosphatase (ALP) activity ACs in perfusion culture and BMCs in stirring culture have more ALP activity at day 21. The value was presented as mean±standard deviation, *p<0.05. Color images available online at www.liebertpub.com/tea
<b>FIG. 10.</b>
FIG. 10.
Calcium deposition assay (A). The higher magnification images from micro-CT scanning showed small calcium deposition in extracellular matrices, which was indicated by circles (ACs constructs, a–c; BMCs, d–f). (B) The quantification of alizarin red staining; the values represent the ratio of absorbance of the constructs with nonseeded scaffolds and were presented as mean±standard deviation, *p<0.05. Blue color in figure 10 is the background of the image. Color images available online at www.liebertpub.com/tea

References

    1. Kao S.T., and Scott D.D.A review of bone substitutes. Oral Maxillofac Surg Clin North Am 19,513, 2007 - PubMed
    1. Bose S., Roy M., and Bandyopadhyay A.Recent advances in bone tissue engineering scaffolds. Trends Biotechnol 30,546, 2012 - PMC - PubMed
    1. Grayson W.L., Frohlich M., Yeager K., Bhumiratana S., Chan M.E., Cannizzaro C., et al. . Engineering anatomically shaped human bone grafts. Proc Natl Acad Sci U S A 107,3299, 2010 - PMC - PubMed
    1. E L.L., Xu L.L., Wu X., Wang D.S., Lv Y., Wang J.Z., et al. . The interactions between rat-adipose-derived stromal cells, recombinant human bone morphogenetic protein-2, and beta-tricalcium phosphate play an important role in bone tissue engineering. Tissue Eng Part A 16,2927, 2010 - PubMed
    1. Folgiero V., Migliano E., Tedesco M., Iacovelli S., Bon G., Torre M.L., et al. . Purification and characterization of adipose-derived stem cells from patients with lipoaspirate transplant. Cell Transplant 19,1225, 2010 - PubMed

Publication types

MeSH terms

LinkOut - more resources