Review
. 2015 May:46:1-30.
doi: 10.1016/j.preteyeres.2015.01.005. Epub 2015 Feb 7.

Vision from next generation sequencing: multi-dimensional genome-wide analysis for producing gene regulatory networks underlying retinal development, aging and disease

Affiliations
Review

Vision from next generation sequencing: multi-dimensional genome-wide analysis for producing gene regulatory networks underlying retinal development, aging and disease

Hyun-Jin Yang et al. Prog Retin Eye Res. 2015 May.

Abstract

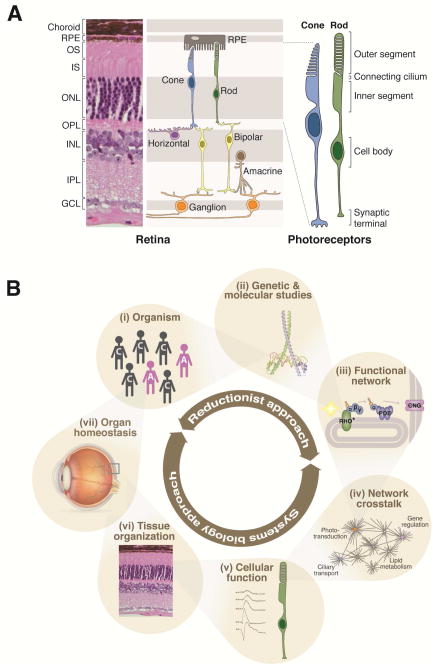
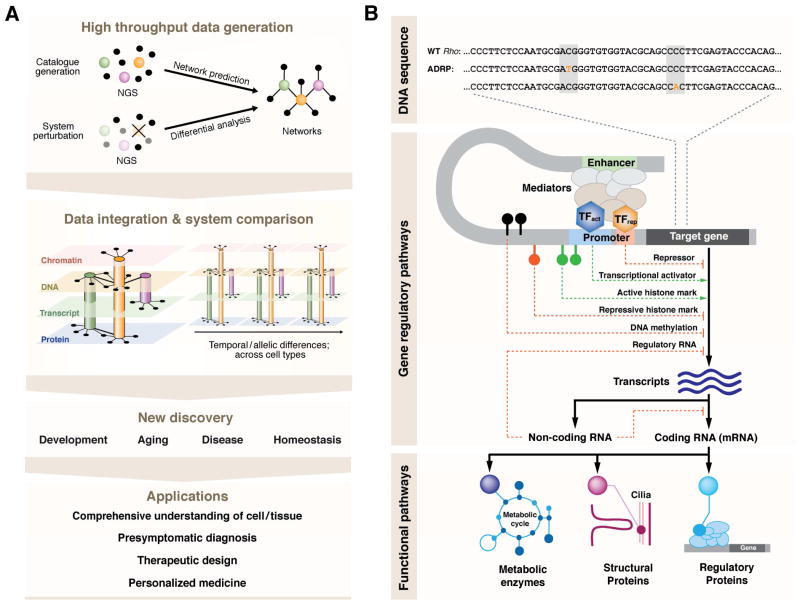
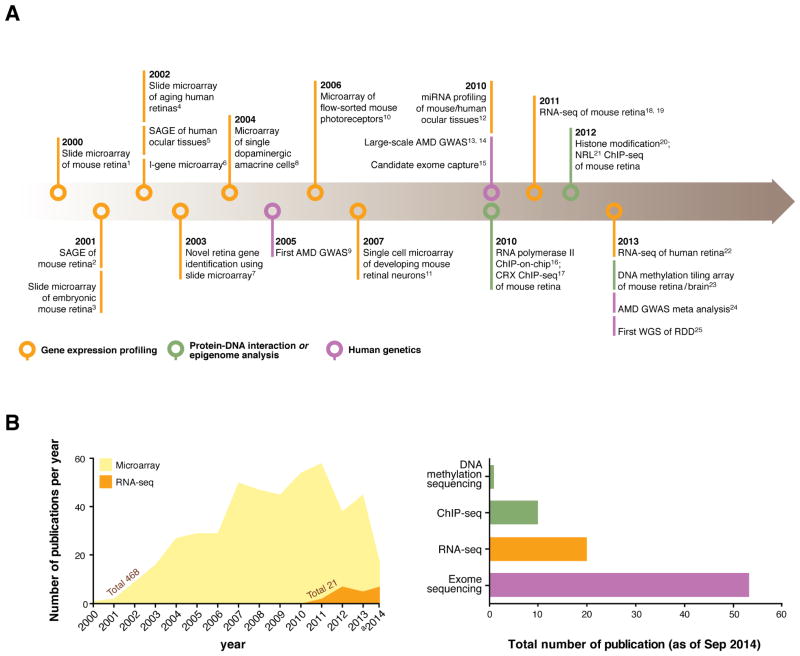
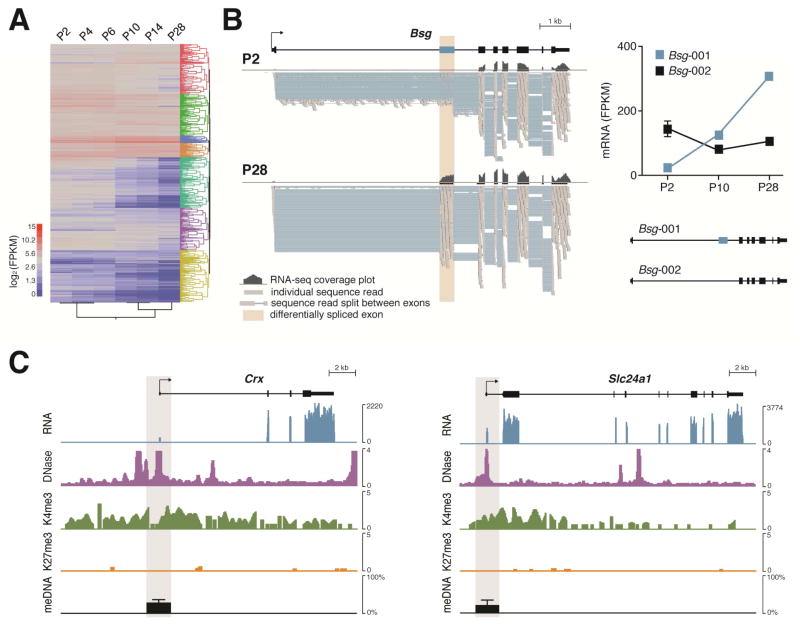
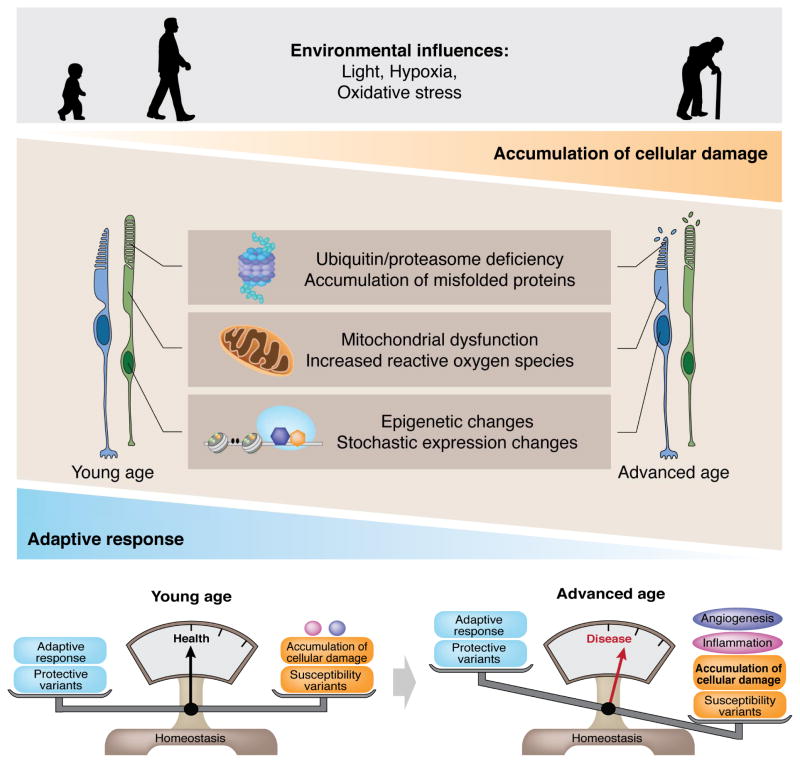
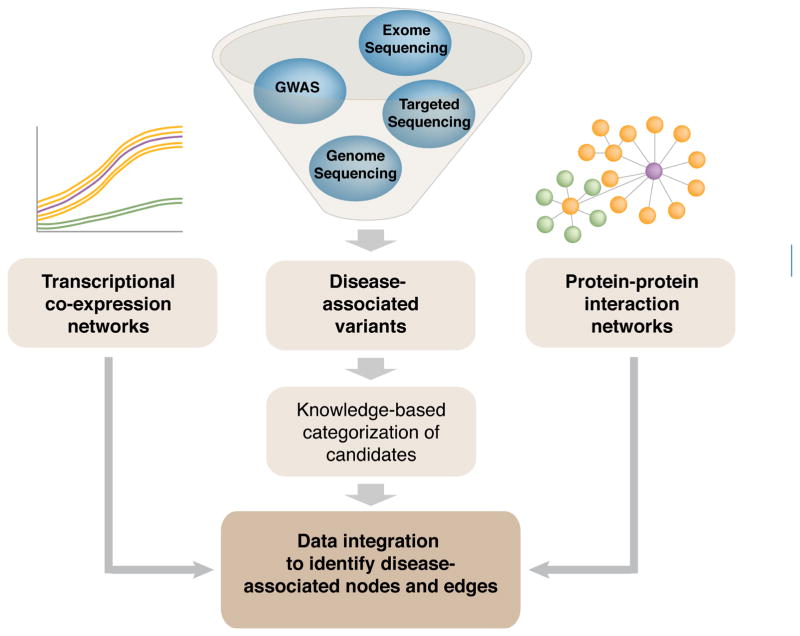
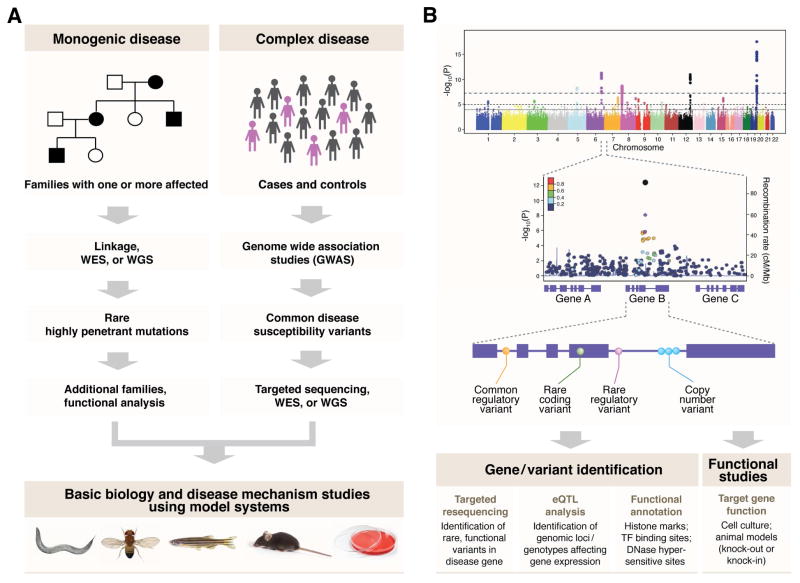
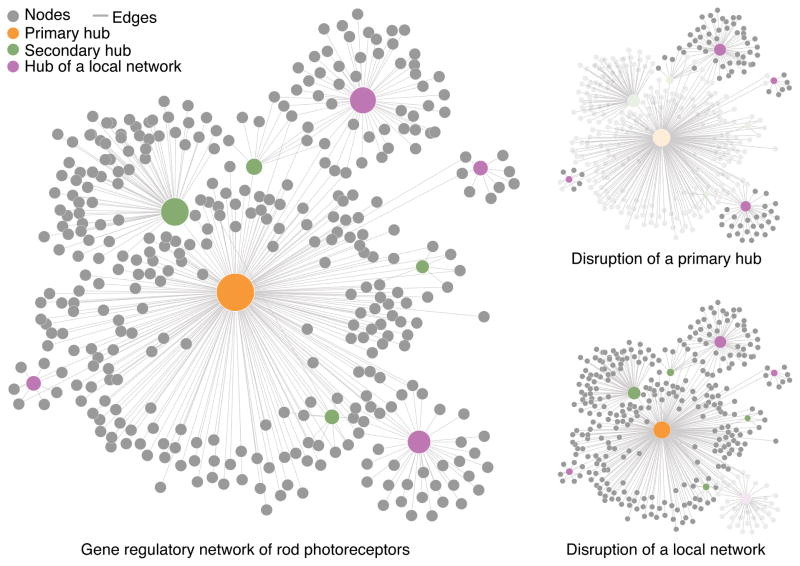
Genomics and genetics have invaded all aspects of biology and medicine, opening uncharted territory for scientific exploration. The definition of "gene" itself has become ambiguous, and the central dogma is continuously being revised and expanded. Computational biology and computational medicine are no longer intellectual domains of the chosen few. Next generation sequencing (NGS) technology, together with novel methods of pattern recognition and network analyses, has revolutionized the way we think about fundamental biological mechanisms and cellular pathways. In this review, we discuss NGS-based genome-wide approaches that can provide deeper insights into retinal development, aging and disease pathogenesis. We first focus on gene regulatory networks (GRNs) that govern the differentiation of retinal photoreceptors and modulate adaptive response during aging. Then, we discuss NGS technology in the context of retinal disease and develop a vision for therapies based on network biology. We should emphasize that basic strategies for network construction and analyses can be transported to any tissue or cell type. We believe that specific and uniform guidelines are required for generation of genome, transcriptome and epigenome data to facilitate comparative analysis and integration of multi-dimensional data sets, and for constructing networks underlying complex biological processes. As cellular homeostasis and organismal survival are dependent on gene-gene and gene-environment interactions, we believe that network-based biology will provide the foundation for deciphering disease mechanisms and discovering novel drug targets for retinal neurodegenerative diseases.

Keywords: ChIP-seq; Gene regulatory network; High throughput genomics; Inherited blindness; Macular degeneration; Network medicine; Pathway-based drug discovery; Personalized medicine; Photoreceptor; RNA-seq; Retinal degeneration; Systems biology; Whole exome sequencing; eQTL.


Figures

Figure 1
Figure 1
The mammalian retina and systems biology approaches. A, A representative retinal anatomy is shown by hematoxylin and eosin stained cross section of an adult mouse retina (left) and by schematics (center and right). In the mammalian retina, six main neuronal classes are organized into three nuclear layers [outer nuclear layer (ONL), inner nuclear layer (INL) and ganglion cell layer (GCL)] and form synaptic connections in two plexiform layers [outer plexiform layer (OPL) and inner plexiform layer (IPL)]. Cone and rod photoreceptors comprise the outer retina with their cell bodies situated in ONL and their inner and outer segments (IS and OS, respectively) located between ONL and the retinal pigment epithelium (RPE). RPE microvilli ensheath the outer segments, supporting phototransduction and photoreceptor survival. Photoreceptors transfer visual information through bipolar and retinal interneurons to ganglion cells. B, To date, population-based genetic analyses (i) and genetic and molecular studies of known genes (ii) have been major strategies in retinal research. Such studies have long been a major driving force in identifying retinal disease genes and in revealing the function of the disease genes and their functional or structural associates. The “bottom up” approaches have been undertaken to build functional networks (iii) that are critical for retinal function (e.g., phototransduction pathway) by compiling functional/structural relationships among individual molecules. Considering widespread crosstalk between functional and/or regulatory networks (iv), system-wide measurement of various biomolecules is critical in constructing a comprehensive map of complex intermolecular regulatory interactions. Systems biology approach thus complements the traditional reductionist methodologies. The recent advent of next generation sequencing technologies has enabled system-level assessment of various biological processes. Computational analysis of next generation sequencing and other types of high throughput data, ideally by integrating multiple data sets, allows a holistic approach to elucidate cellular function (v) as well as homeostasis of tissues (vi), organs (vii), and organisms (i). RHO, rhodopsin; PDE, phosphodiesterase; CNG, cyclic nucleotide gated channel.
Figure 2
Figure 2
Strategies and aims of system-wide, multi-dimensional data analysis. A, Networks of a tissue or a cell type of interest can be inferred from high throughput data analysis. Next generation sequencing (NGS) allows cataloguing cellular constituents at a steady state and functional interactions when combined with system perturbation and differential analysis. Molecular interactions are not confined to only one molecular type such as DNA, transcripts, chromatin marks or proteins. Thus, multi-dimensional data integration further refines the networks. In addition, comparative analysis is critical as discrete cells are subjected to temporal changes (i.e. development and aging) as well as interactions with neighboring cells and the microenvironment, which evoke physiological modulation of the tissue and eventually of the organism. These holistic approaches will lead to new discoveries of the biological systems and offer broad application. B, Cellular function is regulated at multiple levels. The DNA sequence contains the instructions of protein coding and gene regulation, and diverse gene regulatory mechanisms ensure expression of a unique set of components highly specialized for each cell identity. Intrinsic and/or exogenous damage to any level can lead to deleterious effects on function and survival of the system. TFact, transcription activator; TFrep, transcription repressor.
Figure 3
Figure 3
Timeline of genome-wide studies of the retina biology and disease pathogenesis. The advent of genome-scale profiling technologies has been a critical step for systems biology approaches. A, From the pioneering high throughput transcript analysis, such as the initial application of microarray and serial analysis of gene expression (SAGE) to whole genome sequencing, an ever-growing number of genome-wide studies have advanced our knowledge about healthy retina and disease pathogenesis. Highlights of such innovative genome-scale studies were selected and presented chronologically. B, For more than a decade, microarray has been a widely used methodology of choice for gene expression profiling, yielding a substantial number of publications each year. RNA-seq, deep sequencing of cDNA using NGS technology, is becoming more accessible and affordable and thus expected to be applied more widely. In addition to transcriptome analysis, NGS is applicable to a variety of other conventional research techniques and has already generated numerous data sets surveying whole exomes for genetic variation (whole exome sequencing), transcription factor targetome (ChIP-seq) and epigenome (ChIP-seq for histone modifications and various DNA methylome sequencing methodologies). 1(Livesey et al., 2000), 2(Blackshaw et al., 2001), 3(Mu et al., 2001), 4(Yoshida et al., 2002), 5(Sharon et al., 2002), 6(Farjo et al., 2002), 7(Chowers et al., 2003b), 8(Gustincich et al., 2004), 9(Klein et al., 2005), 10(Akimoto et al., 2006), 11(Trimarchi et al., 2007), 12(Arora et al., 2010; Hackler et al., 2010; Karali et al., 2010, Wang, 2010 #304), 13(Chen et al., 2010b), 14(Neale et al., 2010), 15(Otto et al., 2010), 16(Tummala et al., 2010), 17(Corbo et al., 2010), 18(Grant et al., 2011), 19(Brooks et al., 2011; Mustafi et al., 2011), 20(Popova et al., 2012), 21(Hao et al., 2012), 22(Farkas et al., 2013), 23(Oliver et al., 2013b), 24(Fritsche et al., 2013), 25(Nishiguchi et al., 2013), a number of publications until September 2014.
Figure 4
Figure 4
Cell-type specific system-level analysis. A, Heat map of time course RNA-seq data generated from isolated, developing (P2 to P14) and mature (P28) mouse rod photoreceptors. Dynamic gene regulation during rod photoreceptor maturation and clusters of genes with similar temporal expression patterns are apparent. Heat map was generated based on log2FPKM, and individual co-expression clusters were highlighted with different colors in the dendogram. FPKM, fragments per kilobase of exon per million reads. B, Transcript-level analysis of RNA-seq data enables detection of complex gene regulatory programs such as distinct splicing events during development. Alternative splicing of Bsg (basigin) gene during rod photoreceptor development is shown as an example. Coverage plots (dark grey histogram) and read alignments (grey blocks indicating individual sequence reads with thin blue horizontal lines connecting portions of sequence reads that are split between exons) show differential inclusion of the second exon (brown shade) in P2 and P28 rod photoreceptors. Expression level of each splice variant during rod development is plotted and shown on the right. C, System-level profiling of diverse chromatin signatures, including chromatin accessibility [DNase-seq (DNase I hypersensitivity sequencing)], active and repressive promoter histone modifications (H3K4me3 and H3K27me3, respectively; mini-ChIP-seq) and DNA methylation (bisulfite sequencing). Application of genome-wide analysis of chromatin states used to be limited to in vitro samples and pooled tissues of heterogeneous cell types. Bisulfite sequencing and ChIP-seq have now been miniaturized for flow-sorted single type of neurons, which are available in small amounts. Shown are active gene expression and hallmark of active chromatin state of two select photoreceptor-specific genes, Crx and Slc24a1, in P28 flow-sorted rod photoreceptors. Scale on y-axis of RNA, DNase, K4me3 and K27me3 tracks indicates RPM (reads per million reads). Average percent 5-methylcytosine (meDNA) within promoter (±1 kb from the transcription start site, highlighted with a grey shade) was plotted as a bar graph.
Figure 5
Figure 5
Interface between aging and disease. The environment influences photoreceptor homeostasis throughout life. The cell adaptive response helps maintain a balanced homeostasis. As the adaptive response becomes insufficient to overcome “insults” to the system, damage accumulates in aging photoreceptors. Major metabolic failure is observed for the ubiquitin-proteasome system and mitochondria. Epigenetic changes and stochastic changes in gene expression combined with the presence of susceptibility variants, eventually tilt the equilibrium towards the disease state. At which point, inflammation and angiogenesis become pathologic, further aggravating disease manifestations.
Figure 6
Figure 6
Integration of multi-level data sets for system-level understanding. Simultaneous analysis of genomics, transcriptomics and proteomics data can provide a comprehensive multidimensional view of the system and can help identify pathways and networks that are specific to development and disease. This can lead to better understanding of the biology as well as to identification of disease associated nodes, which can be potential drug targets (e.g., hub depicted as a purple node in the example network).
Figure 7
Figure 7
General recommendations for genetic analysis of monogenic and complex diseases using next-generation approaches. A. Families with a monogenic (i.e., Mendelian) disease, even those with a small number of individuals, can be analyzed by whole exome or genome sequencing. In case of identification of mutation(s) in a novel gene, additional validation is required, including genetic analysis of more families/patients as well as functional analysis using animal models to understand the role in disease causation. For complex diseases, genome wide association study is performed on a large number of samples including patients and population-matched controls, to identify common susceptibility variants associated with the disease. Targeted sequencing, whole exome or genome sequencing can be applied to identify the causal variant at the susceptibility locus. Finally, multiple molecular genetic and cellular assays as well as studies in animal models are required to identify functional variants underlying trait association. WES, whole exome sequencing; WGS, whole genome sequencing, GWAS, genome wide association study. B. Schematic representation of follow-up on a GWAS hit to identify the causal gene/variant. Causal variants could be common regulatory variants, rare coding variants or copy number variants. Targeted sequencing around the associated locus can help identify the causal variant. Generally, more than one candidate gene is found at an associated locus, and eQTL analysis in disease relevant tissues can help identify the specific genotypes affecting gene expression within the causal gene. Additional functional annotation, including histone modifications, transcription factor binding sites and DNase I hypersensitivity sites can also help in identifying the causal gene. Ultimately, a high throughput functional assay in animal and/or cell-based models is highly recommended to understand the role of the gene in disease pathophysiology. cM/Mb, centimorgan (cM) per megabase pair (Mb); eQTL, expression quantitative trait locus, TF, transcription factor.
Figure 8
Figure 8
Model of multi-dimensional network of photoreceptors. Networks consist of nodes and edges, representing cellular components (genes, transcripts, proteins, etc.) and their interactions, respectively. The nodes with the greatest number of interactions constitute primary hubs. Secondary hubs themselves are the interacting partners of primary hubs and simultaneously connect with many other nodes, thereby partially mediating the function of the primary hubs. Local sub-networks are also prevalent. Perturbation of primary or secondary hubs of the network likely poses detrimental impact to the system, while perturbation of a more locally confined network or a node with few interacting partners may not exert substantial effect on the system integrity. Identification of commonly affected networks in diverse retinal diseases will allow the better drug design.

References

    1. Adli M, Zhu J, Bernstein BE. Genome-wide chromatin maps derived from limited numbers of hematopoietic progenitors. Nat Methods. 2010;7:615–618. - PMC - PubMed
    1. Agathocleous M, Harris WA. From progenitors to differentiated cells in the vertebrate retina. Annu Rev Cell Dev Biol. 2009;25:45–69. - PubMed
    1. Akimoto M, Cheng H, Zhu D, Brzezinski JA, Khanna R, Filippova E, Oh EC, Jing Y, Linares JL, Brooks M, Zareparsi S, Mears AJ, Hero A, Glaser T, Swaroop A. Targeting of GFP to newborn rods by Nrl promoter and temporal expression profiling of flow-sorted photoreceptors. Proc Natl Acad Sci U S A. 2006;103:3890–3895. - PMC - PubMed
    1. Allikmets R. Further evidence for an association of ABCR alleles with age-related macular degeneration. The International ABCR Screening Consortium. Am J Hum Genet. 2000;67:487–491. - PMC - PubMed
    1. Arora A, Guduric-Fuchs J, Harwood L, Dellett M, Cogliati T, Simpson DA. Prediction of microRNAs affecting mRNA expression during retinal development. BMC Dev Biol. 2010;10:1. - PMC - PubMed

Publication types

MeSH terms