

Transcriptome analysis of Arabidopsis GCR1 mutant reveals its roles in stress, hormones, secondary metabolism and phosphate starvation
- PMID: 25668726
- PMCID: PMC4357605
- DOI: 10.1371/journal.pone.0117819
Transcriptome analysis of Arabidopsis GCR1 mutant reveals its roles in stress, hormones, secondary metabolism and phosphate starvation
Erratum in
-
Correction: Transcriptome analysis of Arabidopsis GCR1 mutant reveals its roles in stress, hormones, secondary metabolism and phosphate starvation.PLoS One. 2015 Mar 19;10(3):e0122423. doi: 10.1371/journal.pone.0122423. eCollection 2015. PLoS One. 2015. PMID: 25789865 Free PMC article. No abstract available.
Abstract
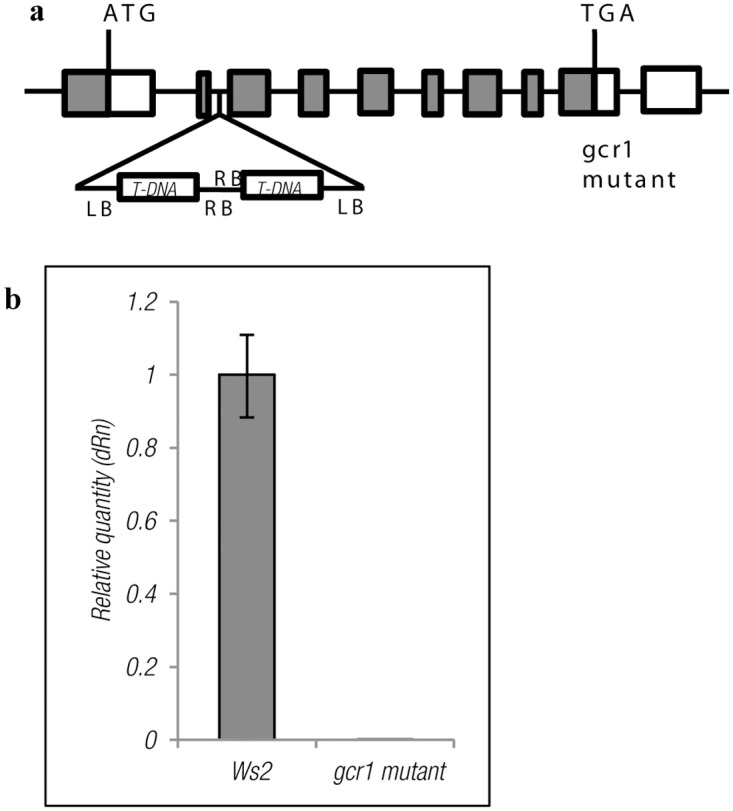
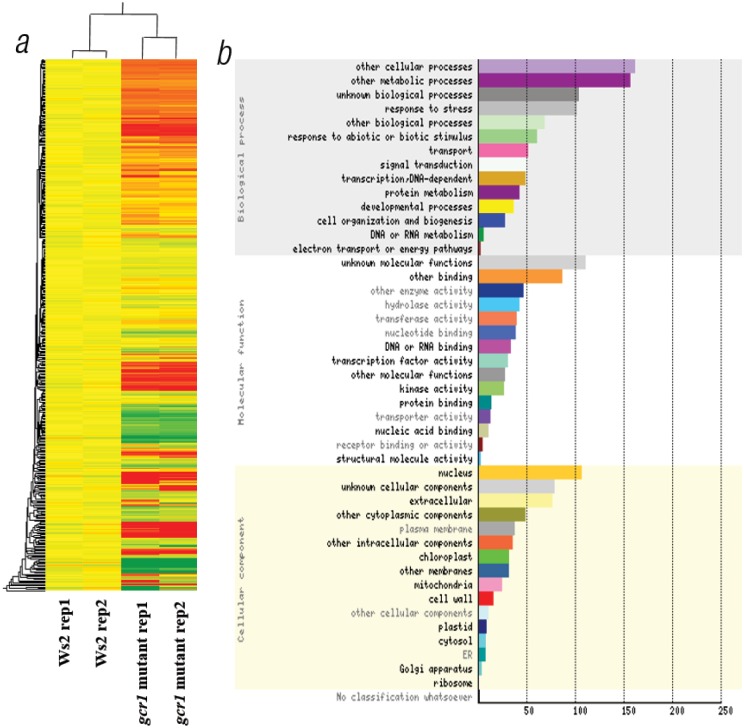
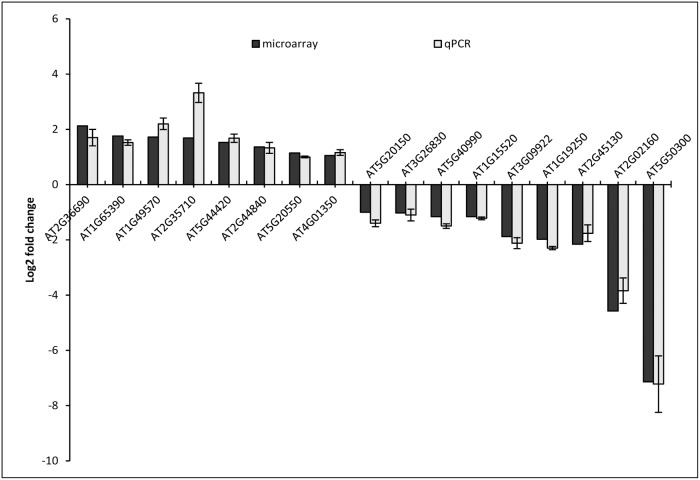
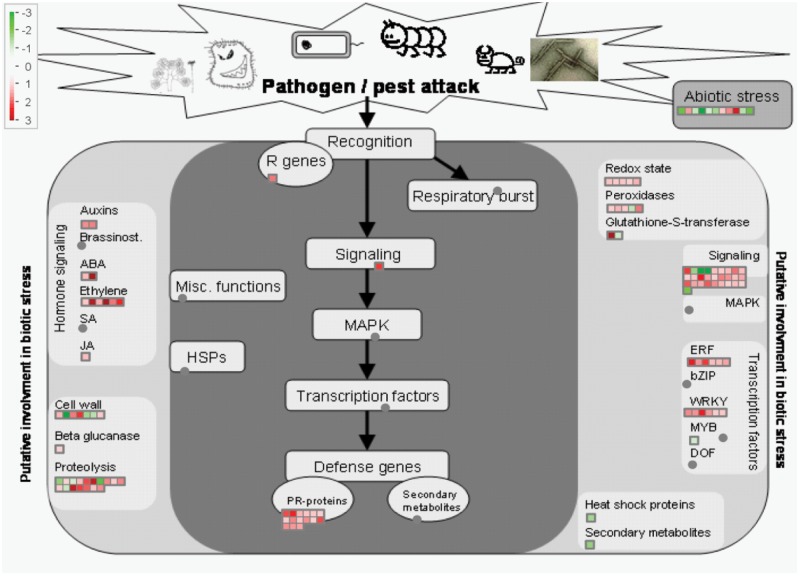
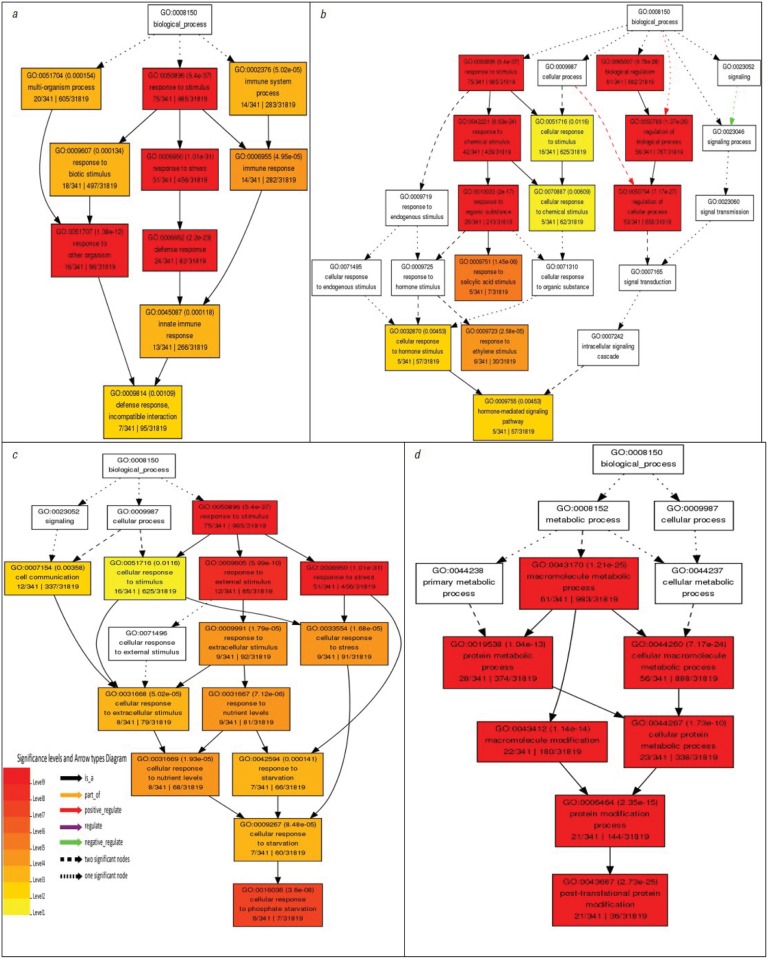
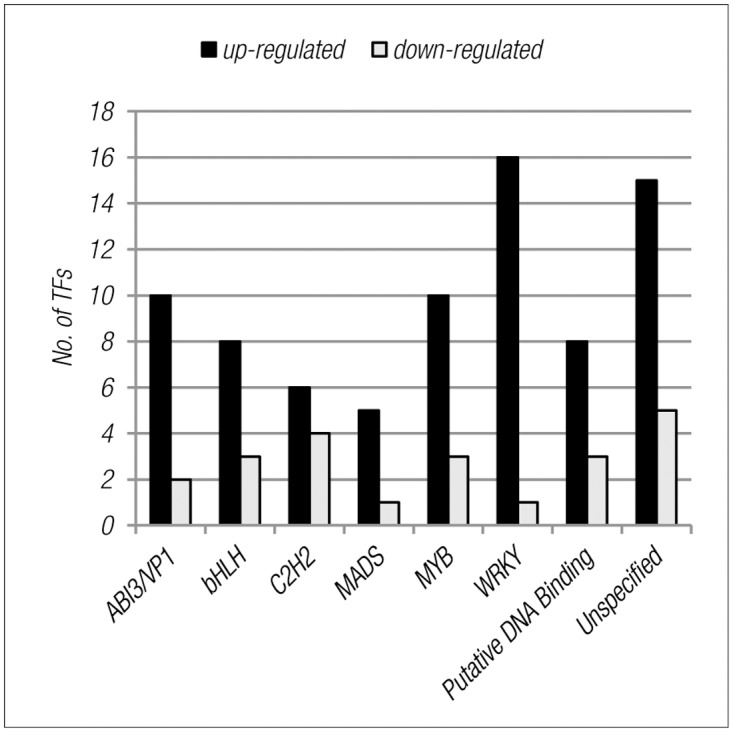
The controversy over the existence or the need for G-protein coupled receptors (GPCRs) in plant G-protein signalling has overshadowed a more fundamental quest for the role of AtGCR1, the most studied and often considered the best candidate for GPCR in plants. Our whole transcriptome microarray analysis of the GCR1-knock-out mutant (gcr1-5) in Arabidopsis thaliana revealed 350 differentially expressed genes spanning all chromosomes. Many of them were hitherto unknown in the context of GCR1 or G-protein signalling, such as in phosphate starvation, storage compound and fatty acid biosynthesis, cell fate, etc. We also found some GCR1-responsive genes/processes that are reported to be regulated by heterotrimeric G-proteins, such as biotic and abiotic stress, hormone response and secondary metabolism. Thus, GCR1 could have G-protein-mediated as well as independent roles and regardless of whether it works as a GPCR, further analysis of the organism-wide role of GCR1 has a significance of its own.
Conflict of interest statement
Figures
References
-
- Temple BRS, Jones AM (2007) The Plant Heterotrimeric G-Protein Complex. Annual Review of Plant Biology 58: 249–266. - PubMed
-
- Josefsson L-G, Rask L (1997) Cloning of a putative G-protein-coupled receptor from Arabidopsis thaliana. European Journal of Biochemistry 249: 415–420. - PubMed
-
- Plakidou-Dymock S, Dymock D, Hooley R (1998) A higher plant seven-transmembrane receptor that influences sensitivity to cytokinins. Current Biology 8: 315–324. - PubMed
-
- Kanyuka K, Couch D, Hooley R (2001) A higher plant seven-transmembrane receptor that influences sensitivity to cytokinins. Current Biology 11: 535.
Publication types
MeSH terms
Substances
Associated data
- Actions
- Actions
- Actions
LinkOut - more resources
Full Text Sources
Other Literature Sources
Medical
Molecular Biology Databases
