. 2015 Feb 10:4:e05178.
doi: 10.7554/eLife.05178.

Intercellular propagation of extracellular signal-regulated kinase activation revealed by in vivo imaging of mouse skin

Affiliations

Intercellular propagation of extracellular signal-regulated kinase activation revealed by in vivo imaging of mouse skin

Toru Hiratsuka et al. Elife. .

Abstract

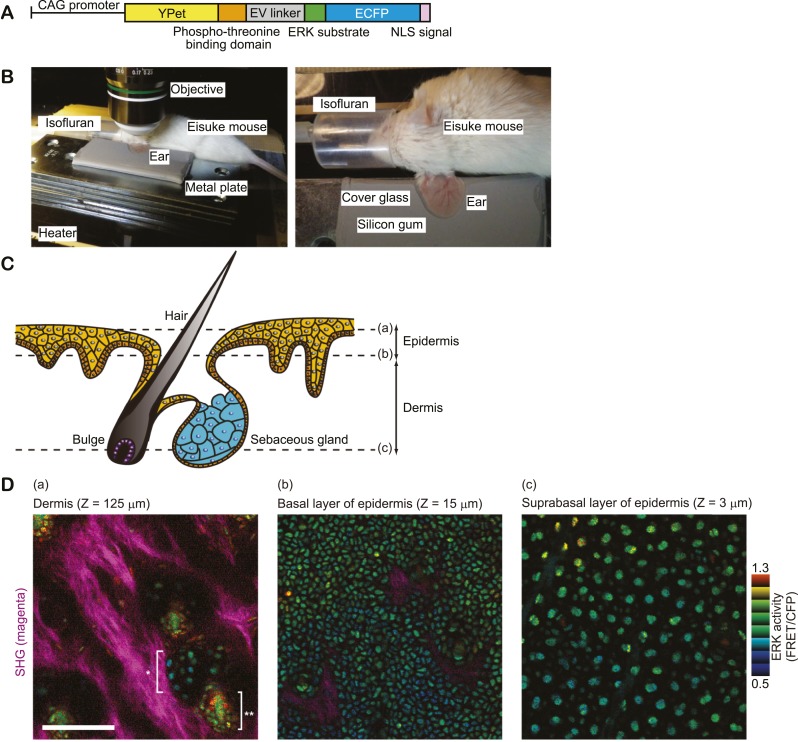
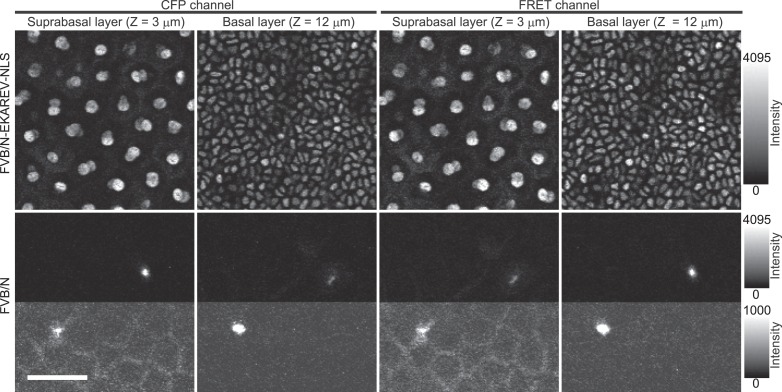
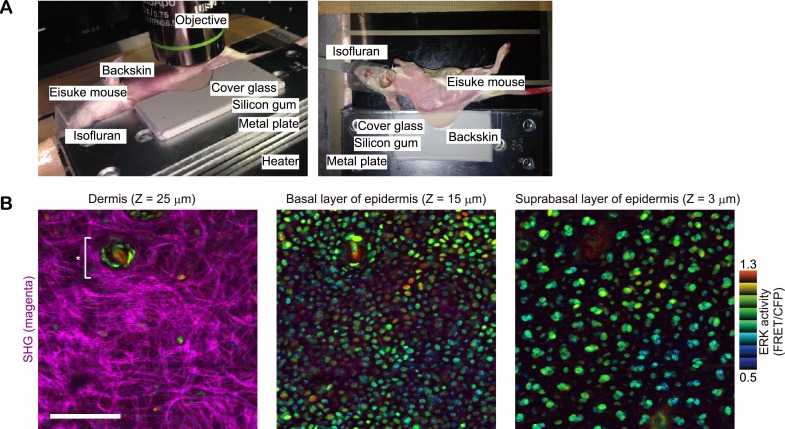
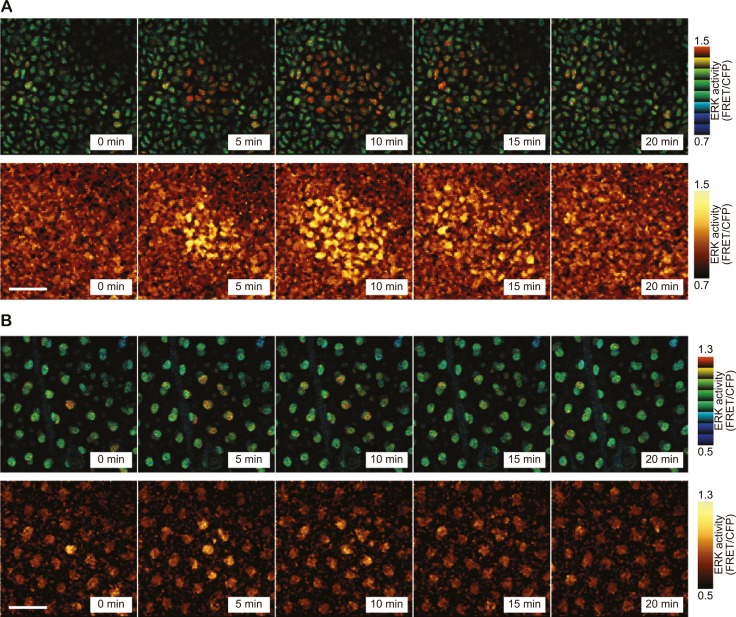
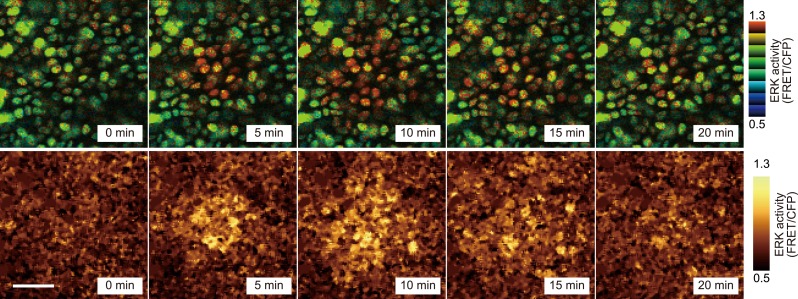
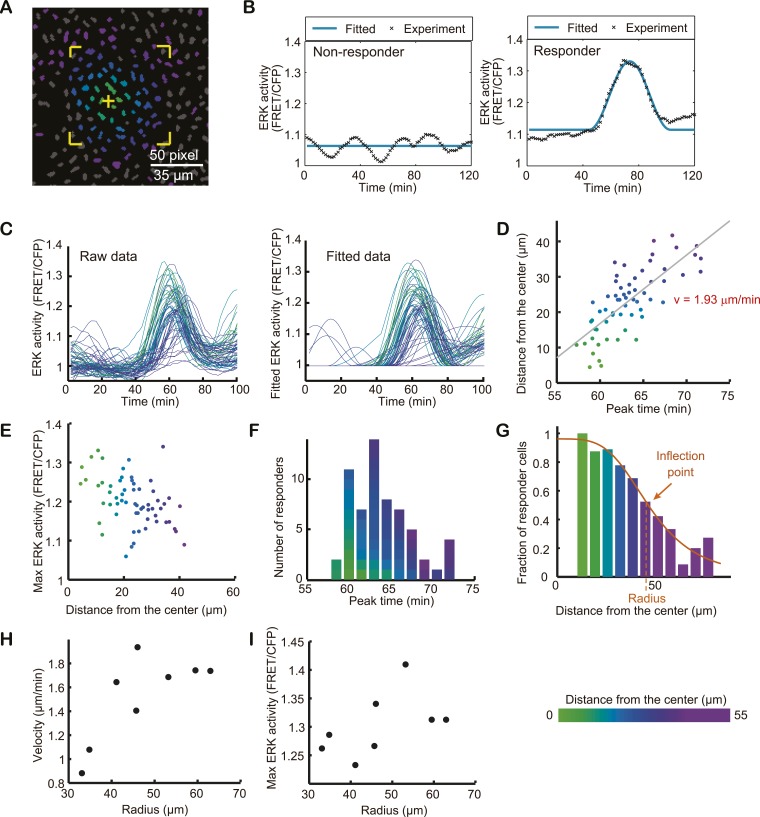
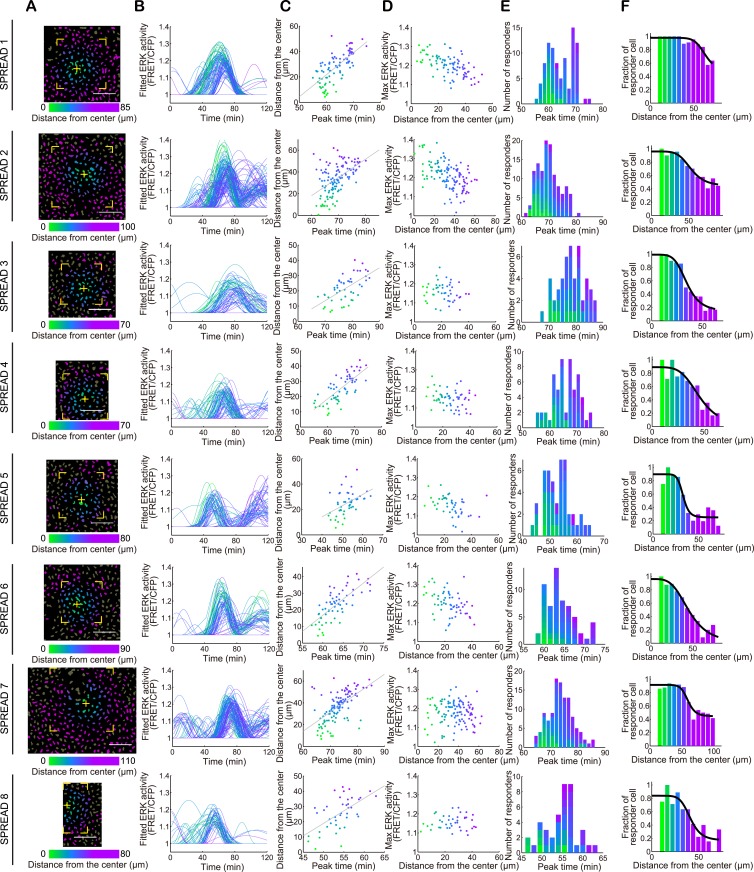
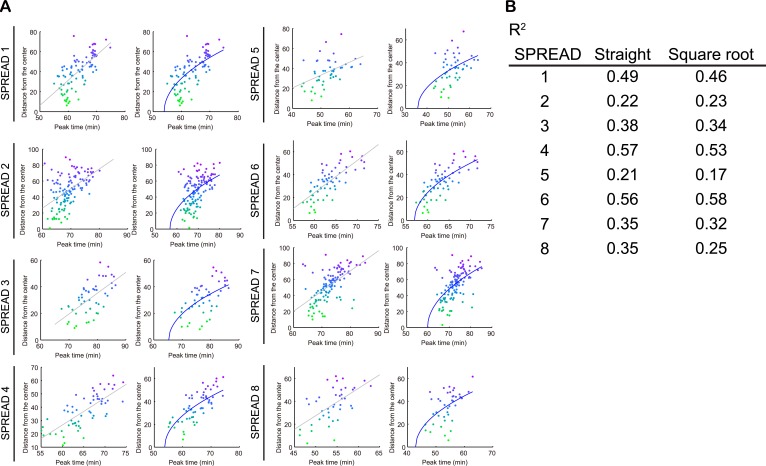
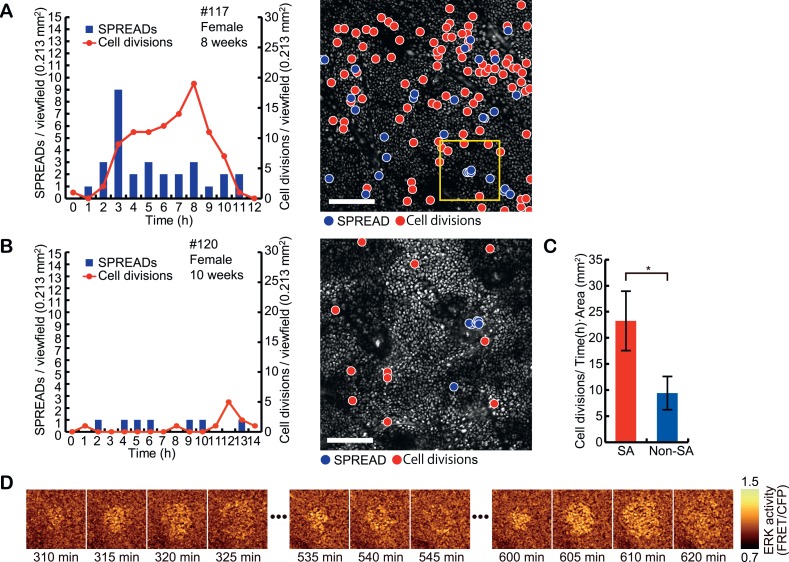
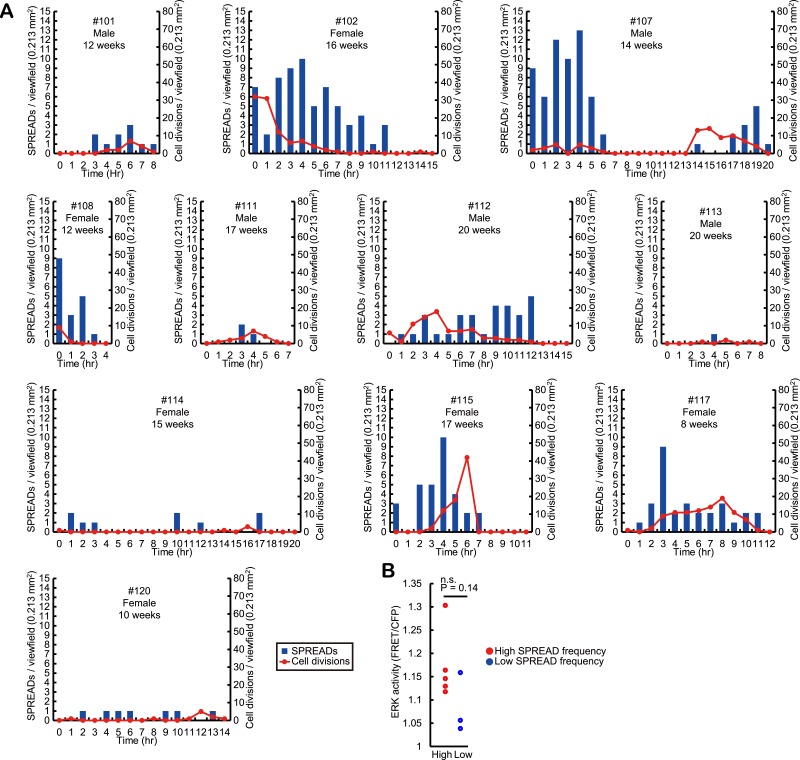
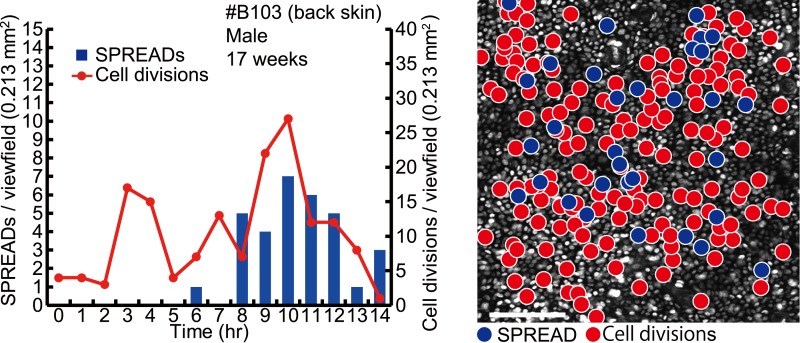
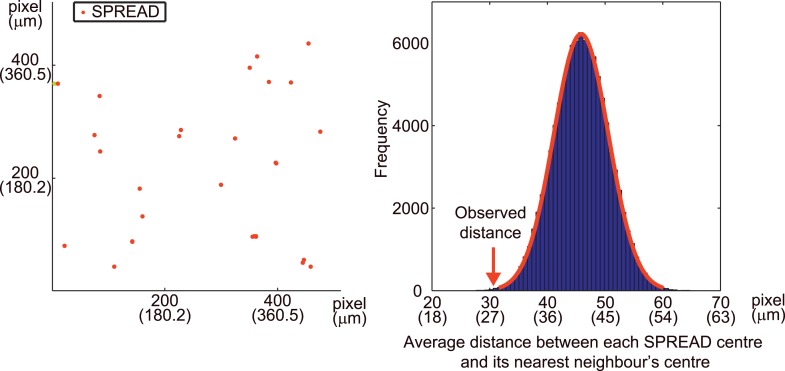
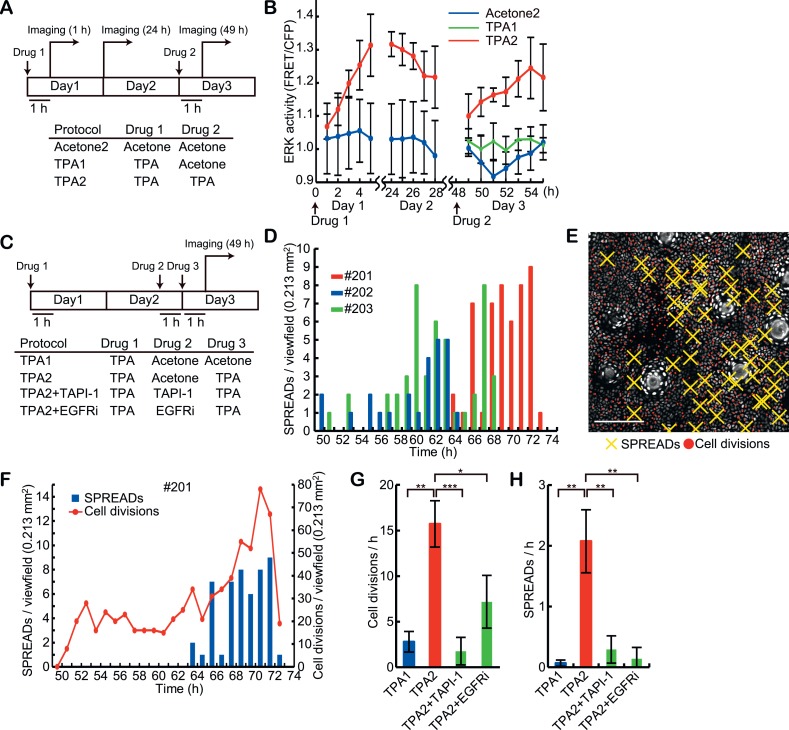
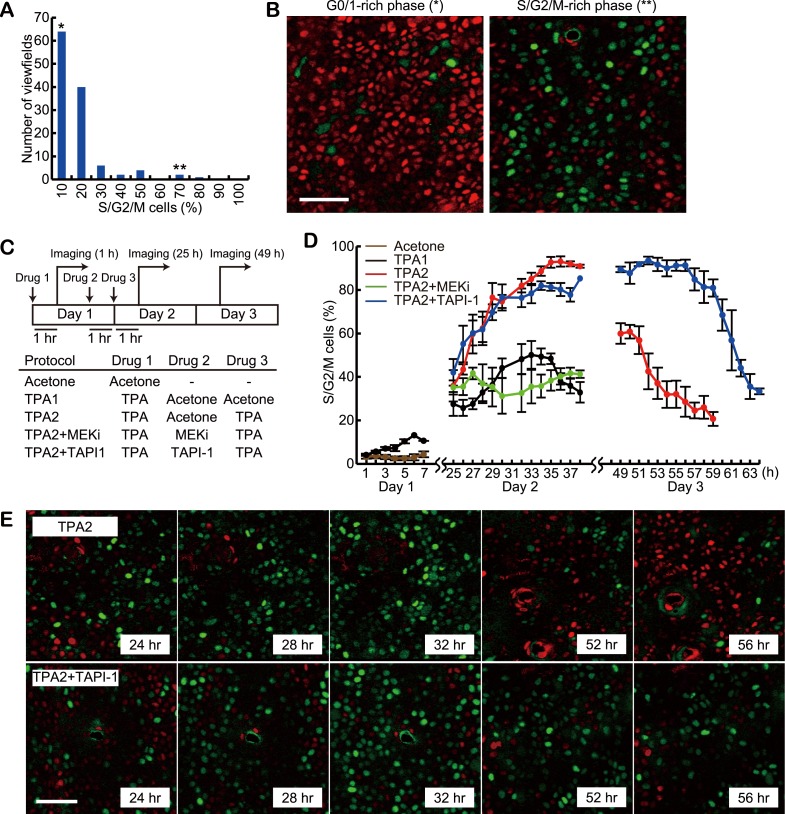
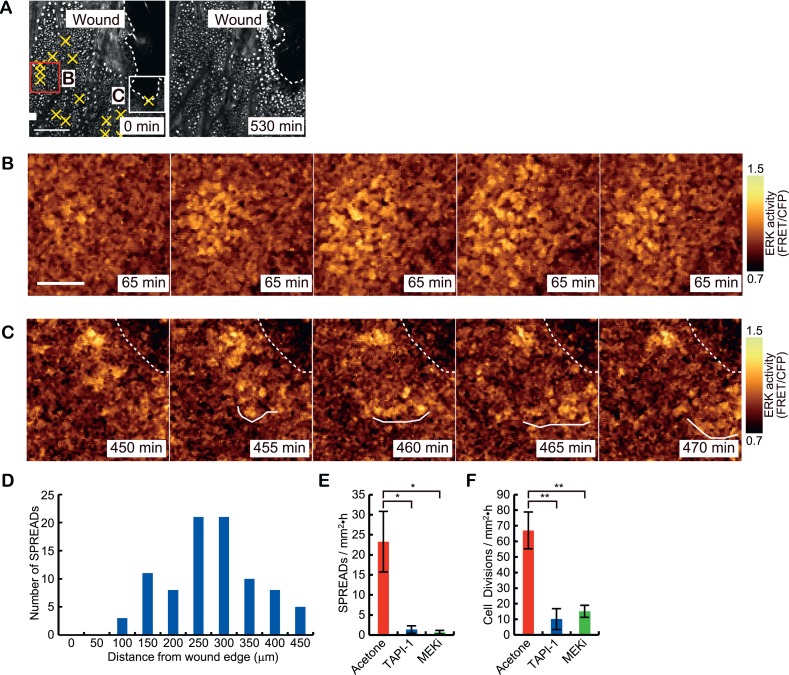
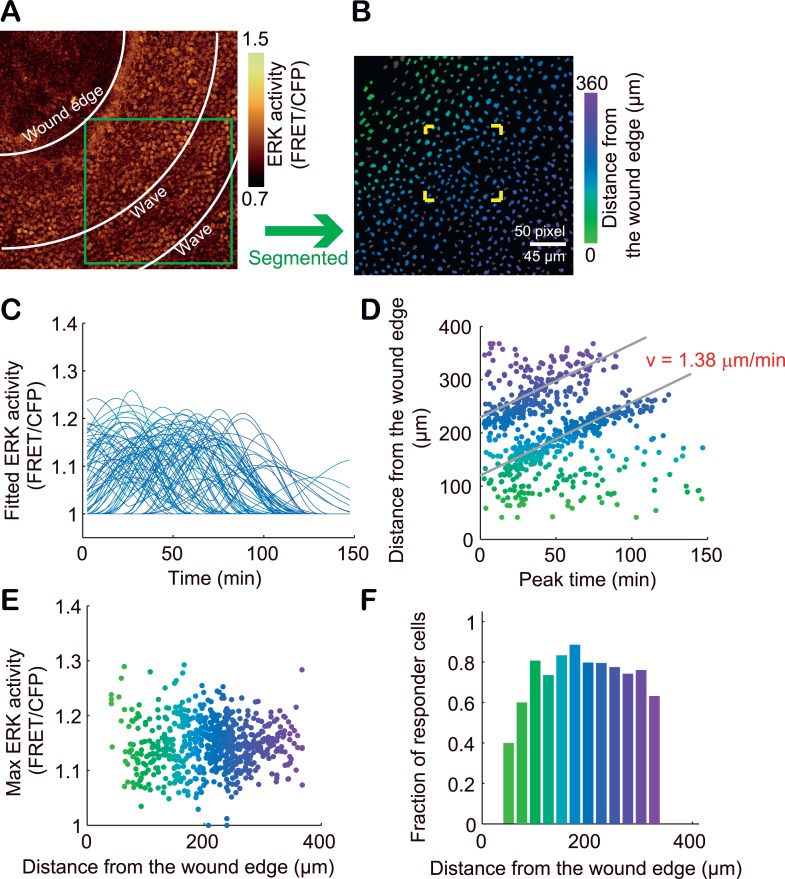
Extracellular signal-regulated kinase (ERK) is a key effector of many growth signalling pathways. In this study, we visualise epidermal ERK activity in living mice using an ERK FRET biosensor. Under steady-state conditions, the epidermis occasionally revealed bursts of ERK activation patterns where ERK activity radially propagated from cell to cell. The frequency of this spatial propagation of radial ERK activity distribution (SPREAD) correlated with the rate of epidermal cell division. SPREADs and proliferation were stimulated by 12-O-tetradecanoylphorbol 13-acetate (TPA) in a manner dependent on EGF receptors and their cognate ligands. At the wounded skin, ERK activation propagated as trigger wave in parallel to the wound edge, suggesting that ERK activation propagation can be superimposed. Furthermore, by visualising the cell cycle, we found that SPREADs were associated with G2/M cell cycle progression. Our results provide new insights into how cell proliferation and transient ERK activity are synchronised in a living tissue.

Keywords: ERK; cell biology; cell cycle; epidermis; in vivo imaging; mouse.


Conflict of interest statement

The authors declare that no competing interests exist.

Figures

Figure 1.
Figure 1.. In vivo imaging of ERK activity in ear skin.
(A) Structure of ERK biosensor (EKAREV-NLS) expressed in Eisuke mice. (B) Experimental set-up of in vivo imaging of ear skin with a two-photon microscope. (C) Schematic of skin structure. (D) ERK activity maps in three different skin layers indicated in (C). ERK activity in the nuclei is represented by intensity modulated display (IMD) mode. The warm and cold colours indicate high and low ERK activities, respectively. Collagen fibres (magenta) were detected by second harmonic generation microscopy. *indicates sebaceous gland and **indicates hair bulge. Scale bar, 100 μm. DOI: http://dx.doi.org/10.7554/eLife.05178.003
Figure 1—figure supplement 1.
Figure 1—figure supplement 1.. Autofluorescence in background FVB/N mouse.
Images of CFP channel (ex 840 nm/em 480 nm) and FRET channels (ex 840 nm/em 530 nm) of an Eisuke mouse (FVB/NEKAREV−NLS) and a control FVB/N mouse. Images were acquired under the same condition and were presented with the same upper- and lower-threshold ranges to show the background fluorescence in the control FVB mouse (upper halves). In the bottom halves of the panels for the FVB/N mouse, the upper-threshold intensity is lowered to show the autofluorescence. DOI: http://dx.doi.org/10.7554/eLife.05178.004
Figure 1—figure supplement 2.
Figure 1—figure supplement 2.. In vivo imaging of ERK activity in backskin.
(A) Experimental set-up of in vivo imaging of backskin with a two-photon microscope. (B) ERK activity maps in dermis (left), basal layer (middle), and suprabasal layer (right) of epidermis. ERK activity in the nuclei is represented by intensity modulated display (IMD) mode. The warm and cold colours indicate high and low ERK activities, respectively. Collagen fibres (magenta) were detected by second harmonic generation microscopy. *indicates hair follicle. Scale bar, 100 μm. DOI: http://dx.doi.org/10.7554/eLife.05178.005
Figure 2.
Figure 2.. SPREAD in ear epidermis.
(A) Representative time-lapse images of SPREAD in the basal layer of ear epidermis. FRET/CFP ratio is represented in IMD mode (upper panels) and gold pseudo-colours (lower panels). The images are cropped from Video 1. Scale bar, 30 μm. (B) Suprabasal layer of ear epidermis in the same area shown in (A). FRET/CFP ratio is represented in IMD mode (upper panels) and gold pseudo-colours (lower panels). Scale bar, 30 μm. DOI: http://dx.doi.org/10.7554/eLife.05178.006
Figure 2—figure supplement 1.
Figure 2—figure supplement 1.. SPREAD in backskin epidermis.
Representative time-lapse images of SPREAD in the basal layer of backskin. FRET/CFP ratio is represented in IMD mode (upper panels) and gold pseudo-colours (lower panels). Scale bar, 30 μm. DOI: http://dx.doi.org/10.7554/eLife.05178.007
Figure 3.
Figure 3.. Single cell analysis of SPREAD.
Detailed analysis of SPREADs was performed with a time-lapse images acquired at 90-s-interval. (A) Binarized CFP image of the SPREAD area. The nucleus of each cell was identified and classified as a non-responder (grey) or a responder (coloured) as described in the ‘Materials and methods’ section. Cells within the region marked by yellow corners were analysed in (CF). All cells in the viewfield were analysed in (G). The yellow cross indicates the origin of the SPREAD. (B) Time series of raw ERK activity (FRET/CFP) (black dotted lines) were approximated with a flat line (left) or sine curve(s) (right). (C) Raw (left) and fitted (right) time series of ERK activity (FRET/CFP) of responders. (D) The distance from the centre of SPREAD to each cell was plotted against the peak time to determine the velocity of ERK propagation. (E) The Max ERK activity of each cell plotted against the distance from the centre of the SPREAD. (F) Peak time histogram of responder cells. (G) The fraction of responder cells in each class of distance from the centre. Cells in the most central class were not analysed because there were only three cells. (H and I) Eight SPREADs were analysed to examine the correlation between the radius with the velocity of ERK activation propagation (H) and the Max amplitude of the ERK activity (I) of each SPREAD. DOI: http://dx.doi.org/10.7554/eLife.05178.009
Figure 3—figure supplement 1.
Figure 3—figure supplement 1.. Single cell analysis of individual SPREADs.
(A) Binarized CFP image of the SPREAD area. The nucleus of each cell was identified and classified as a non-responder (grey) or a responder (coloured). Cells within the region marked by yellow corners were analysed in (BE). All cells in the viewfield were analysed in (F). The yellow cross indicates the origin of the SPREAD. (B) Fitted time series of ERK activity (FRET/CFP) of responders. (C) The distance from the centre of SPREAD to each cell was plotted against the peak time to determine the velocity of ERK propagation. (D) The Max ERK activity of each cell plotted against the distance from the centre of the SPREAD. (E) Peak time histogram of responder cells. (F) The fraction of responder cells in each class of distance from the centre. Cells in the most central class were not analysed due to scarcity of cells. DOI: http://dx.doi.org/10.7554/eLife.05178.010
Figure 3—figure supplement 2.
Figure 3—figure supplement 2.. Straight and square root line fitting of distance-time plot of SPREAD.
(A) Comparison of straight line fittings (left) and square root (right) fittings of 8 SPREADs analysed in Figure 3—figure supplement 1. (B) Coefficient of determination of fittings in (A). DOI: http://dx.doi.org/10.7554/eLife.05178.011
Figure 4.
Figure 4.. Spatio-temporal association of SPREADs with cell divisions.
(A and B) Left panels show frequencies of SPREADs (blue) and cell divisions (red) during periods with frequent SPREADs (A) and less frequent SPREADs (B). Right panels show mapping of the centres of SPREADs (blue circle) and cell divisions (red circle) observed during each imaging period. Shown are single frames of CFP images of a 0.213 mm2 viewfield. Individual mouse identification numbers, sex and age are shown on the top of the left panels. Scale bar, 100 μm. (C) The frequency of cell division in and out of the SPREAD area. SPREAD area was defined as the area within 100 μm from the origin and within 1 hr of the onset of the SPREAD. *p < 0.05 (paired Student's t test). (D) Time-lapse images of the yellow square region in (A), showing three SPREADs emerging from the same spot. DOI: http://dx.doi.org/10.7554/eLife.05178.012
Figure 4—figure supplement 1.
Figure 4—figure supplement 1.. Frequencies of SPREAD and cell division in the steady-state ear skin of eleven mice.
(A) Ear skin of eleven Eisuke mice were subjected to imaging as described in Figure 1. Time-lapse imaging was aborted when the body temperature and breathing conditions of mice deteriorated. Frequencies of SPREADs (bars) and cell divisions (lines) during imaging are shown with the individual mouse identification numbers, sex and age on the top. (B) Basal ERK activity in mice with frequent SPREAD (mice #102, 107, 112, 115, and 117) and infrequent SPREAD (mice #113, 114, and 120). DOI: http://dx.doi.org/10.7554/eLife.05178.013
Figure 4—figure supplement 2.
Figure 4—figure supplement 2.. Steady-state backskin with frequent SPREADs and cell divisions.
Left panel shows the frequencies of SPREADs (bars) and cell divisions (lines) during imaging. Mouse identification number, sex and age are shown on the top. Right panel shows mapping of SPREADs (blue circles) and cell divisions (red circles) observed during 14-hr imaging period in the viewfield of 0.213 mm2. Scale bar, 100 μm. DOI: http://dx.doi.org/10.7554/eLife.05178.014
Figure 4—figure supplement 3.
Figure 4—figure supplement 3.. Monte Carlo simulation of SPREAD distribution.
Left panel, the distribution of SPREADs in the viewfield of mouse #102. Right panel, the histogram of average nearest neighbor distance between each SPREAD centre and its nearest neighbor's centre obtained by 100,000 trials of Monte Carlo simulations of SPREAD distributions. DOI: http://dx.doi.org/10.7554/eLife.05178.015
Figure 5.
Figure 5.. Induction of SPREADs by the double TPA treatments.
(A) Eisuke mice were subjected to topical application of 20 μl acetone with or without 0.5 nanomole TPA and imaged according to the protocols. Images were acquired every 1 hr during 5- to –7-hr imaging periods. Mice were returned to the cage after the imaging and the same area of the skin was revisited on the next day. (B) ERK activity in the basal epidermal cells was monitored in FVBEKAREV−NES mice. Average FRET/CFP ratio and S.E.M. of three mice are shown for each. Error bars indicate S.E.M. of the three mice. (C) Protocols for the double TPA application in the presence of inhibitors. Drugs were used as follows: 0.5 nanomole TPA, 207 nanomole PD0329105, 2.0 nanomole TAPI-1, and 0.2 nanomole PD153035 in 20 μl acetone, or vehicle alone. (D) A histogram of SPREADs of the three mice, #201, #202, and #203, which were treated twice with TPA2 in (C). (E) A map of SPREADs (yellow cross) and cell divisions (red dot) observed during 48–72 hr in the mouse #201. (F) The numbers of SPREADs and cell divisions observed in each period. Data are from mouse #201. (G and H) Numbers of cell divisions (G) and SPREADs (H) observed in a 0.213 mm2 viewfield per hour during the observation. Average and S.E.M. are shown. At least three mice were analysed for each protocol. *p < 0.05; **p < 0.01; ***p < 0.001 (paired Student's t test). DOI: http://dx.doi.org/10.7554/eLife.05178.016
Figure 6.
Figure 6.. Delayed exit from S/G2/M phase by MMP inhibitor treatment.
(A) Histogram of the percentage of S/G2/M cells in 120 viewfields (0.213 mm2 each) of steady-state Fucci mice. About 700 cells were analysed for each viewfield. (B) Representative images of viewfields, where S/G2/M cells (green) were less than 10% (left, indicated by * in [A]) or more than 50% (right, indicated by ** in [A]). Red and green cells indicate G0/G1 and S/G2/M cells, respectively. Scale bar, 50 μm. (C) Protocols of double TPA treatments with or without inhibitors. Drugs were applied in the following concentrations: 0.5 nanomole TPA, 207 nanomole PD0329105, 2.0 nanomole TAPI-1, and 0.2 nanomole PD153035 in 20 μl acetone, or vehicle alone. For each protocol, at least three mice were observed. Images were acquired every 1 hr during 7- to 16-hr-imaging periods. Mice were returned to the cage after the imaging and the same area of the skin was revisited on the next day. (D) The proportion of S/G2/M cells. Average and S.E.M. are shown. At least three mice were used for each drug protocol. (E) Representative time lapse images of protocol TPA2 and TPA2 + TAPI-1. Note that the fraction of S/G2/M cells (green) was maintained at high level by TAPI-1 treatment (52 hr, 56 hr). Scale bar, 50 μm. DOI: http://dx.doi.org/10.7554/eLife.05178.018
Figure 7.
Figure 7.. Two types of ERK activity propagation patterns during epithelial wound healing.
(A) CFP images of the wounded ear skin of an Eisuke mouse. An epithelial wound was created on the ear skin of an Eisuke mouse 12 hr before observation. The wound edge and location of SPREADs observed during 9 hr of observation are shown by white dashed line and yellow crosses, respectively. (B) Time-lapse images of a representative SPREAD observed in the red-square region in (A). (C) Time-lapse images of a representative ERK propagation wave from the wound edge observed in the white-square region in (A). The images are cropped from Video 3. Scale bars are100 μm (A) and 30 μm (B and C). (D) Histogram of the number of SPREADs classified by the distance from the wound edge. In total, 123 SPREADs were analysed from four independent experiments. (E and F) The frequencies of SPREAD (E) and cell division (F) per 1 hr in 1 mm2. Eisuke mice were topically applied with the indicated drug at the time of wounding. Average and S.E.M. are shown. At least three mice were observed for each drug treatment. *p < 0.05; **p < 0.01 (paired Student's t test). DOI: http://dx.doi.org/10.7554/eLife.05178.019
Figure 8.
Figure 8.. Single cell analysis of ERK propagation waves from the wound edge.
(A) A gold pseudo-colour image of FRET/CFP ratio in an Eisuke mouse wounded 12 hr before observation. The image is cropped from Video 5. (B) The green-square region in (A) is magnified. The colours of segmented nuclei indicate the distance from the wound edge. Grey nuclei indicate non-responder cells. (C) With each nucleus, the time course of FRET/CFP values was approximated with a flat line or one to three sine curves as performed in Figure 3. (D) The distance from the wound edge to each cell was plotted against the peak ERK activation time to determine the velocity of ERK activation propagation. (E) The Max ERK activity of each cell was plotted against the distance from the wound edge. (F) The fraction of responder cells in each distance. DOI: http://dx.doi.org/10.7554/eLife.05178.023

References

    1. Abel EL, Angel JM, Kiguchi K, DiGiovanni J. Multi-stage chemical carcinogenesis in mouse skin: fundamentals and applications. Nature Protocols. 2009;4:1350–1362. doi: 10.1038/nprot.2009.120. - DOI - PMC - PubMed
    1. Albeck JG, Mills GB, Brugge JS. Frequency-modulated pulses of ERK activity transmit quantitative proliferation signals. Molecular Cell. 2013;49:249–261. doi: 10.1016/j.molcel.2012.11.002. - DOI - PMC - PubMed
    1. Aoki K, Kumagai Y, Sakurai A, Komatsu N, Fujita Y, Shionyu C, Matsuda M. Stochastic ERK activation induced by noise and cell-to-cell propagation regulates cell density-dependent proliferation. Molecular Cell. 2013;52:529–540. doi: 10.1016/j.molcel.2013.09.015. - DOI - PubMed
    1. Aoki K, Matsuda M. Visualization of small GTPase activity with fluorescence resonance energy transfer-based biosensors. Nature Protocols. 2009;4:1623–1631. doi: 10.1038/nprot.2009.175. - DOI - PubMed
    1. Arwert EN, Hoste E, Watt FM. Epithelial stem cells, wound healing and cancer. Nature Reviews Cancer. 2012;12:170–180. doi: 10.1038/nrc3217. - DOI - PubMed

Publication types

MeSH terms

Substances