. 2015 Sep;8(5):1083-98.
doi: 10.1038/mi.2014.135. Epub 2015 Feb 11.

Phenotype and function of nasal dendritic cells

Affiliations

Phenotype and function of nasal dendritic cells

H Lee et al. Mucosal Immunol. 2015 Sep.

Abstract

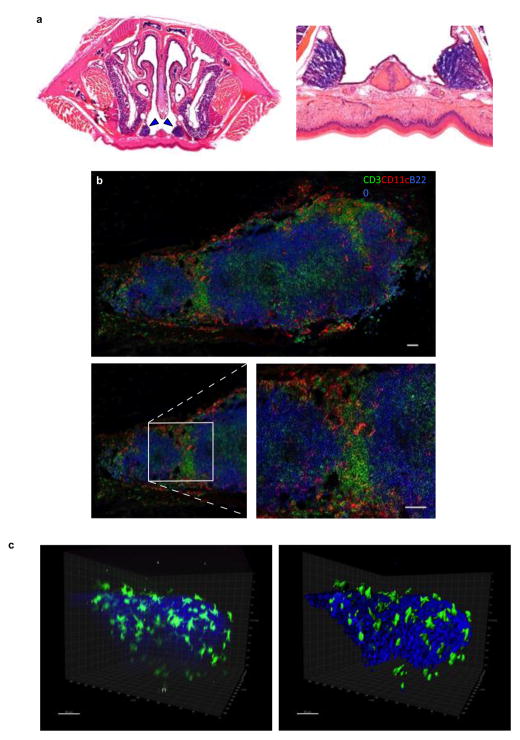
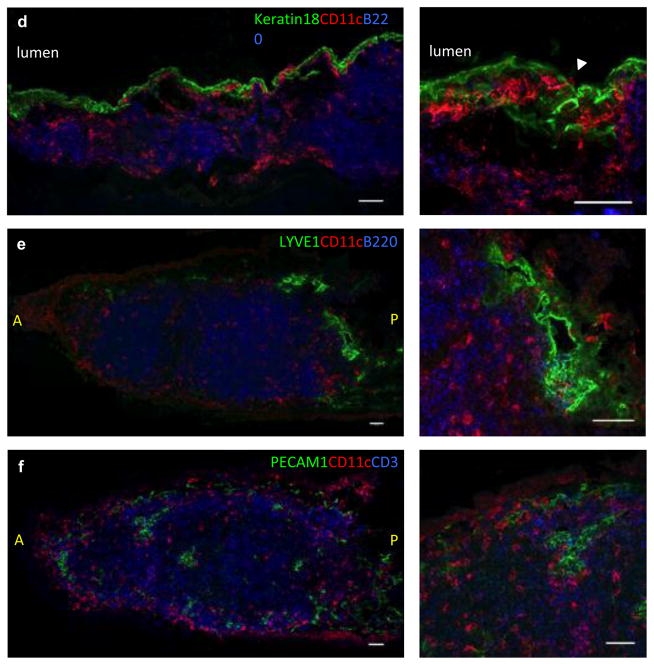
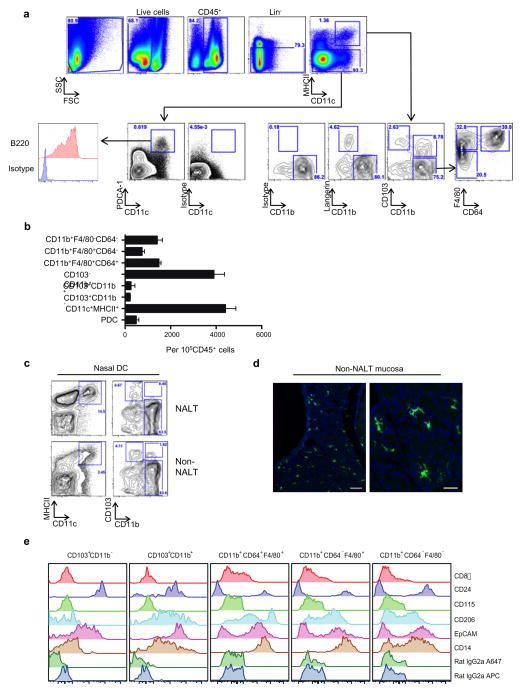
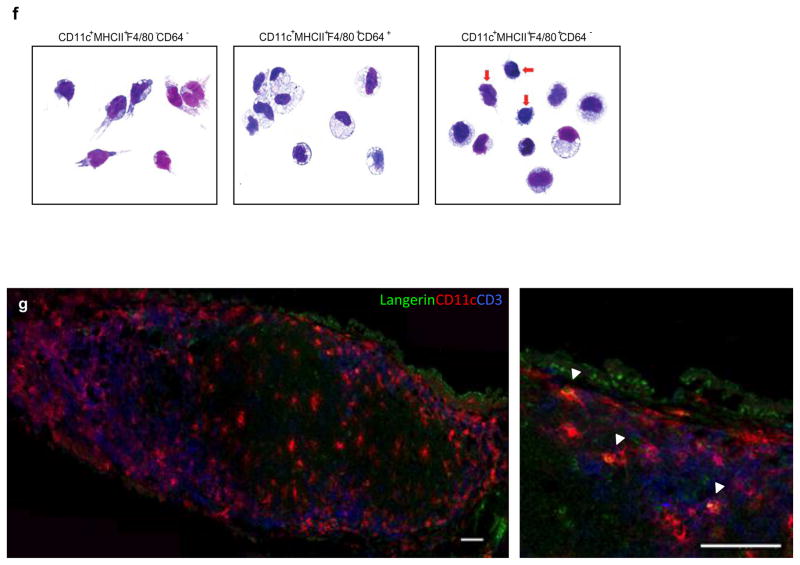
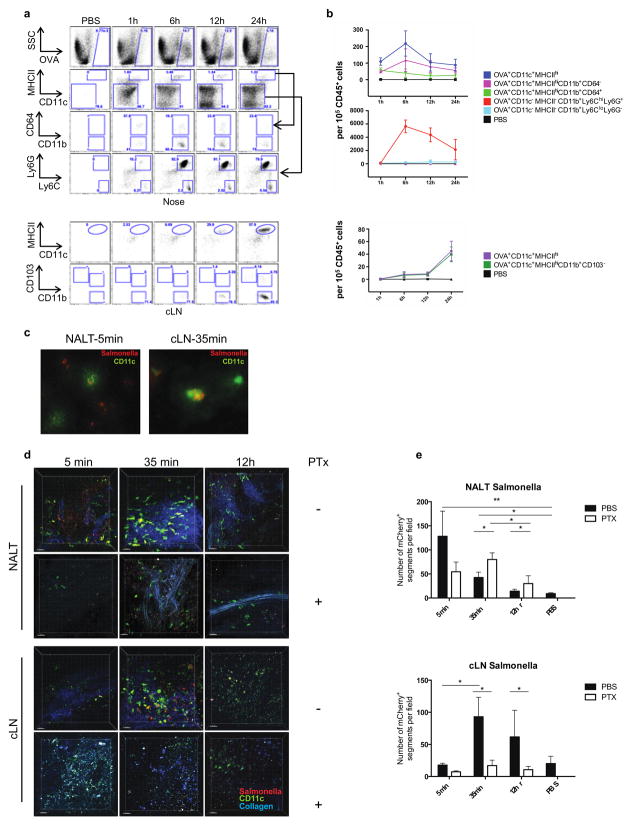
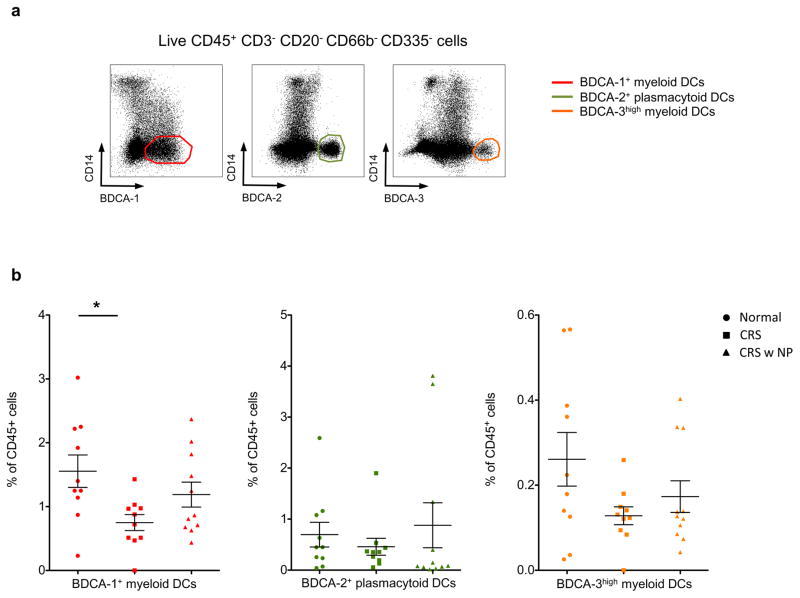
Intranasal (i.n.) vaccination generates immunity across local, regional, and distant sites. However, nasal dendritic cells (DCs), pivotal for the induction of i.n. vaccine-induced immune responses, have not been studied in detail. Here, by using a variety of parameters, we define nasal DCs in mice and humans. Distinct subsets of "classical" DCs, dependent on the transcription factor zbtb46 were identified in the murine nose. The murine nasal DCs were Fms-related tyrosine 3 kinase ligand responsive and displayed unique phenotypic and functional characteristics, including the ability to present antigen, induce an allogeneic T-cell response, and migrate in response to lipopolysaccharide or live bacterial pathogens. Importantly, in a cohort of human volunteers, BDCA-1(+) DCs were observed to be the dominant nasal DC population at steady state. During chronic inflammation, the frequency of both BDCA-1(+) and BDCA-3(hi) DCs was reduced in the nasal tissue, associating the loss of these immune sentinels with chronic nasal inflammation. The present study is the first detailed description of the phenotypic, ontogenetic, and functional properties of nasal DCs, and will inform the design of preventative immunization strategies as well as therapeutic modalities against chronic rhinosinusitis.


Figures

Figure 1
Figure 1. DCs in murine nasal-associated lymphoid tissue (NALT)
(a) Hematoxylin and Eosin (H&E) staining was used to define the morphology of murine NALT (indicated with blue arrowheads) at 200x magnification (left) and at 400x magnification (right) (b) Immunofluorescent staining to define the relationship of NALT associated dendritic cells (DC) with T and B cells. Confocal micrograph of the entire longitudinal section of NALT is depicted here by combining individual images in Adobe Photoshop CC. CD3+ T cells (green), B220+ B cells (blue), and CD11c+ cells (red) are shown. Inset highlights a magnified area demonstrating that the CD11c+ cells are predominantly located in the T cells zones and in the periphery of the NALT. Each figure is representative of at least five experiments. Bars, 50μm. (c) Three dimensional reconstruction from two-photon microscopy data showing spatial distribution of nasal CD11c+ cells (green) from eYFP transgenic mice and collagen second harmonic generation (blue). Raw fluorescent image (left) and reconstructed image (right) are depicted. (d,e,f) Immunofluorescent staining to define the relationship of NALT DCs with the nasal epithelium, blood vessels and lymphatic channels. (d) Shows the relationship of CD11c+ cells (red) with the cytokeratin 18+ nasal epithelial cells (green) and B220+ B cells (blue). White arrowhead shows the extension of CD11c+ dendrites across the epithelium into the nasal lumen. (e) Depicts the relationship of CD11c+ cells (red) with LYVE1+ lymphatic channels (green) and B220+ B cells (blue) and (f) shows the proximity of CD11c+ cells (red) to PECAM1+ blood vessels (green) and B220+ B cells (blue). In panels d, e and f, confocal micrographs of the entire longitudinal section of NALT are depicted by combining individual images in Adobe Photoshop CC. A= Anterior, P=Posterior. Each figure is representative of at least three experiments. Bars, 50μm.
Figure 2
Figure 2. Phenotypic characterization of nasal DCs
(a, b, c) Single cell suspension of nasal cells was obtained by mechanical disruption and collagenase-digestion of nasal tissue. Multiparameter flow cytometry was used to identify DC subsets within the murine nose. (a) Defines the gating strategy used to delineate myeloid DC (mDC) subsets based on the expression of CD103, CD11b, and CD64 on live, CD45+lineageCD11c+MHCII+ cells. For identification of plasmacytoid DCs (pDCs), MHCII cells were defined on the basis of CD11c and PDCA-1 staining. PDCA-1hiCD11c+B220+ cells were deemed putative pDCs. (b) Absolute number of all DC subsets including pDCs. Error bars = standard deviation (SD). (c) Shows identification of NALT and non-NALT DCs separately and (d) Shows eYFP+ cells in non-NALT mucosa. Bars, 50μm (left) and 25μm (right). (e) Shows detailed phenotypic characterization of the nasal APC subsets using a panel of monoclonal antibodies. (f) Wright-Geimsa stains were used to define the cellular morphology of putative nasal DCs and nasal Mϕ. Bars, 10μm. (g) CD11c+langerin+DCs were analyzed by immunofluorescence using confocal microscope where langerin+ cells are depicted in green, CD11c+ cells in red and CD3+ cells in blue. White arrowheads indicate the cells where co-localization of langerin with CD11c was observed. Bars, 50μm.
Figure 3
Figure 3. Identification of Fms-related tyrosine kinase 3 ligand (FLT3L) responsive nasal DC subsets
C57BL/6 wild type (WT) mice were implanted with 5–7x10⁶ B16-FLT3 ligand melanoma cells (B16-FLT3L), or B16 melanoma cells (B16) and the nasal DC subsets were analyzed by multiparameter flow cytometry (a and b) or immunofluorescence (c) after ten to fourteen days of tumor implantation. (a) Representative flow cytometry panels comparing the expansion of putative nasal DCs in B16 or B16-FLT3L mice and (b) shows cumulative data from three individual experiments Error bars = SD. *=p<0.05, **=p<0.01, ns= not significant. (c) Nasal cryosections from mice implanted with B16-FLT3L or B16 melanoma cells were stained for CD3 (green), CD11c (red), and B220 (blue). Scale bars, 50μm. The entire NALT is depicted here by combining individual images in Adobe Photoshop CC.
Figure 4
Figure 4. CYTOF plots comparing nasal populations in B16 melanoma and FLT3L-B16 melanoma mice
(a) SPADE plots showing the expression of CD11c in nasal mononuclear cell populations as indicated. (b) Macrophage and DC focused spade trees showing the expression of the indicated markers in FLT3L treated mice. The size of each node represents the number of cells and the strength of expression of the respective marker is indicated by the color as specified in the legend (c) Summary of the CYTOF data showing fold changes in the respective populations, comparing nasal populations in B16 and B16- FLT3L mice.
Figure 5
Figure 5. Identification of “classical DCs” and ϕ in the murine nose
zDCDTR (Zbtb46-DTR) Tg or MMDTR (LysmCre x Csf1rLsL-DTR) or WT bone marrow chimeric mice were injected intraperitoneally (i.p.) with 500ng DT and live, CD45+ nasal cells were analyzed for expression of CD11c, MHCII, CD103, CD11b, F4/80, and CD64 one-day post DT administration. Numbers represent the percentage of cells in the indicated gate. (a) Representative flow cytometry plots comparing the percentage of nasal APCs between WT, zDCDTR, and MMDTR mice. (b) Cumulative data from three individual experiments is depicted here. Error bars = SD. *=p<0.05, **=p<0.01, ***=p<0.001.
Figure 6
Figure 6. Nasal DCs present antigen to CD4+ T cells and induce proliferation of allogeneic T cells in a mixed leukocyte reaction (MLR)
(a) Nasal DCs from C57BL/6 mice were expanded with B16-FLT3L cells for ten to fourteen days before sorting. Nasal APCs were sorted into two subsets: CD11c+MHCII+ F4/80CD64 cells, indicated as nose DCs and CD11c+MHCII+F4/80+CD64+ cells indicated as nose ϕ. Sorted cells were cultured in the indicated DC:T cell ratio for 5 days with CFSE-labeled splenic OT-II cells (left) or BALB/c splenic T cells (right). Spleen DCs were used as the positive control and spleen B cells were used as the negative control. Representative flow cytometry plots comparing the proliferation of Vα2+CD4+ T cells (left) or allogeneic T cells (right) by nasal DCs and ϕ. Cumulative data from one of three experiments is shown here. Error bars = SD. (b) Quantification of the number of proliferated (CFSElo) OT-II T cells (left) or Balb/c T cells (right). Cumulative data from one of three experiments is shown here. Error bars = SD.
Figure 7
Figure 7. Migration of nasal DCs to cervical draining LNs
(a,b) Targeting of nasal DCs and Neutrophils following intranasal administration of OVA-Alexa 488 and migration of OVA+ DCs to the cervical lymph nodes. (a,b) At least three WT mice per time point were administered either OVA Alexa 488 plus LPS or were given PBS intranasally and analyzed at 1h, 6h, 12h, and 24h. (a) (Top) Shows representative flow cytometric analysis of OVA+ cells. Both nasal DCs (CD11c+MHCII+CD11b+CD64 cells) and neutrophils (CD11cMHCIILy6ChiLy6Ghi cells) are shown. (Bottom) Shows representative flow cytometric analysis of OVA+ migratory DCs (CD11c+MHCIIhi cells) in the cLN at respective time points. (b) Cumulative data from three individual experiments is quantified here. Error bars = SD. (c) Three-dimensional reconstruction from two-photon microscopy data showed dramatic change in spatial distribution of CD11c-eYFP+ DCs (green) and mCherry expressing salmonella (red) between NALT and cervical lymph nodes (cLN). Second-harmonics signals from collagen are in blue. Scale bars, 30μm. (d) Numbers of mCherry+ cells in NALT (top) and cLN (bottom) were quantified using the Imaris software (Bitplane). Each figure is representative of at least three experiments. Error bars = SD. 400x magnification. (e) Uptake of Salmonella typhimurium by CD11c-eYFP+ cells derived from the murine nose and mediastinal lymph node is compared between PBS and PTX administered mice at 5 min, 35 min and 12h post administration using two-photon microscopy.
Figure 8
Figure 8. Identification of DCs in human nasal mucosa
(a) Live CD45+ mononuclear CD3 CD20 CD335 CD66b CD14 cells, i.e., T, B, NK, neutrophils and monocyte excluded cells were analyzed for BDCA-1, 2, 3 markers. Three DC populations are shown: BDCA-1+ myeloid DCs (left), BDCA-2+ plasmacytoid DCs (middle), BDCA-3hi myeloid DCs (right). (b) Frequency of BDCA-1+ cells, BDCA-2+ cells and BDCA-3hi cells as a percent of CD45+ mononuclear cells of Normal, CRS, or CRS with nasal polys. Composite data from 20 donors are shown. * p<0.05.

References

    1. Kurono Y, Yamamoto M, Fujihashi K, Kodama S, Suzuki M, Mogi G, et al. Nasal immunization induces Haemophilus influenzae-specific Th1 and Th2 responses with mucosal IgA and systemic IgG antibodies for protective immunity. J Infect Dis. 1999;180(1):122–32. - PubMed
    1. Yanagita M, Hiroi T, Kitagaki N, Hamada S, Ito HO, Shimauchi H, et al. Nasopharyngeal-associated lymphoreticular tissue (NALT) immunity: fimbriae-specific Th1 and Th2 cell-regulated IgA responses for the inhibition of bacterial attachment to epithelial cells and subsequent inflammatory cytokine production. J Immunol. 1999;162(6):3559–65. - PubMed
    1. Sandoval F, Terme M, Nizard M, Badoual C, Bureau MF, Freyburger L, et al. Mucosal imprinting of vaccine-induced CD8(+) T cells is crucial to inhibit the growth of mucosal tumors. Sci Transl Med. 2013;5(172):172ra20. Epub 2013/02/15. - PMC - PubMed
    1. Langermann S, Palaszynski S, Sadziene A, Stover CK, Koenig S. Systemic and mucosal immunity induced by BCG vector expressing outer-surface protein A of Borrelia burgdorferi. Nature. 1994;372(6506):552–5. - PubMed
    1. Velge-Roussel F, Marcelo P, Lepage AC, Buzoni-Gatel D, Bout DT. Intranasal immunization with Toxoplasma gondii SAG1 induces protective cells into both NALT and GALT compartments. Infect Immun. 2000;68(2):969–72. - PMC - PubMed

Publication types