

Trends in Self-Reported Sleep Duration among US Adults from 1985 to 2012
- PMID: 25669182
- PMCID: PMC4402659
- DOI: 10.5665/sleep.4684
Trends in Self-Reported Sleep Duration among US Adults from 1985 to 2012
Abstract
Study objective: The trend in sleep duration in the United States population remains uncertain. Our objective was to examine changes in sleep duration from 1985 to 2012 among US adults.
Design: Trend analysis.
Setting: Civilian noninstitutional population of the United States.
Participants: 324,242 US adults aged ≥ 18 y of the National Health Interview Survey (1985, 1990, and 2004-2012).
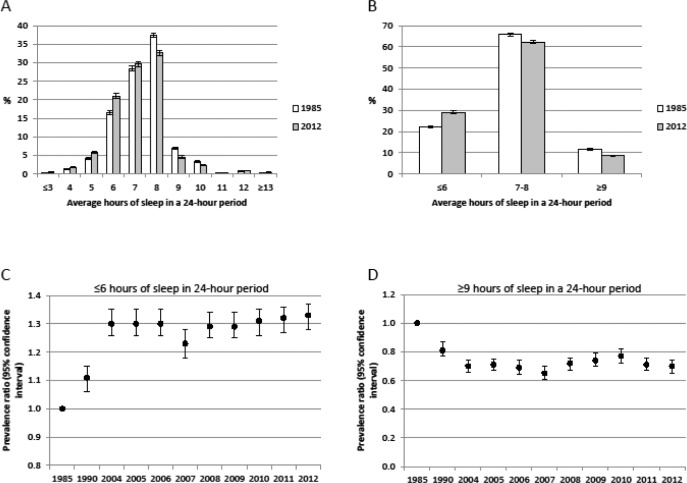
Measurements and results: Sleep duration was defined on the basis of the question "On average, how many hours of sleep do you get in a 24-h period?" The age-adjusted mean sleep duration was 7.40 h (standard error [SE] 0.01) in 1985, 7.29 h (SE 0.01) in 1990, 7.18 h (SE 0.01) in 2004, and 7.18 h (SE 0.01) in 2012 (P 2012 versus 1985 < 0.001; P trend 2004-2012 = 0.982). The age-adjusted percentage of adults sleeping ≤ 6 h was 22.3% (SE 0.3) in 1985, 24.4% (SE 0.3) in 1990, 28.6% (SE 0.3) in 2004, and 29.2% (SE 0.3) in 2012 (P 2012 versus 1985 < 0.001; P trend 2004-2012 = 0.050). In 2012, approximately 70.1 million US adults reported sleeping ≤ 6 h.
Conclusions: Since 1985, age-adjusted mean sleep duration has decreased slightly and the percentage of adults sleeping ≤ 6 h increased by 31%. Since 2004, however, mean sleep duration and the percentage of adults sleeping ≤ 6 h have changed little.
Keywords: health surveys; sleep; trends.
© 2015 Associated Professional Sleep Societies, LLC.
Figures
References
-
- Bixler E. Sleep and society: an epidemiological perspective. Sleep Med. 2009;10:S3–6. - PubMed
-
- Centers for Disease Control and Prevention. Percentage of adults who reported an average of < 6 hours of sleep per 24-gour period, by sex and age group --- United States, 1985 and 2004. MMWR Morb Mortal Wkly Rep. 2005;54:933.
-
- Centers for Disease Control and Prevention. QuickStats: percentage of adults aged > 18 tears who reported an average of < 6 hours of sleep† per 24-hour period, by sex and age group --- National Health Interview Survey, United States, 1985 and 2006. MMWR Morb Mortal Wkly Rep. 2008;57:209.
MeSH terms
LinkOut - more resources
Full Text Sources
Other Literature Sources
Medical
