. 2015 May;35(5):806-17.
doi: 10.1038/jcbfm.2014.254. Epub 2015 Feb 11.

The effects of capillary transit time heterogeneity (CTH) on brain oxygenation

Affiliations

The effects of capillary transit time heterogeneity (CTH) on brain oxygenation

Hugo Angleys et al. J Cereb Blood Flow Metab. 2015 May.

Abstract

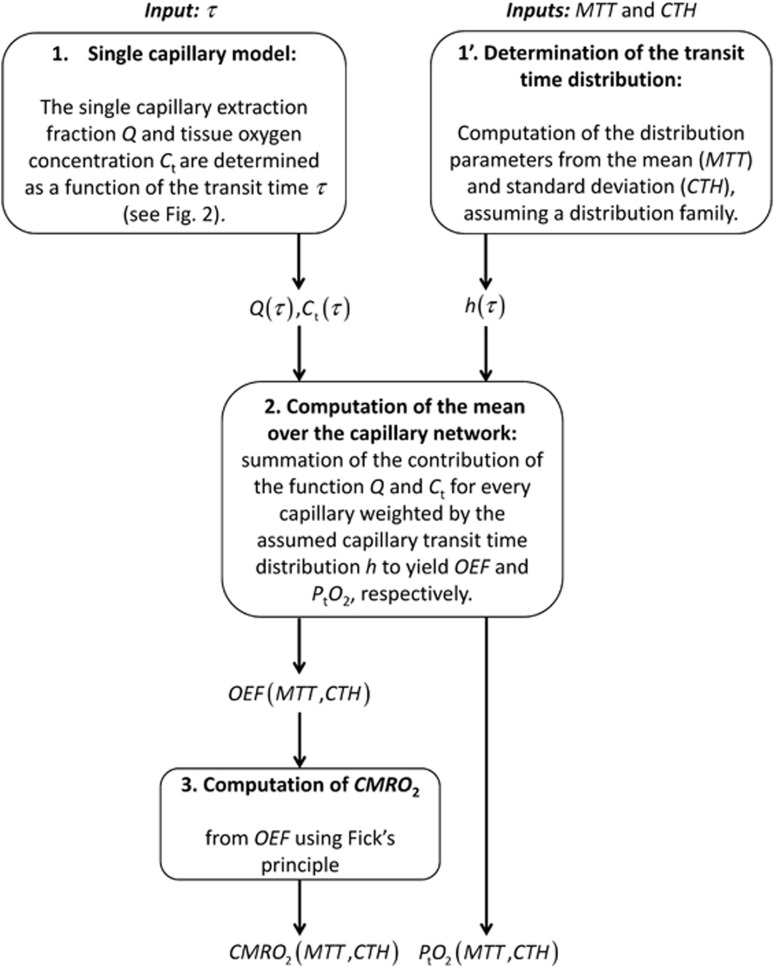
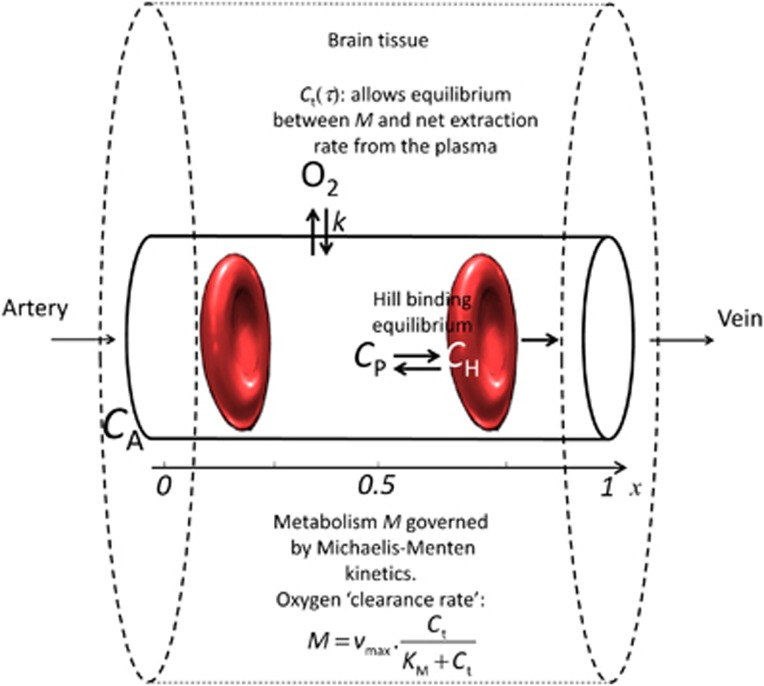
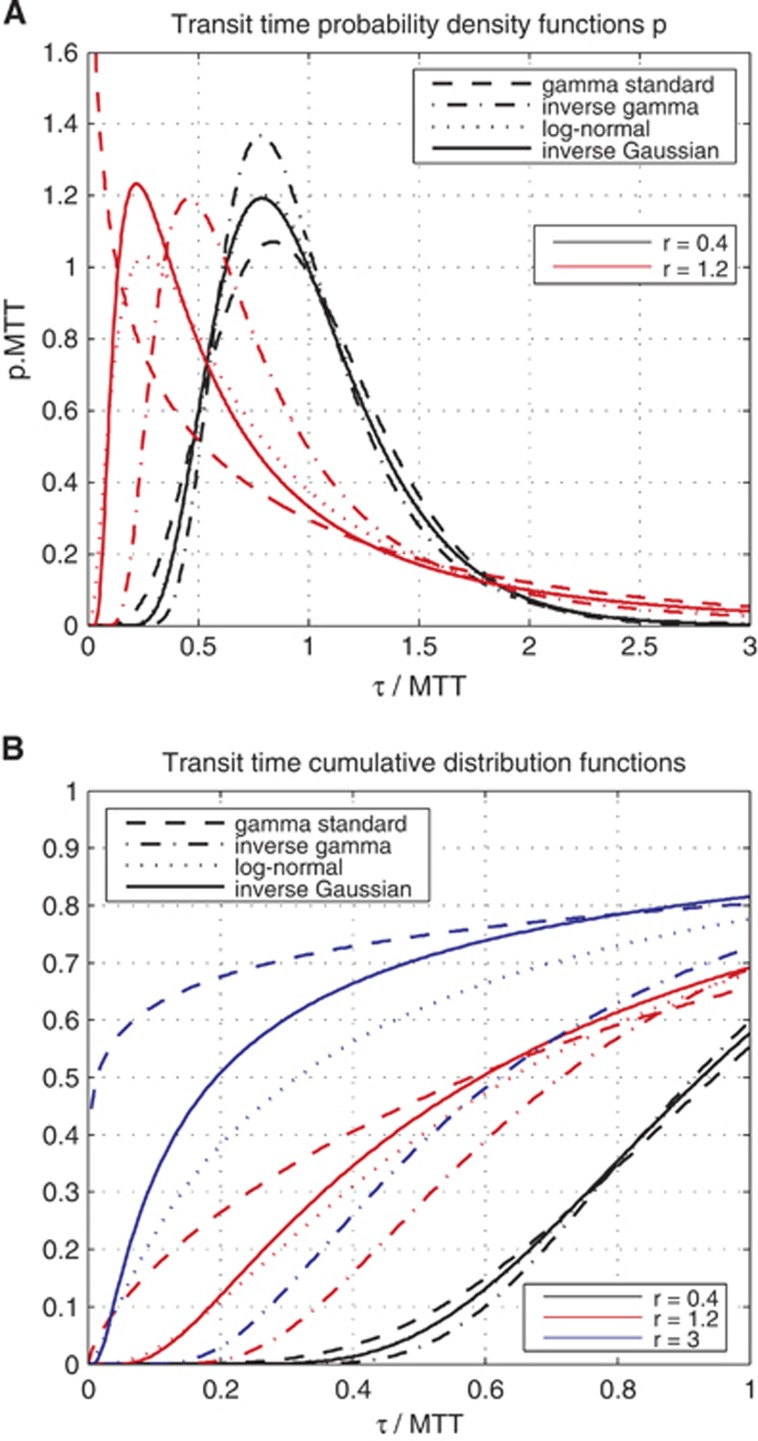
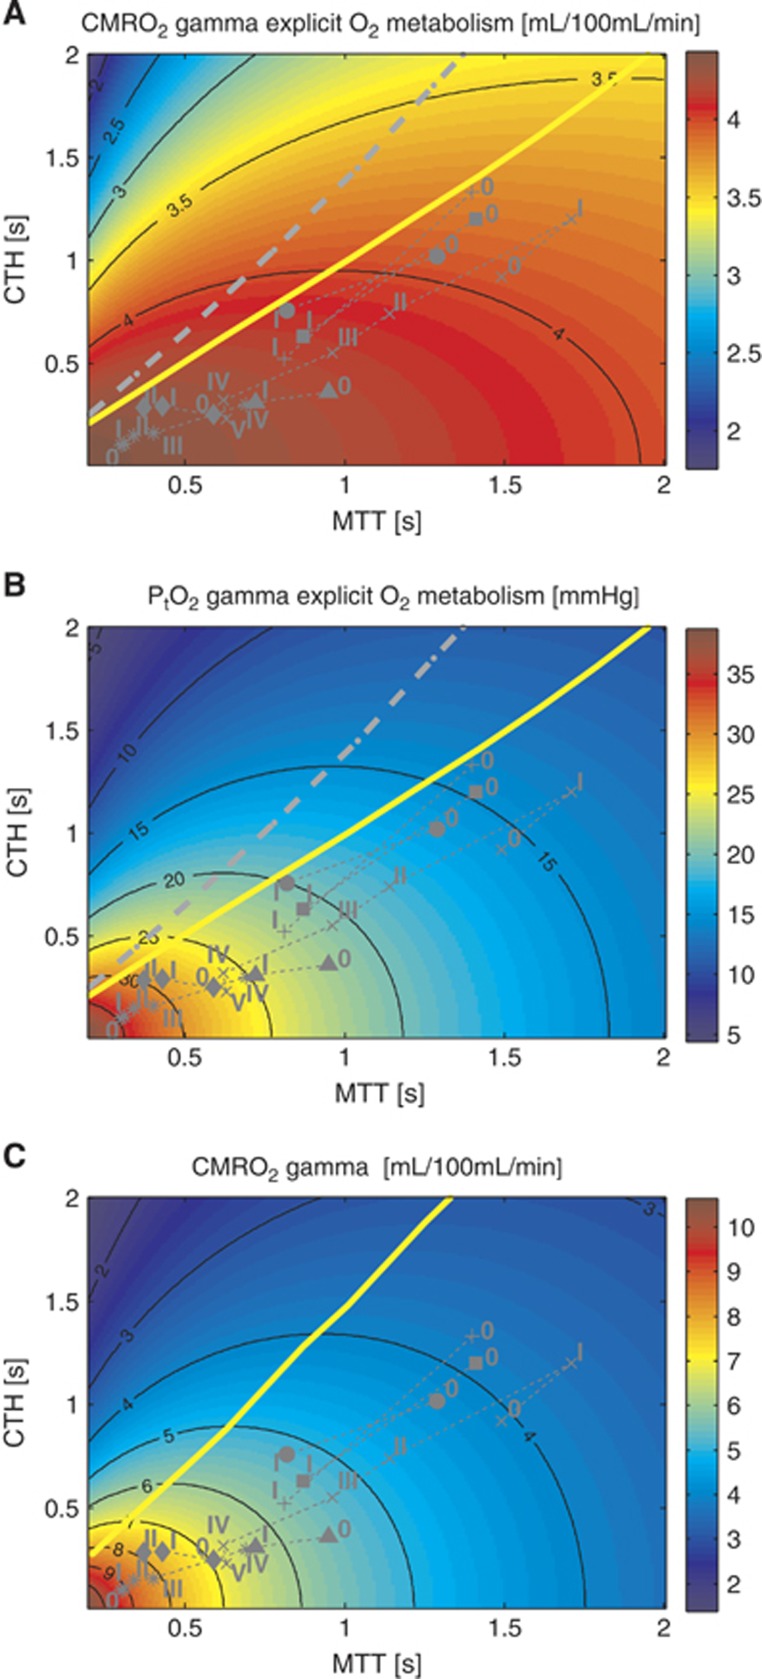
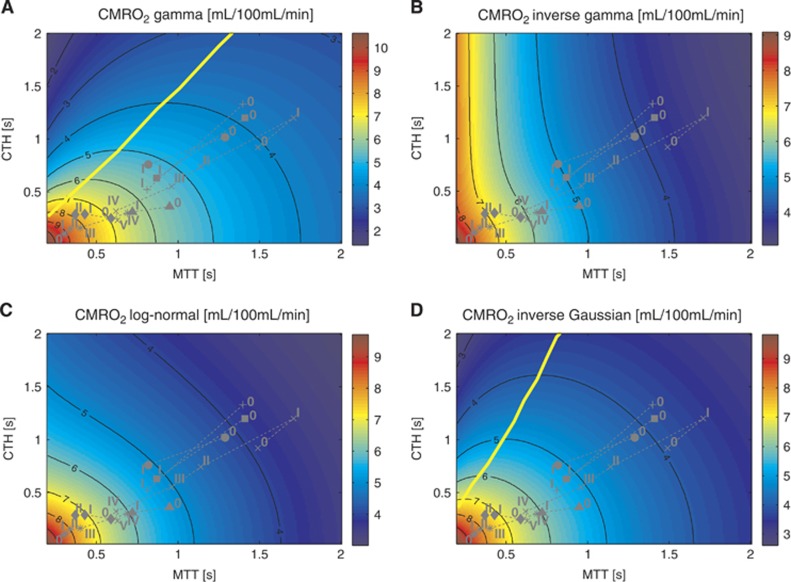
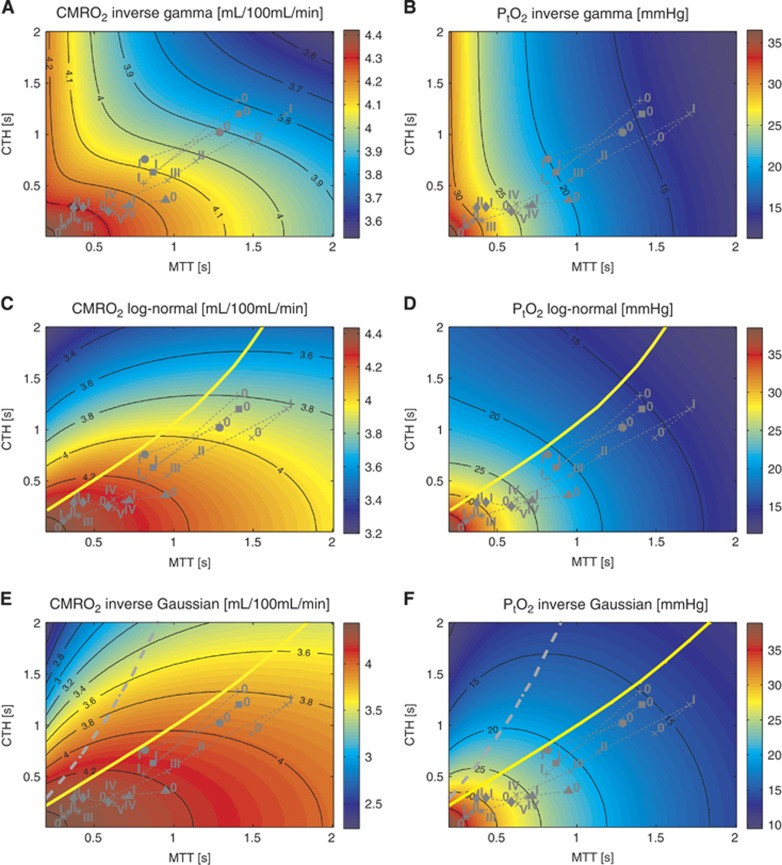
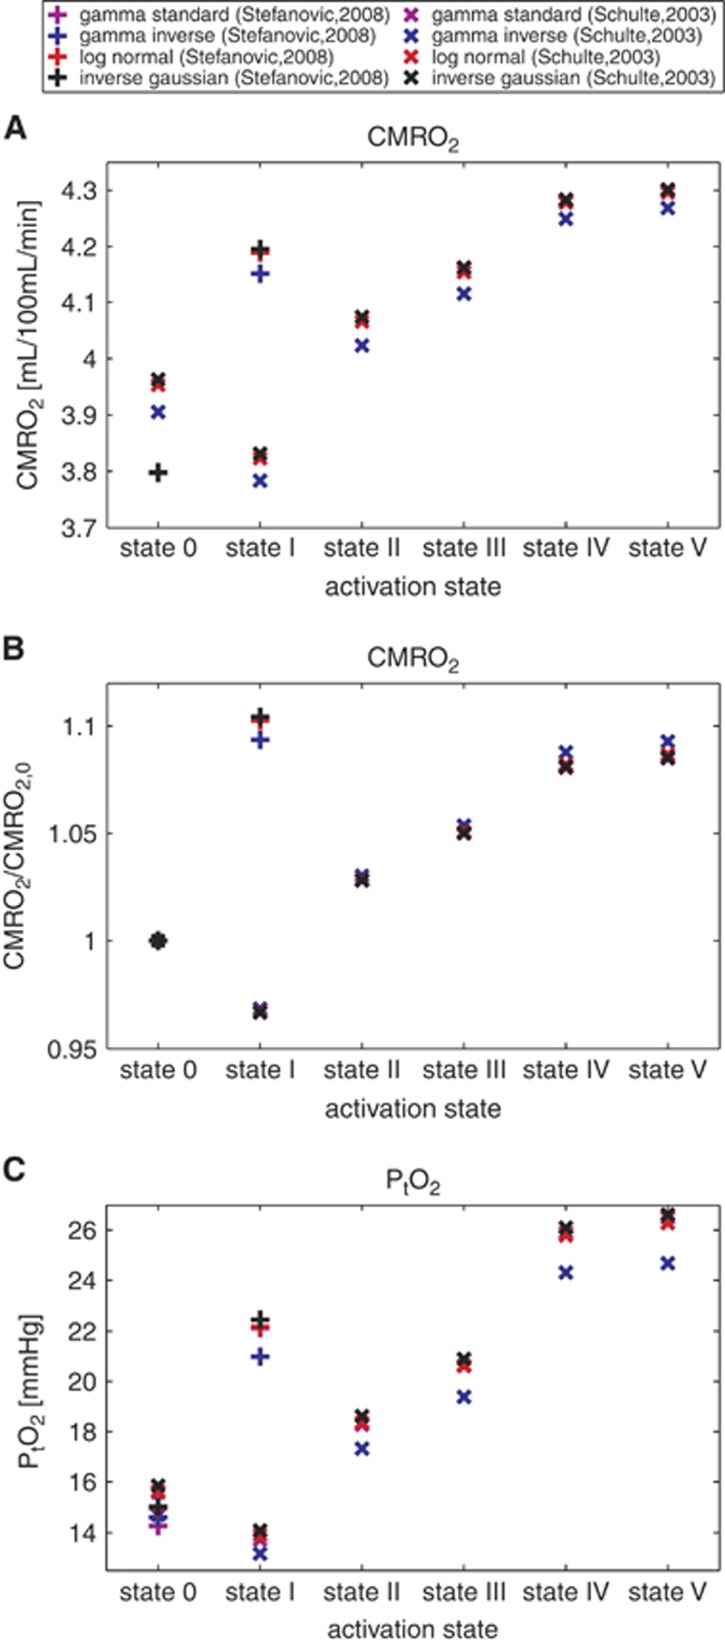
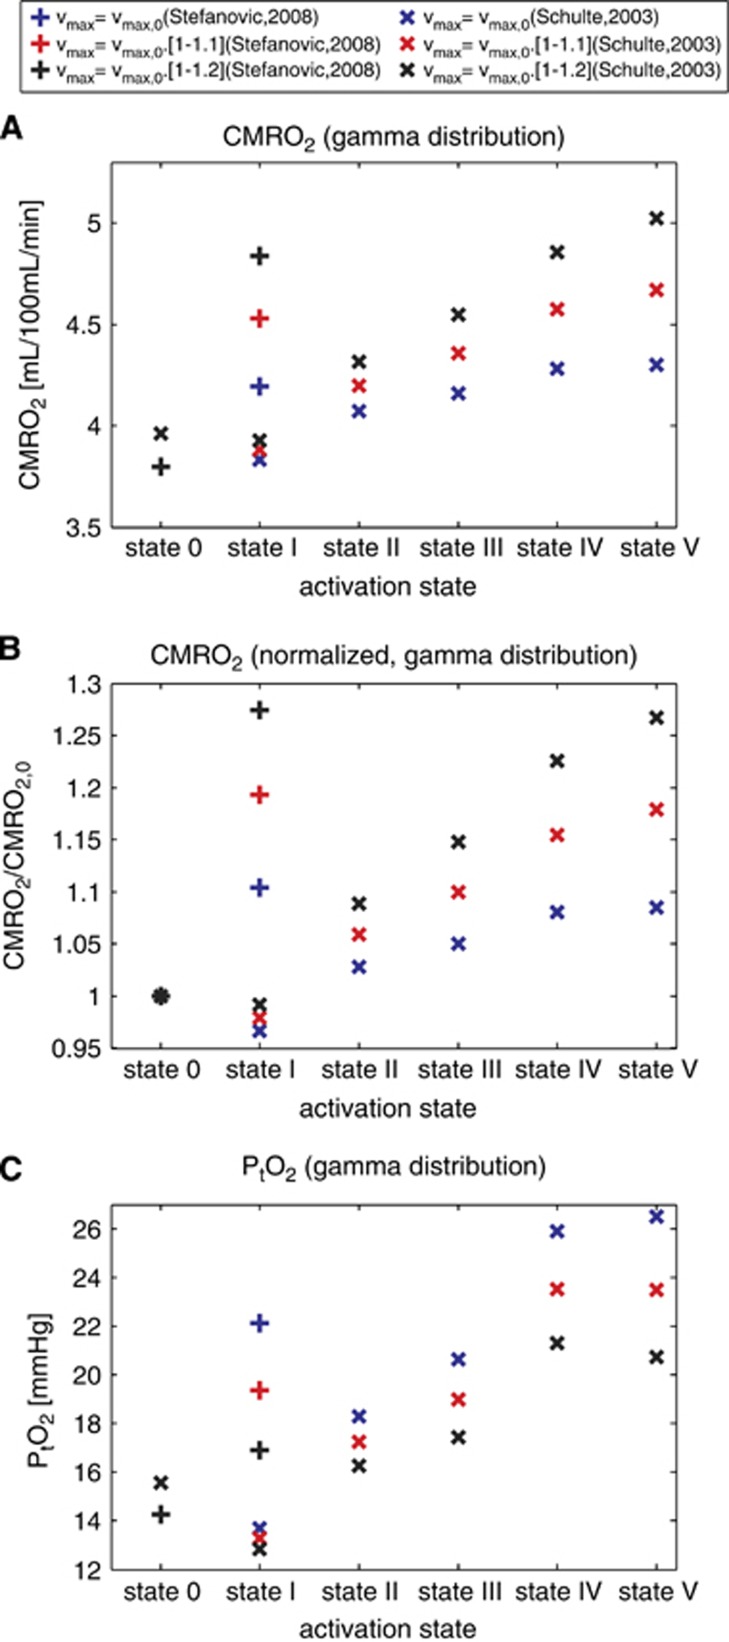
We recently extended the classic flow-diffusion equation, which relates blood flow to tissue oxygenation, to take capillary transit time heterogeneity (CTH) into account. Realizing that cerebral oxygen availability depends on both cerebral blood flow (CBF) and capillary flow patterns, we have speculated that CTH may be actively regulated and that changes in the capillary morphology and function, as well as in blood rheology, may be involved in the pathogenesis of conditions such as dementia and ischemia-reperfusion injury. The first extended flow-diffusion equation involved simplifying assumptions which may not hold in tissue. Here, we explicitly incorporate the effects of oxygen metabolism on tissue oxygen tension and extraction efficacy, and assess the extent to which the type of capillary transit time distribution affects the overall effects of CTH on flow-metabolism coupling reported earlier. After incorporating tissue oxygen metabolism, our model predicts changes in oxygen consumption and tissue oxygen tension during functional activation in accordance with literature reports. We find that, for large CTH values, a blood flow increase fails to cause significant improvements in oxygen delivery, and can even decrease it; a condition of malignant CTH. These results are found to be largely insensitive to the choice of the transit time distribution.


Figures

Figure 1
Figure 1
Schematic illustrating the procedure for computing CMRO2 and PtO2, given MTT and CTH, assuming a distribution family (e.g. gamma distribution) and a single capillary model (see Figure 2). CMRO2, oxygen consumption; CTH, capillary transit time heterogeneity; MTT, mean transit time; OEF, oxygen extraction fraction.
Figure 2
Figure 2
Single capillary model overview. It consists of three compartments, oxygen bound to hemoglobin, oxygen in plasma, and oxygen in tissue. Oxygen metabolism M depends on vmax (fixed) and on tissue oxygen tension Ct around the capillary. In this model, Ct is the equilibrium oxygen tension which allows M to equal the net oxygen extraction rate across the capillary membrane, which is modeled as a first order exchange process with the rate constant k. This single capillary model allows computing, for a given transit time τ, the oxygen extraction fraction for a single capillary Q(τ) along with the equilibrium oxygen tension. CA, arterial oxygen concentration; CH, oxygen concentration bound to hemoglobin; CP, oxygen concentration in the plasma.
Figure 3
Figure 3
(A) Plot of the probability density function—gamma, inverse gamma, log-normal, inverse Gaussian—used throughout this paper to compute the oxygen extraction fraction (OEF) and other quantities derived from OEF. Relative dispersions r equal to 0.4 and 1.2 are considered. (B) Plot of the corresponding cumulative distribution functions, for relative dispersions r equal to 0.4, 1.2, and 3. For A and B, abscissae unit is expressed in terms of transit time normalized with respect to the mean transit time (MTT); and A's ordinate is expressed in terms of the product between the density of probability p and MTT.
Figure 4
Figure 4
Model of the effects of transit time and capillary transit time heterogeneity (CTH) on oxygen extraction (CMRO2). Contour plot of CMRO2 (A) for a given mean transit time (MTT) and CTH. The corresponding tissue oxygen tension (B) has been computed assuming that all capillaries have the same volume. (C) Shows CMRO2 under the original model assumptions. (A) CMRO2 map, assuming oxygen metabolism to be governed by Michaelis–Menten kinetics, with parameters KM=2.71 mm Hg (3.5 μmol/L) and vmax=4.75 mL/100 mL per minute. (C) CMRO2 map obtained without explicit oxygen metabolism and with tissue oxygen tension assumed to be fixed and equal to 25 mm Hg. (MTT,CTH) values obtained in the range of physiologic conditions are also shown, and refers to conditions listed in Table 2. The capillary transit time distribution is assumed to follow a gamma variate function. The yellow line and the dotted gray line in the three different panels separate states where a flow increase given a fixed CTH will lead to an increased (right side of the line) or decreased (left side of the line) oxygen consumption (A and C) and tissue oxygen tension (B), respectively. The roman numeral accompanying each symbol identifies the corresponding physiologic data in Table 2. Symbols: x: cortical electrical stimulation; +: functional activation; *: hypotension; Δ: mild hypoxemia; ◊: severe hypercapnia; ●: Mild hypercapnia; □: Severe hypoxemia.
Figure 5
Figure 5
CMRO2 maps under the original model assumptions but with different transit time distribution. (A to D) assume a gamma, inverse gamma, log-normal, and inverse Gaussian distribution, respectively. Tissue oxygen tension is fixed at 25 mm Hg. The upper left map is similar to the one obtained in the original model. The yellow line refers to the malignant CTH state. See legend of Figure 4 for the details concerning the symbols. CMRO2, oxygen consumption; CTH, capillary transit time heterogeneity.
Figure 6
Figure 6
CMRO2 maps assuming oxygen metabolism to be governed by Michaelis–Menten kinetics, with parameters KM=2.71 mm Hg(3.5 μmol/L) and vmax=4.75 mL/100 mL per minute. (A, C, and E) on the left show oxygen consumption assuming an inverse gamma (A), log-normal (C), and inverse Gaussian (E) transit time distribution. (B, D, and F) on the right show the corresponding tissue oxygen tension, assuming that all capillaries have the same volume. The yellow and grey lines refer to the malignant CTH state. See legend of Figure 4 for the details concerning the symbols. CMRO2, oxygen consumption; CTH, capillary transit time heterogeneity.
Figure 7
Figure 7
CMRO2 in different physiological conditions listed in Table 2, using several transit time distributions and assuming oxygen metabolism to be governed by Michaelis–Menten kinetics, with parameters KM = 2.71 mm Hg (3.5 μmol/L) and vmax=4.75 mL/100 mL per minute. (A) CMRO2 depending on the physiological conditions. (B) Shows the same data with normalized values with respect to the CMRO2 baseline value (state 0). This allows to compare the activation amplitudes assuming one or the other distribution. (C) Shows tissue oxygen tension for the same physiological conditions. Roman numerals on the abscissa refer to the physiologic conditions in Table 2. Symbols: (+) refers to the data from Stefanovic et al; (x) refers to the data from Schulte et al.
Figure 8
Figure 8
CMRO2 in different physiologic conditions listed in Table 2, assuming a gamma transit time distribution and oxygen metabolism to be governed by Michaelis–Menten kinetics, with parameters at baseline states KM = 2.71 mm Hg (3.5 μmol/L) and vmax=4.75 mL/100 mL per minute. vmax is assumed to be constant (black), to be increased progressively of 10% (red) and 20% (blue) from baseline condition to state I (+) or state V (x). (A) CMRO2 depending on the physiologic conditions. (B) Shows the same data with normalized values with respect to the CMRO2 baseline value (state 0). (C) Shows PtO2 using the same data as previously. Roman numerals on the abscissa refer to the condition detailed in Table 2. Symbols : (+) refers to the data from Stefanovic et al, and (x) refers to the data from Schulte et al.

References

    1. Derdeyn CP, Videen TO, Yundt KD, Fritsch SM, Carpenter DA, Grubb RL, et al. Variability of cerebral blood volume and oxygen extraction: stages of cerebral haemodynamic impairment revisited. Brain J Neurol. 2002;125 (Pt 3:595–607. - PubMed
    1. Donahue MJ, Stevens RD, de Boorder M, Pekar JJ, Hendrikse J, van Zijl PCM. Hemodynamic changes after visual stimulation and breath holding provide evidence for an uncoupling of cerebral blood flow and volume from oxygen metabolism. J Cereb Blood Flow Metab. 2009;29:176–185. - PMC - PubMed
    1. Leithner C, Royl G, Offenhauser N, Fuchtemeier M, Kohl-Bareis M, Villringer A, et al. Pharmacological uncoupling of activation induced increases in CBF and CMRO2. J Cereb Blood Flow Metab. 2010;30:311–322. - PMC - PubMed
    1. Hoge RD, Atkinson J, Gill B, Crelier GR, Marrett S, Pike GB. Linear coupling between cerebral blood flow and oxygen consumption in activated human cortex. Proc Natl Acad Sci USA. 1999;96:9403–9408. - PMC - PubMed
    1. Renkin EM. B. W. Zweifach Award lecture. Regulation of the microcirculation. Microvasc Res. 1985;30:251–263. - PubMed

LinkOut - more resources