. 2015 Mar 20;6(8):6431-47.
doi: 10.18632/oncotarget.3237.

Drug metabolism and clearance system in tumor cells of patients with multiple myeloma

Affiliations

Drug metabolism and clearance system in tumor cells of patients with multiple myeloma

Wafa Hassen et al. Oncotarget. .

Abstract

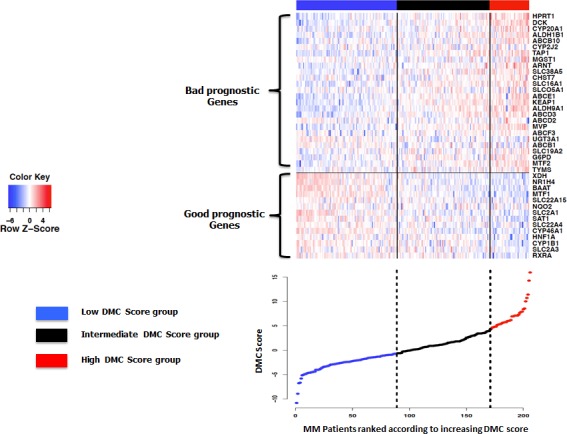
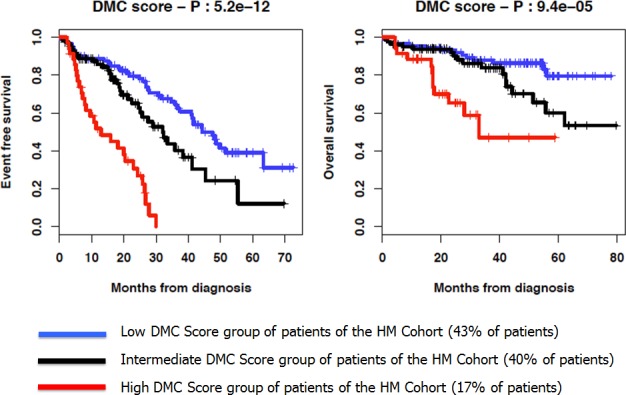
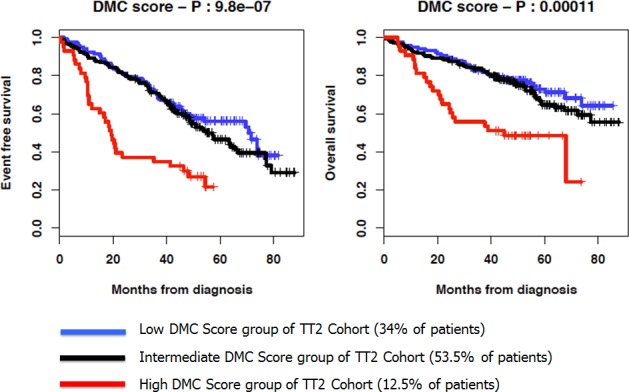
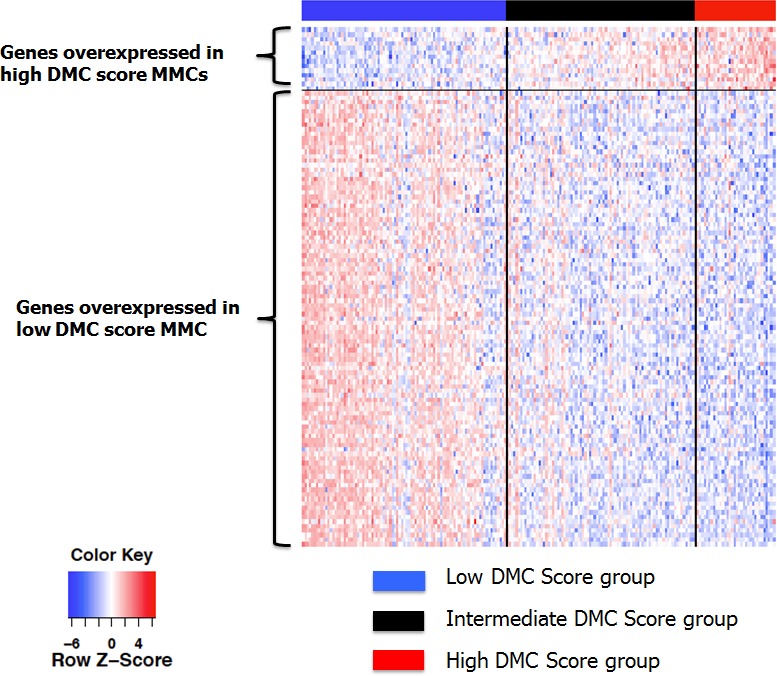
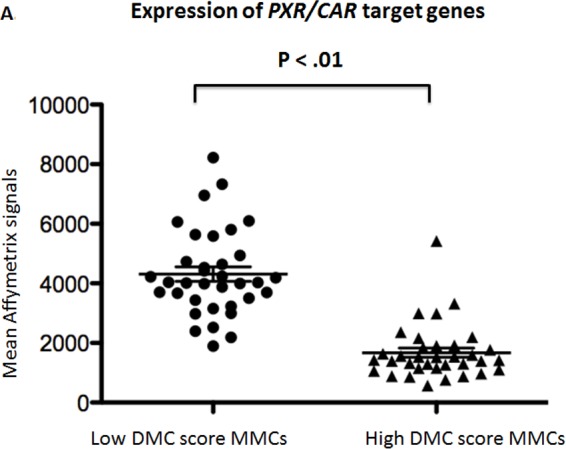
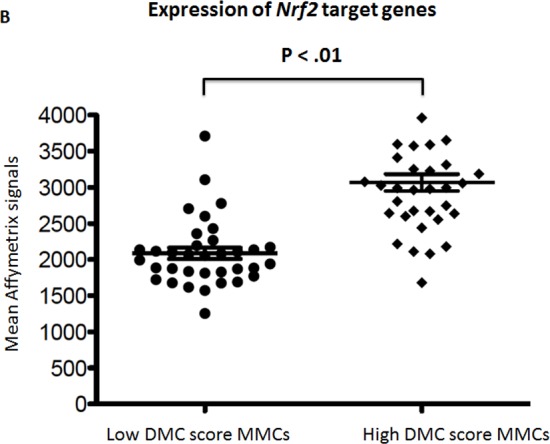
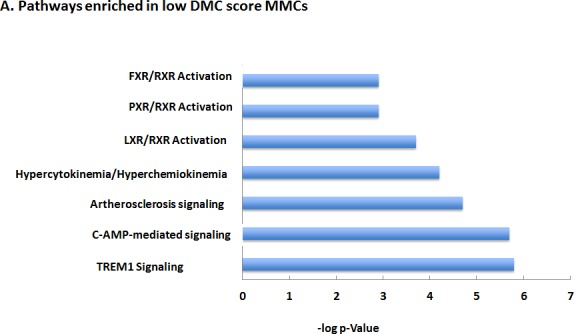
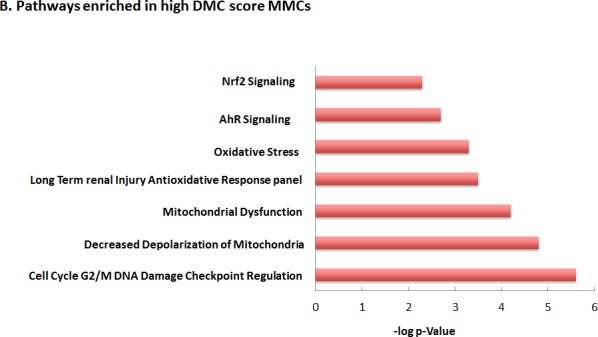
Resistance to chemotherapy is a major limitation of cancer treatments with several molecular mechanisms involved, in particular altered local drug metabolism and detoxification process. The role of drug metabolism and clearance system has not been satisfactorily investigated in Multiple Myeloma (MM), a malignant plasma cell cancer for which a majority of patients escapes treatment. The expression of 350 genes encoding for uptake carriers, xenobiotic receptors, phase I and II Drug Metabolizing Enzymes (DMEs) and efflux transporters was interrogated in MM cells (MMCs) of newly-diagnosed patients in relation to their event free survival. MMCs of patients with a favourable outcome have an increased expression of genes coding for xenobiotic receptors (RXRα, LXR, CAR and FXR) and accordingly of their gene targets, influx transporters and phase I/II DMEs. On the contrary, MMCs of patients with unfavourable outcome displayed a global down regulation of genes coding for xenobiotic receptors and the downstream detoxification genes but had a high expression of genes coding for ARNT and Nrf2 pathways and ABC transporters. Altogether, these data suggests ARNT and Nrf2 pathways could be involved in MM primary resistance and that targeting RXRα, PXR, LXR and FXR through agonists could open new perspectives to alleviate or reverse MM drug resistance.

Keywords: drug metabolism and clearance; multiple myeloma; prognosis.


Conflict of interest statement

Conflict of Interest

The authors declare no conflict of interest.

Figures

Figure 1
Figure 1. Heatmap of supervised clustering of the 40 prognostic genes for EFS along the 206 patients of the HM cohort ranked according increasing DMC score
A k-means function was used to identify the −0.673 and 4.24 cutoff points to split patients into 3 groups with a low, intermediate and high DMC score.
Figure 2
Figure 2. Kaplan-Meier curves of the EFS and OS of the 3 DMC score groups of patients of the HM cohort
Figure 3
Figure 3. Kaplan-Meier curves of the EFS and OS of the 3 DMC score groups of patients of the UAMS-TT2 cohort
Figure 4
Figure 4. Heatmap of the supervised clustering of genes differentially expressed between low and high DMC score MMCs of patients of the HM cohort
Patients are ranked according to increasing DMC score.
Figure 5
Figure 5. Expression of the target genes driven by PXR/CAR and Nrf2 in low and high DMC score MMCs
Data are the mean Affymetrix signals interrogating the target genes driven by PXR/CAR activation (A) or by Nrf2 (B) activation in MMCs of the patients of the low or high DMC score groups designed in Figure 1. The horizontal bars indicate the mean values ± SD of the expression of all target genes in each MMC group and these mean values were compared using a student t-test.
Figure 6
Figure 6. Major Pathways enriched in low (A) or high (B) DMC score MMCs
The Ingenuity Pathway Analysis was used to identify the pathways encoded by the whole genome genes differentially expressed between low and high DMC score MMCs.
Figure 6
Figure 6. Major Pathways enriched in low (A) or high (B) DMC score MMCs
The Ingenuity Pathway Analysis was used to identify the pathways encoded by the whole genome genes differentially expressed between low and high DMC score MMCs.

References

    1. Morgan GJ, Walker BA, Davies FE. The genetic architecture ofmultiple myeloma. Nature Publishing Group. Nature Publishing Group. 2012;12:335–48. - PubMed
    1. Raab MS, Podar K, Breitkreutz I, Richardson PG, Anderson KC. Multiple myeloma. The Lancet. 2009;374:324–39. Elsevier Ltd. - PubMed
    1. Rajkumar SV, Gahrton G, Bergsagel PL. Approach to the treatment of multiple myeloma: a clash of philosophies. Blood. 2011;118:3205–11. - PMC - PubMed
    1. Chen Y, Tang Y, Guo C, Wang J, Boral D, Nie D. Biochemical Pharmacology. Biochem. Pharmacol. 2012;83:1112–26. Elsevier Inc. - PMC - PubMed
    1. Paxton James., editor. Anticancer Drug Metabolism: Chemotherapy Resistance and New Therapeutic Approaches, Topics on Drug Metabolism. ISBN: 2012, 978-953-51-0099-7, InTech, Available from: http://www.intechopen.com/books/topics-on-drug-metabolism/anticancer-dru....

Publication types