Clinical Trial
. 2015 Feb 28;6(6):4428-39.
doi: 10.18632/oncotarget.2922.

Immunological response and overall survival in a subset of advanced renal cell carcinoma patients from a randomized phase 2/3 study of naptumomab estafenatox plus IFN-α versus IFN-α

Affiliations
Clinical Trial

Immunological response and overall survival in a subset of advanced renal cell carcinoma patients from a randomized phase 2/3 study of naptumomab estafenatox plus IFN-α versus IFN-α

Eyad Elkord et al. Oncotarget. .

Abstract

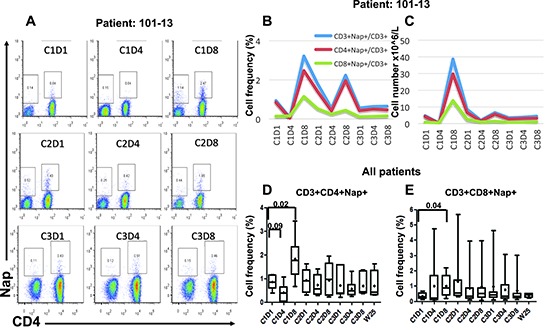
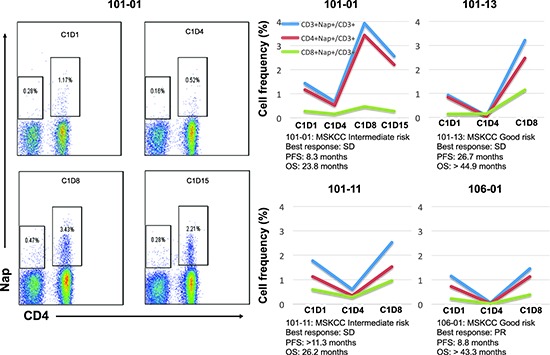
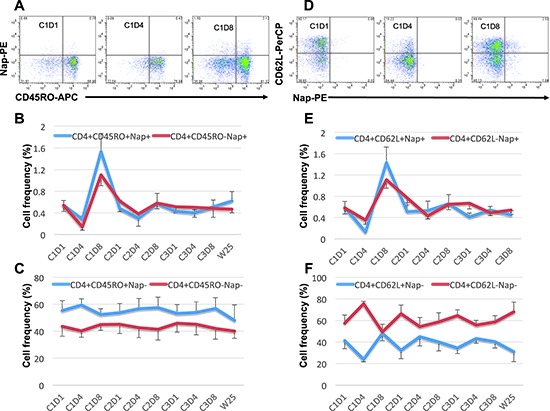
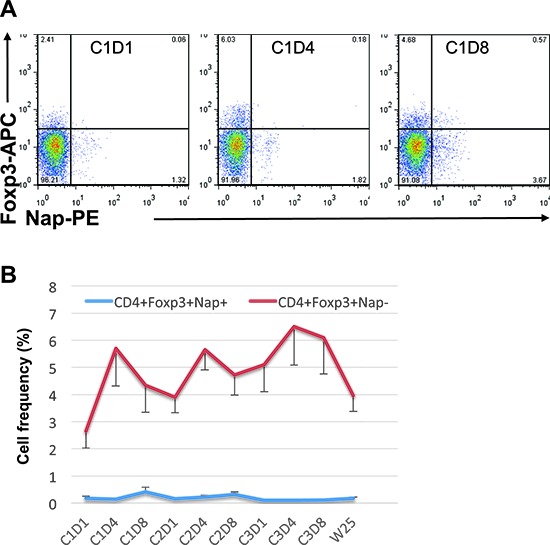
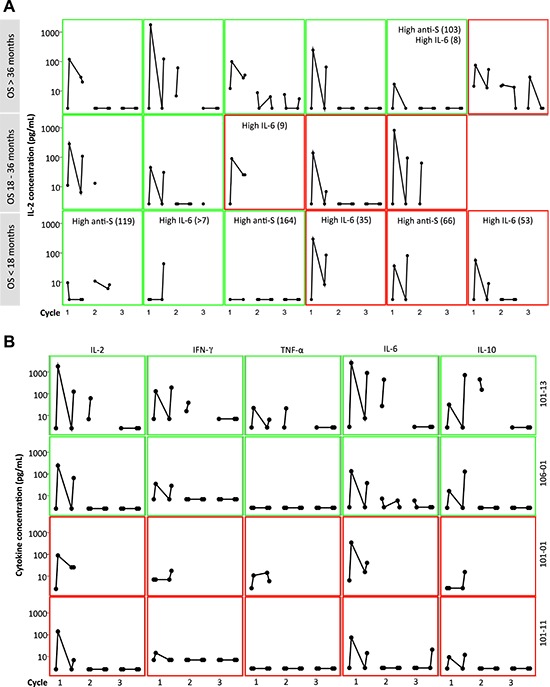
Naptumomab estafenatox/ABR-217620/ANYARA (Nap) has been evaluated in clinical phase 1 and 2/3 studies. RCC patients in the phase 2/3 trial were randomized 1:1 in an open label study to receive Nap+IFN-α or IFN-α. In this study, we analyzed the UK patients for their immunological response in relation to prolonged overall survival (OS). We found that Nap-specific T cells were reduced after 3 treatment days in patients' peripheral blood. Levels of both Nap-specific CD4+ and CD8+ T cells were significantly higher 8 days after the first treatment. Patients with such pattern of reduction and expansion of Nap-binding T cells also showed increased levels of IL-2 and IFN-γ in plasma 3 hours after the first Nap treatment. In addition, Nap caused an increase of IL-6, IL-10 and TNF-α. The patients in the UK subset showed a tendency of OS benefit after Nap treatment. Most Nap treated patients with long OS had low baseline IL-6 and normal levels of anti-SEA/E-120 antibodies. Furthermore, patients with pronounced Nap induced IL-2 and T cell expansion had long OS. In conclusion, patients with low baseline IL-6 and normal anti-SEA/E-120 may respond well to Nap by T cell activation and expansion paving the way for anti-tumour effects.


Conflict of interest statement

Conflict of interest

Anette Sundstedt, Örjan Nordle and Gunnar Hedlund are employees and hold shares in Active Biotech AB. Other authors have no conflict of interest.

Figures

Figure 1
Figure 1. Flow cytometric and overall plots showing the percentage of Nap-specific CD4+ and CD8+ (CD3+CD4) T cells in PBMCs of patients pre- and several time points after start of Nap treatment
Cells were gated on lymphocytes and CD3+ T cells. Flow cytometric plots for patient 101–13 are shown in (A). Absolute number of Nap-specific T cells was roughly estimated using the absolute numbers obtained from full blood counts. The overall percentages and absolute numbers of Nap-specific T cells for patient 101–13 are shown in (B and C), respectively. Box and whiskers plots showing minimum, maximum, lower and upper quartiles and median of CD3+CD4+Nap+ T cells (D) and CD3+CD8+Nap+ T cells (E) for all patients before and during/following Nap treatment. Means are shown with diamonds and the forks depict p-values for differences between time points.
Figure 2
Figure 2. The overall percentages of Nap-specific T cells for the four patients with the most pronounced changes in these subsets are shown before and during/after the first cycle of treatment
The flow cytometric plots show the levels of Nap-specific T cells of patient 101–01 before and three time points after treatment. Prognosis and clinical responses for these patients are depicted.
Figure 3
Figure 3. Expression of CD45RO and CD62L within CD4+Nap+/− T cells
Examples of flow cytometric plots in PBMCs of patient 101–13 pre and two time points during cycle 1 of treatment are shown in (A and D). Cells were gated on lymphocyte and CD4+ T cells. The figures show the mean percentage +/− SEM of CD45RO+/− within CD4+Nap+ (B) and CD4+Nap T cells (C); and the mean percentage +/− SEM of CD62L+/− within CD4+Nap+ (E) and CD4+Nap T cells (F) for all patients before and at all investigated time points during/following treatment.
Figure 4
Figure 4. Foxp3 expression within CD4+Nap+/− T cells
Example of flow cytometric plots in PBMCs of patient 101–13 pre and two time points during cycle 1 of treatment is shown in (A). Cells were gated on lymphocytes and CD4+ T cells. The figure shows the mean percentage +/− SEM of cells having Foxp3 expression within CD4+Nap+ and CD4+Nap T cells (B) for all patients before and at all investigated time points during/following treatment.
Figure 5
Figure 5. Cytokine response (pg/mL) in plasma at pre-dose and 3 hours after the first and second day of 3 cycles of Nap treatment. Green frame shows Good MSKCC risk score and red frame shows Intermediate MSKCC risk score
(A): IL-2 response in 17 of 18 patients from the UK. The patients were categorized according to their OS. Patients having over median of baseline anti-SEA/E-120 (High anti-S; > 53.5 pmol/mL) or IL-6 (High IL-6; > 7 pg/mL) are depicted. (B): IL-2, IFN-γ, TNF-α, IL-6 and IL-10 and response in the four patients with the most pronounced Nap-specific T lymphocyte reduction on day 4 and expansion on day 8 (patients 101–01, 101–11, 101–13 and 106–01).
Figure 6
Figure 6. Kaplan-Meier OS plots for the UK patients
(A) All UK-patients. HR (95% CI) = 0.56 (0.26, 1.19), p = 0.13 stratified for MSKCC risk score. The four patients with the most pronounced Nap-specific T lymphocyte reduction on day 4 and expansion on day 8 (patients 101–01, 101–11, 101–13 and 106–01) are depicted. (B) Intermediate MSKCC risk score patients. HR (95% CI) = 1.03 (0.36, 2.95), p = 0.95. Filled circle shows patient having below median of baseline anti-SEA/E-120 (<53.5 pmol/mL) and IL-6 (<7 pg/mL). (C) Good MSKCC risk score patients. HR (95% CI) = 0.32 (0.11, 0.93), p = 0.029. Filled circle shows patient having below median of baseline anti-SEA/E-120 (<53.5 pmol/mL) and IL-6 (<7 pg/mL). Open circle shows that baseline anti-SEA/E-120 and IL-6 is missing.

References

    1. Abe H, Kamai T. Recent advances in the treatment of metastatic renal cell carcinoma. Int J Urol. 2013;20:944–55. - PubMed
    1. Eisen T, Hedlund G, Forsberg G, Hawkins R. Naptumomab estafenatox: targeted immunotherapy with a novel immunotoxin. Curr Oncol Rep. 2014;16:370. - PMC - PubMed
    1. Dohlsten M, Abrahmsén L, Björk P, Lando PA, Hedlund G, Forsberg G, Brodin T, Gascoigne NR, Förberg C, Lind P, Kalland T. Monoclonal antibody-superantigen fusion proteins: tumor-specific agents for T-cell-based tumor therapy. Proc Natl Acad Sci U S A. 1994;91:8945–9. - PMC - PubMed
    1. Dohlsten M, Hedlund G, Akerblom E, Lando PA, Kalland T. Monoclonal antibody-targeted superantigens: a different class of anti-tumor agents. Proc Natl Acad Sci U S A. 1991;88:9287–91. - PMC - PubMed
    1. Dohlsten M, Hansson J, Ohlsson L, Litton M, Kalland T. Antibody-targeted superantigens are potent inducers of tumor-infiltrating T lymphocytes in vivo. Proc Natl Acad Sci U S A. 1995;92:9791–5. - PMC - PubMed

Publication types

MeSH terms