. 2015 Feb 9;27(2):257-70.
doi: 10.1016/j.ccell.2014.12.006.

Glutamate dehydrogenase 1 signals through antioxidant glutathione peroxidase 1 to regulate redox homeostasis and tumor growth

Affiliations

Glutamate dehydrogenase 1 signals through antioxidant glutathione peroxidase 1 to regulate redox homeostasis and tumor growth

Lingtao Jin et al. Cancer Cell. .

Abstract

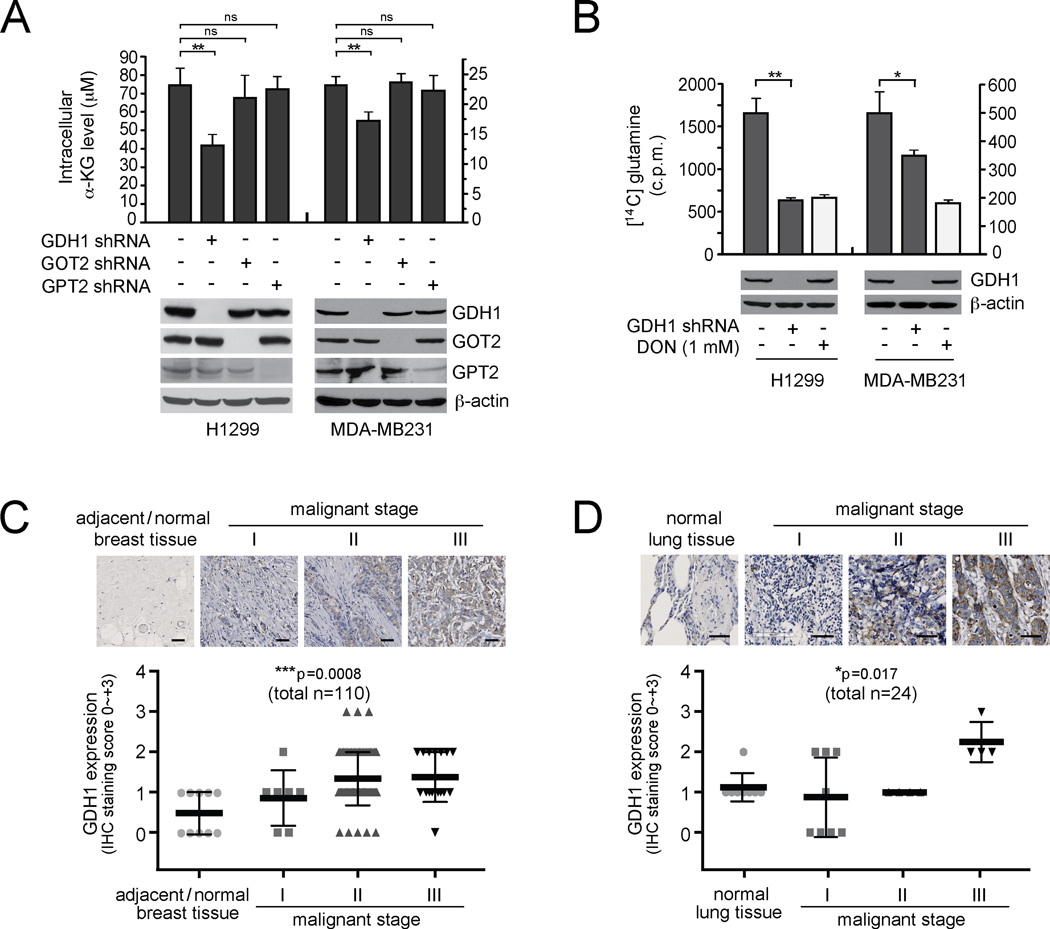
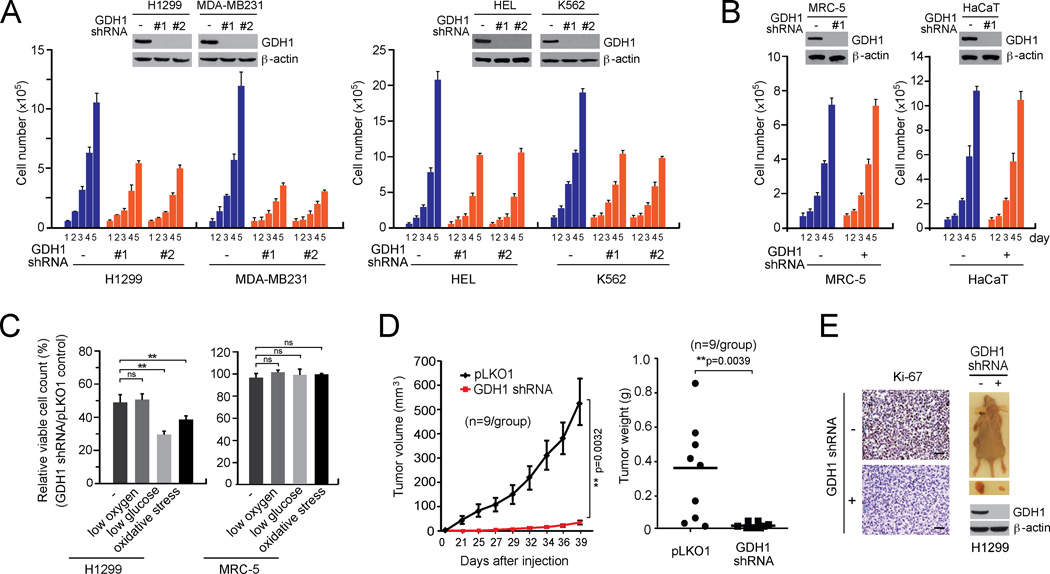
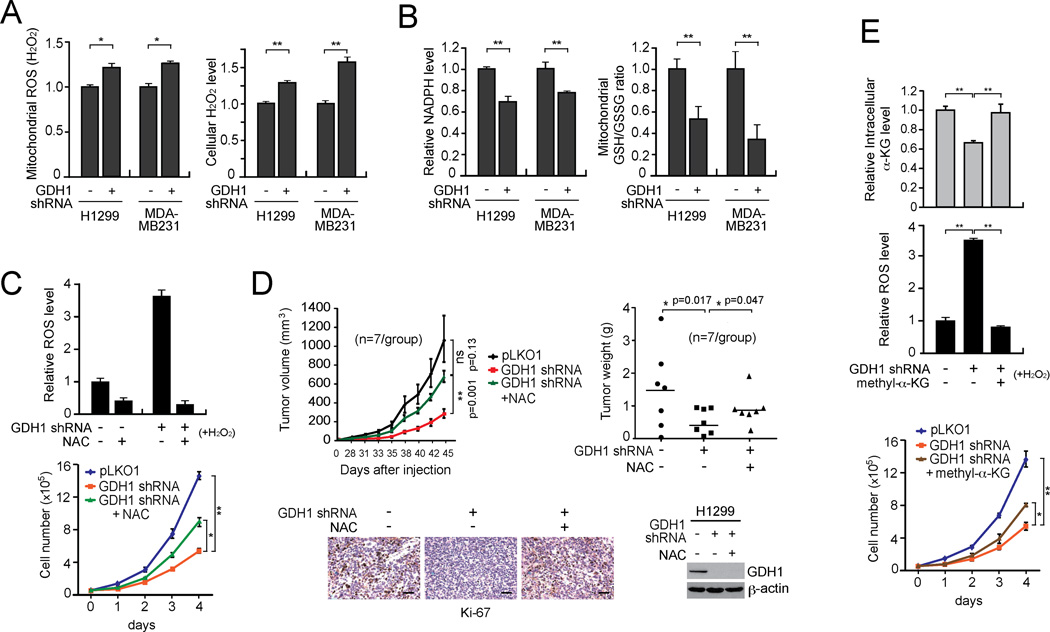
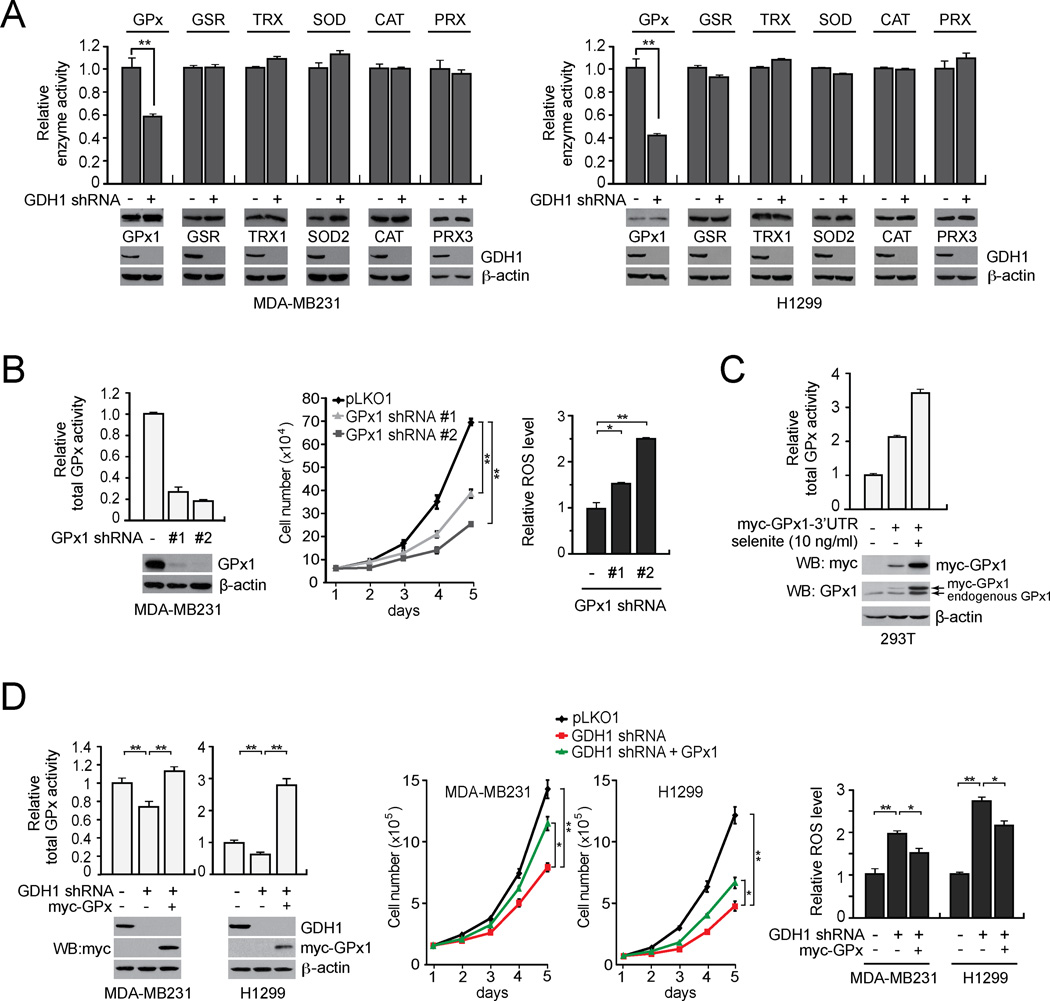
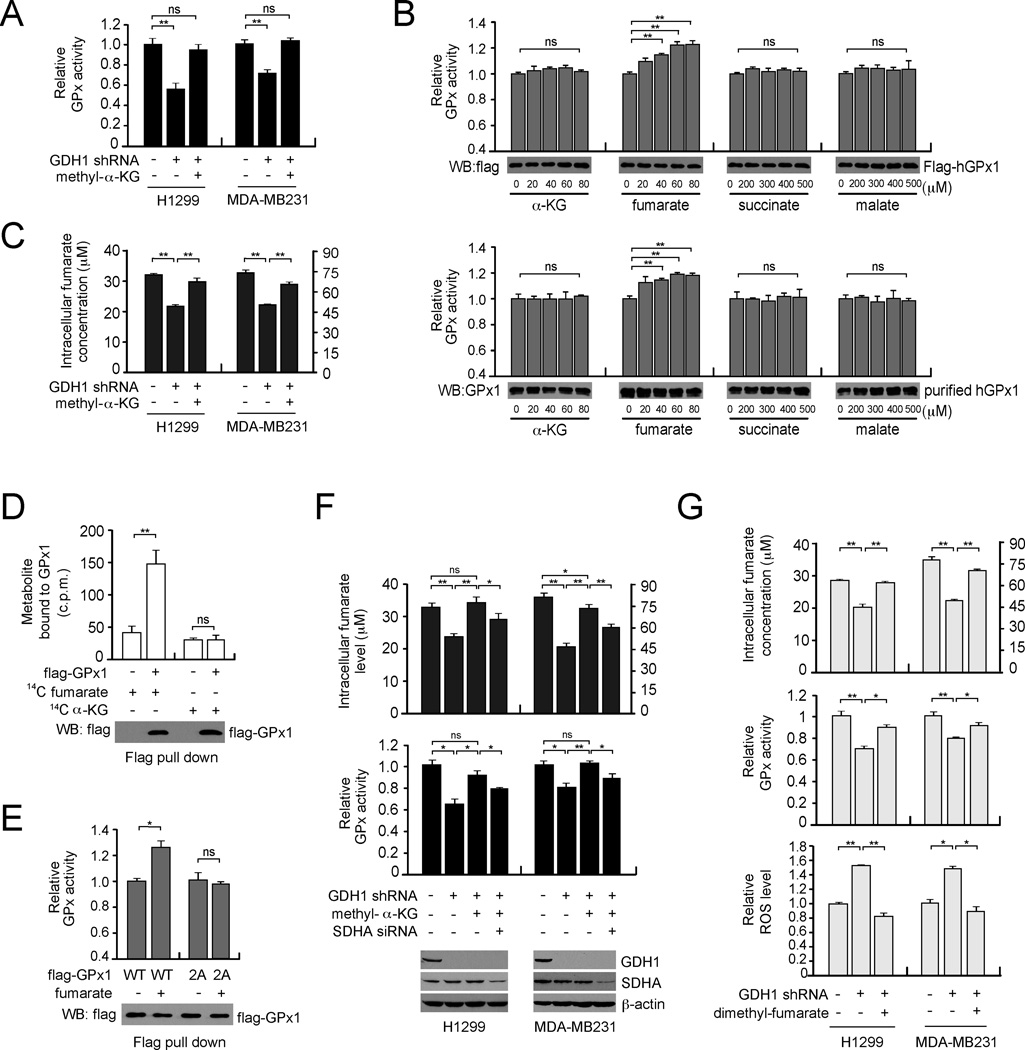
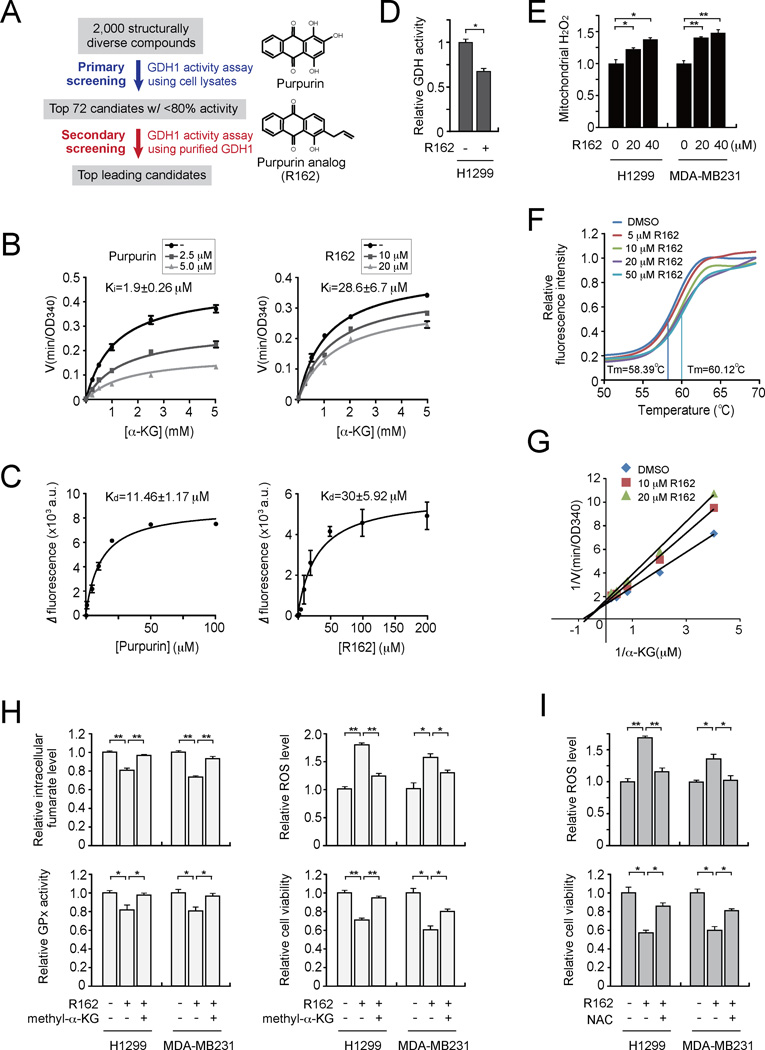
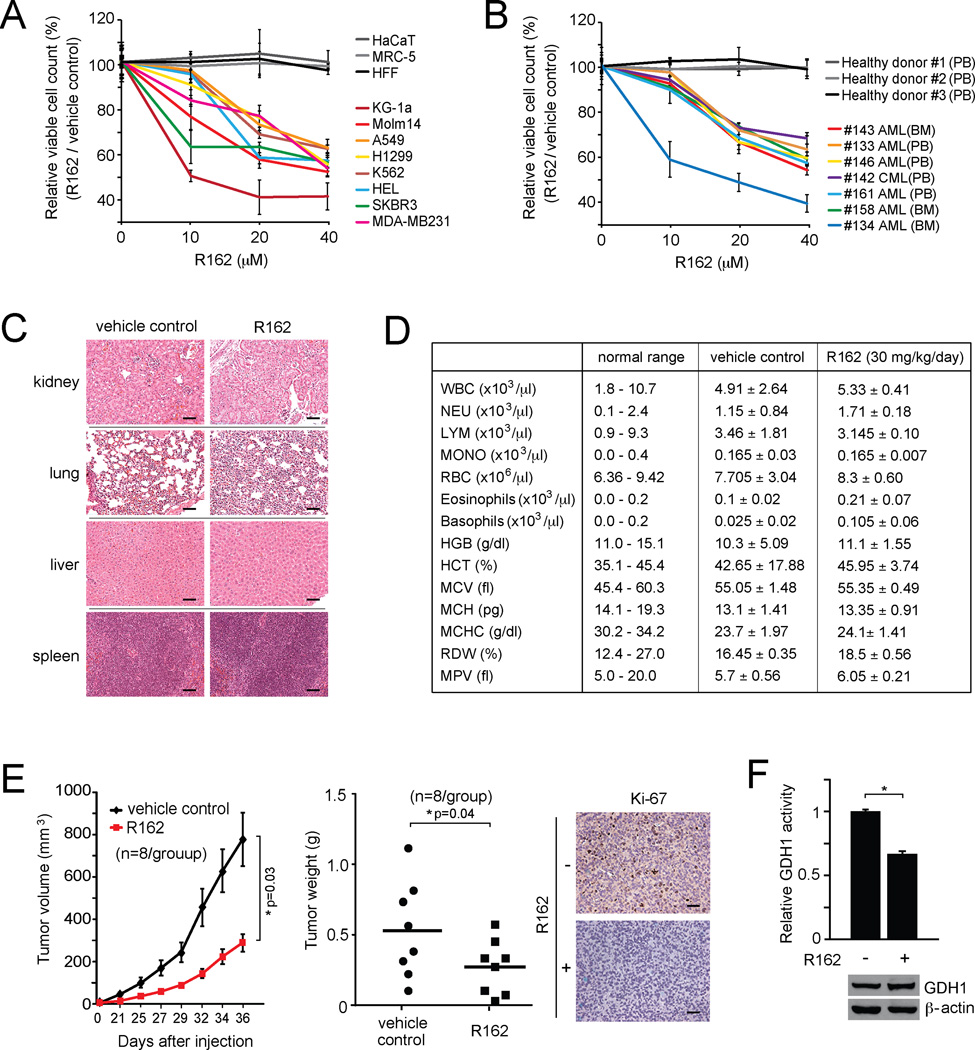
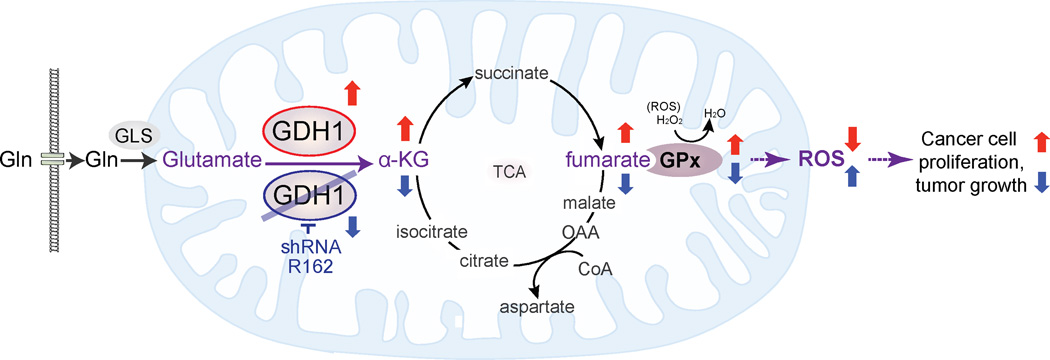
How mitochondrial glutaminolysis contributes to redox homeostasis in cancer cells remains unclear. Here we report that the mitochondrial enzyme glutamate dehydrogenase 1 (GDH1) is commonly upregulated in human cancers. GDH1 is important for redox homeostasis in cancer cells by controlling the intracellular levels of its product alpha-ketoglutarate and subsequent metabolite fumarate. Mechanistically, fumarate binds to and activates a reactive oxygen species scavenging enzyme glutathione peroxidase 1. Targeting GDH1 by shRNA or a small molecule inhibitor R162 resulted in imbalanced redox homeostasis, leading to attenuated cancer cell proliferation and tumor growth.


Figures

Figure 1
Figure 1. GDH1 predominantly regulates α-KG production in cancer cells and is upregulated in human lung and breast cancers
(A) Intracellular α-KG levels were determined in human lung cancer H1299 and breast cancer MDA-MB231 cells with stable knockdown of GDH1, GOT2, or GPT2. Expression of GDH1, GOT2 and GPT2 in H1299 and MDA-MB231 cells are shown by Western blot analyses. β-actin was used as a loading control. (B) Glutaminolytic rates in H1299 and MDA-MB231 cells were determined with stable knockdown of GDH1 or control cells harboring an empty vector. DON (6-diazo-5-oxo-I-norleucine), glutamine antagonist, was used as a positive control. GDH1 expression is shown by Western blotting. Data are mean ± SD from three replicates of each sample and p values were determined by a two-tailed paired Student’s t test for panels 1A and 1B (ns: not significant; *: 0.01 < p < 0.05; **: 0.001 < p < 0.01). (C–D) Immunohistochemistry analyses of GDH1 expression in groups of primary human tissue specimens. Tissue microarrays of breast ductal carcinoma (C) and lung cancer (D) were obtained from US biomax. Scale bars = 50 µm. Data are mean ± SD. p values were obtained by ANOVA test. (*: 0.01 < p < 0.05; ***: p < 0.001).
Figure 2
Figure 2. GDH1 is important for cancer cell proliferation and tumor growth
(A–B) Cell proliferation rates were determined by cell counting in H1299 and MDA-MB231 tumor cells (A; left), HEL and K562 leukemia cells (A; right) and MRC-5 and HaCaT (B) with stable knockdown of GDH1, compared to control cells expressing an empty vector. Expression of GDH1 in cells transduced with GDH1 shRNA clones are shown by Western blot analyses. (C) Effect of GDH1 knockdown on cell proliferation rates were measured under stress conditions including low oxygen (1% O2), low glucose (0.5 mM glucose) and oxidative stress (15 µM H2O2). (D) Effect of GDH1 knockdown on tumor growth potential of H1299 cell xenograft mice. Left: Tumor size was monitored every 2–3 days for 6 weeks. The error bars represent SEM. Right: Tumor weights were examined at the experimental endpoint. (E) Left: Representative pictures of IHC staining to detect Ki-67 expression in tumors harvested from vector control group or GDH1 knockdown group. Scale bars = 50 µm. Right: Representative dissected tumors and GDH1 expression in tumor lysates are shown. Data are mean ± SD from three replicates of each sample except panels D and E. p values were determined by a twotailed Student’s t test for panel C and a two-tailed paired Student’s t test for panel D (ns: not significant; **: 0.001 < p < 0.01). See also Figure S1.
Figure 3
Figure 3. GDH1 contributes to redox homeostasis in cancer cells
(A–B) Mitochondrial ROS and cellular H2O2 levels (A), NADPH levels and mitochondrial GSH/GSSG ratio (B) were determined in H1299 and MDA-MB231 cells with GDH1 knockdown or control cells with an empty vector. (C) H1299 cells with GDH1 knockdown were treated with anti-oxidant agent NAC (1 mM). ROS (upper) and cell proliferation (lower) were measured. (D) NAC (10 mg/ml drinking water) was administrated in H1299 xenograft mice with GDH1 knockdown. Upper left: Tumor growth was monitored. The error bars represent SEM. Upper right: Tumor weights were examined at the experimental endpoint. Lower left: Representative pictures of Ki-67 IHC staining of tumor samples. Scale bars = 50 µm. Lower right: GDH1 expression in tumor lysates is shown. (E) H1299 cells were treated in the presence and absence of 0.5 mM methyl-α-KG. Intracellular α-KG level (upper), ROS production (middle) and proliferation rates (lower) were determined as described above. Data are mean ± SD from three replicates except panel D. p values were determined by a two-tailed Student’s t test (ns: not significant; *: 0.01 < p < 0.05; **: 0.001 < p < 0.01). See also Figure S2.
Figure 4
Figure 4. GDH1 contributes to redox homeostasis in part by regulating glutathione peroxidase (GPx) activity in cancer cells
(A) Effect of GDH1 knockdown on the enzyme activity of GPx and other ROS scavenging enzymes including GSR, TRX, SOD, CAT and PRX in MDA-MB231 (left) and H1299 (right) cells. Western blots displaying the expression of GPx1, GSR, TRX1, SOD2, CAT, PRX3 and GDH1 in cells with GDH1 stable knockdown or an empty vector. β-actin was used as a loading control. (B) Effect of GPx1 knockdown on total GPx activity (left), cell proliferation (middle) and ROS (right) in MDA-MB231 cancer cells. Knockdown efficiency of GPx1 was determined by Western blotting. Cell proliferation rates and ROS levels were assessed by cell counting and carboxy-H2DCFDA detection, respectively. (C) Induction of GPx1 expression in 293T cells transduced with a GPx1 expression construct harboring a 3’UTR with a SECIS element that responds to selenite. Expression of myc tagged GPx1 was determined by immunoblotting using anti-myc and anti-GPx1 antibodies. (D) Effect of myc-GPx1 stable expression on the total cellular GPx activity (left), cell proliferation (middle) and ROS (right) in MDA-MB231 and H1299 cells with stable knockdown of GDH1. 10 ng/ml selenite was added in the culture media for all the assays. GDH1 knockdown and myc-GPx1 expression is shown by Western blot analyses. Data are mean ± SD from three replicates. p values were determined by a two-tailed Student’s t test (*0.01 < p < 0.05; **0.001 < p < 0.01). See also Figure S3.
Figure 5
Figure 5. GDH1 promotes GPx activity by controlling intracellular fumarate level
(A) GPx activity in cancer cells with stable knockdown of GDH1 was determined in the presence or absence of cell-permeable methyl-α-KG. (B) The activity of purified flag-GPx1 from 293T cells or endogenous GPx1 from human erythrocytes was examined in the presence of increasing concentrations of α-KG, fumarate, succinate or malate. Western blot analyses show GPx1 input for each sample. (C) Effect of methyl-α-KG treatment on intracellular fumarate level in GDH1 knockdown cells. (D) Flag-GPx1 was pulled down from transfected 293T cell lysates and incubated with 14C-fumarate or 14C-α-KG. The unbound metabolites were washed away and retained fumarate or α-KG was measured using a scintillation counter. Western blot analysis shows GPx1 input for each sample. (E) The activity of purified flag-GPx1 wild-type (WT) or fumarate binding deficient mutant flag-GPx1 T143A/D144A (2A) from 293T cells was examined in the presence of fumarate (80 µM). Western blot analysis shows GPx1 input for each sample. (F) Intracellular fumarate levels (upper) and relative enzyme activity of endogenous GPx (lower) in GDH1 knockdown cells were determined in the presence or absence of methyl-α-KG and SDHA siRNA. Knockdown of GDH1 and SDHA is shown by Western blot analyses. (G) Intracellular fumarate levels (upper), GPx activity (middle) and ROS levels (lower) in cancer cells with stable knockdown of GDH1 were determined in the presence or absence of cell-permeable dimethyl-fumarate. Data are mean ± SD from three replicates. p values were determined by two-tailed Student’s t test (ns: not significant; *0.01 < p < 0.05; **0.001 < p < 0.01). See also Figure S4.
Figure 6
Figure 6. Identification and characterization of R162 as a small molecule inhibitor of GDH1
(A) Left: Schematic illustration of screening strategies used to identify lead compounds as GDH1 inhibitors. Right: Structures of purpurin and its derivative R162. (B) Activity of purified GDH1 in the presence of different concentrations of α-KG and purpurin (left) or R162 (right). (C) Kd values were determined by tryptophan fluorescence binding assay. Purified GDH1 was incubated with increasing concentrations of purpurin (left) or R162 (right). (D) GDH activity was determined in cancer cells treated with R162 (20 µM). (E) Mitochondrial ROS levels were determined in H1299 and MDA-MB231 cells in the presence of R162. (F) Thermal shift melting curve of purified GDH1 incubated with increasing concentrations of R162. Melting temperature (Tm) of DMSO control and 50 µM R162 are indicated. (G) Lineweaver-Burk plot of GDH activity in the presence of increasing concentrations of R162 and α-KG. (H) Effects of methyl-α-KG treatment (1 mM) on intracellular fumarate level (upper left), GPx activity (lower left), ROS level (upper right) and cell proliferation (lower right) in R162-treated H1299 and MDA-MB231 cells were examined. (I) Effect of NAC treatment (3 mM) on ROS level (upper) and cell proliferation (lower) in R162-treated cells. Data are mean ± SD from three replicates. p values were determined by a two-tailed Student’s t test (*0.01 < p < 0.05; **0.001 < p < 0.01). See also Figure S5.
Figure 7
Figure 7. R162 inhibits cell proliferation and tumor growth potential of human cancer cells
(A) Cell viability of diverse human tumor and leukemia cells in the presence of R162. Control cells include HaCaT, MRC-5 and HFF. (B) Effect of R162 treatment on cell viability of human primary leukemia cells from patients with myeloid leukemia. Peripheral blood cells from healthy donors were included as controls. BM: bone marrow; PB: peripheral blood; AML: Acute myeloid leukemia; CML: Chronic myeloid leukemia. (C) Histological analysis of hematoxylin-eosin stained tissue sections of representative mice in R162 or vehicle control treated group. Scale bars = 50 µm. Mice were treated with R162 (30 mg/kg/day) for 30 days. (D) Hematology blood test of R162 or vehicle control treated mice. (E) Effect of R162 administration on tumor growth in H1299 xenograft mice model. Left: Tumor growth was monitored. The error bars represent SEM. Middle: Tumor weight was examined at the experimental endpoint. Right: Representative pictures of Ki-67 IHC staining of tumor samples from control or R162 treatment group. Scale bars = 50 µm. (F) GDH1 protein and activity levels were determined in dissected tumor samples. Representative pictures of dissected tumors are shown. GDH1 expression in tumor lysates is shown by Western blotting. Data are mean values ± SD from three replicates except panels C and E. p values were determined by a two-tailed Student’s t test (*0.01 < p < 0.05).
Figure 8
Figure 8. Proposed model for the role of GDH1 in cancer metabolism
Upregulated GDH1 in cancer cells is critical to maintain the physiological levels of α-KG and consequently fumarate. Fumarate may in turn bind to and activate the ROS scavenging enzyme GPx to regulate redox homeostasis, which provides a proliferative advantage to cancer cells and tumor growth. In contrast, suppression of GDH1 decreased α-KG and fumarate levels, leading to reduced GPx activity and subsequently elevated ROS that attenuates cancer cell proliferation and tumor growth.

References

    1. Boonstra J, Post JA. Molecular events associated with reactive oxygen species and cell cycle progression in mammalian cells. Gene. 2004;337:1–13. - PubMed
    1. DeBerardinis RJ, Cheng T. Q's next: the diverse functions of glutamine in metabolism, cell biology and cancer. Oncogene. 2010;29:313–324. - PMC - PubMed
    1. DeBerardinis RJ, Mancuso A, Daikhin E, Nissim I, Yudkoff M, Wehrli S, Thompson CB. Beyond aerobic glycolysis: transformed cells can engage in glutamine metabolism that exceeds the requirement for protein and nucleotide synthesis. Proc Natl Acad Sci U S A. 2007;104:19345–19350. - PMC - PubMed
    1. Dickinson BC, Chang CJ. A targetable fluorescent probe for imaging hydrogen peroxide in the mitochondria of living cells. Journal of the American Chemical Society. 2008;130:9638–9639. - PMC - PubMed
    1. Dickinson BC, Lin VS, Chang CJ. Preparation and use of MitoPY1 for imaging hydrogen peroxide in mitochondria of live cells. Nature protocols. 2013;8:1249–1259. - PMC - PubMed

Publication types

MeSH terms