. 2015 Feb 10;8(363):ra15.
doi: 10.1126/scisignal.2005667.

Activation of TRPV1 channels inhibits mechanosensitive Piezo channel activity by depleting membrane phosphoinositides

Affiliations

Activation of TRPV1 channels inhibits mechanosensitive Piezo channel activity by depleting membrane phosphoinositides

Istvan Borbiro et al. Sci Signal. .

Abstract

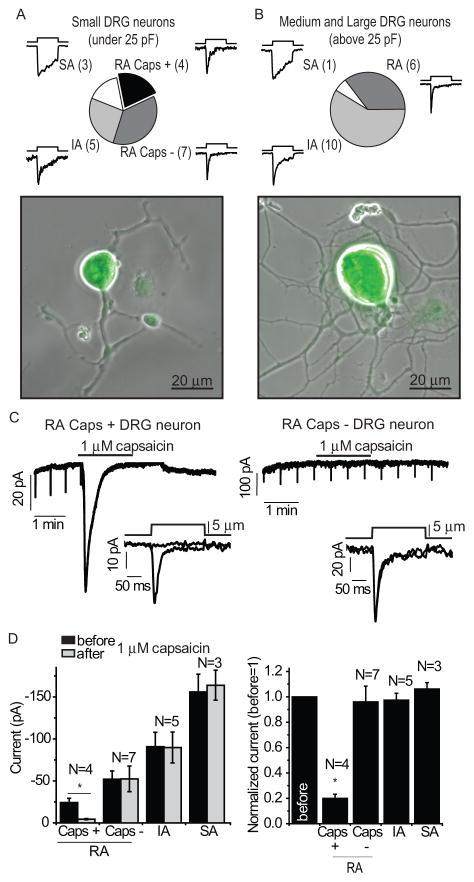
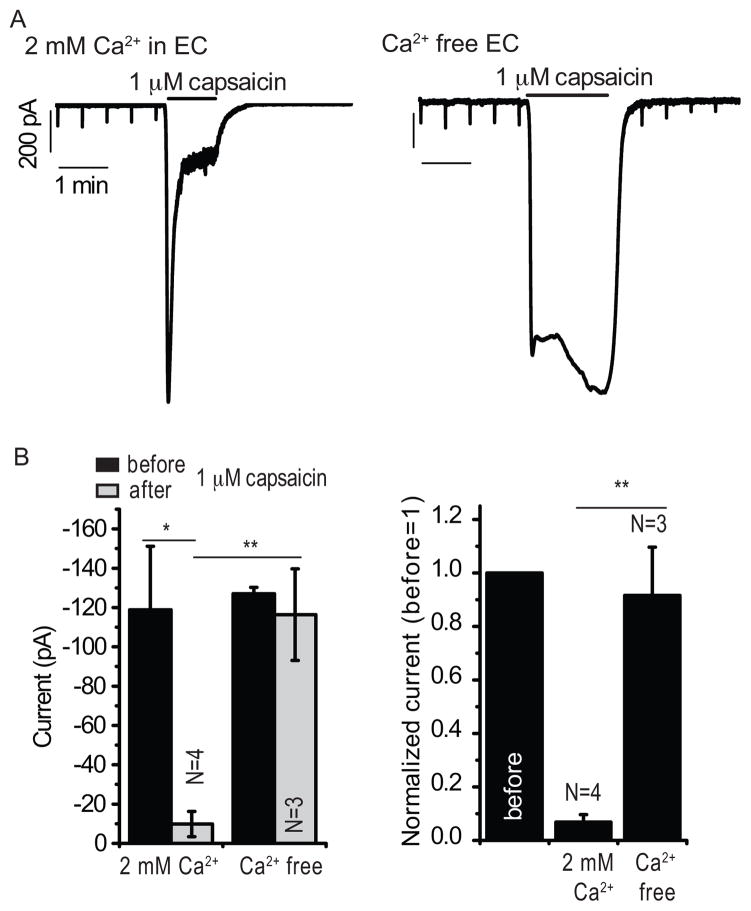
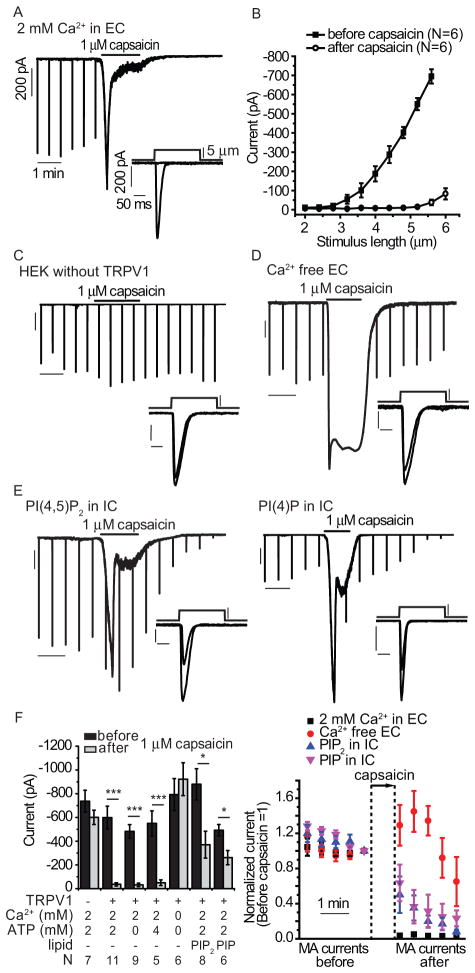
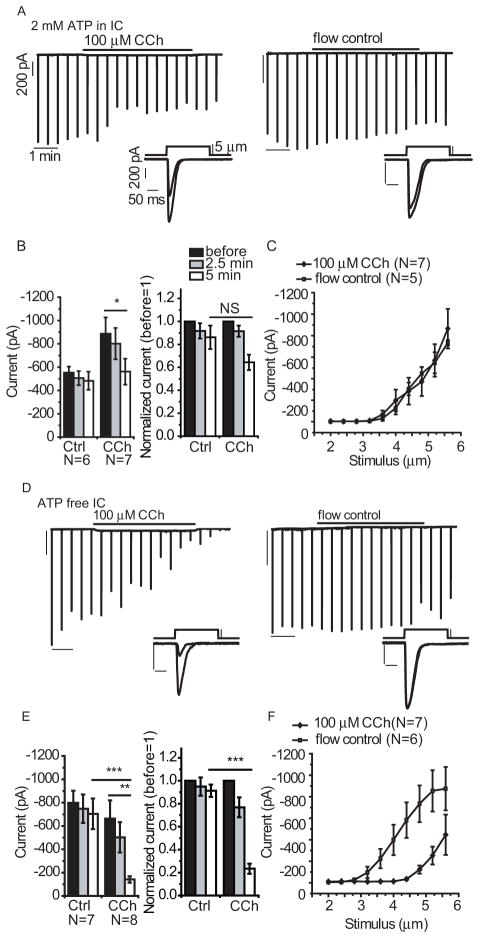
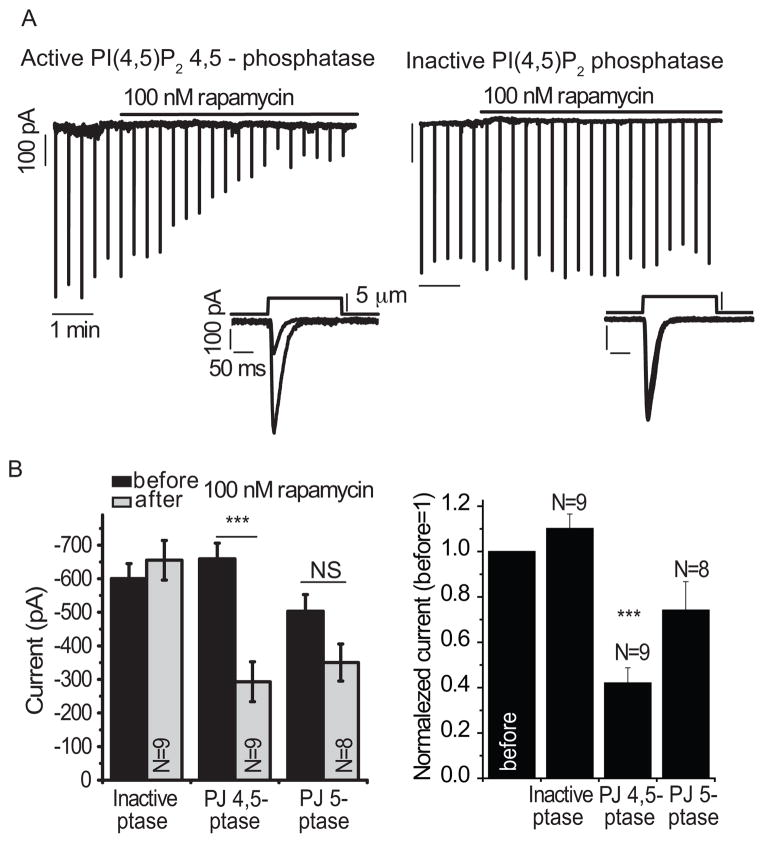
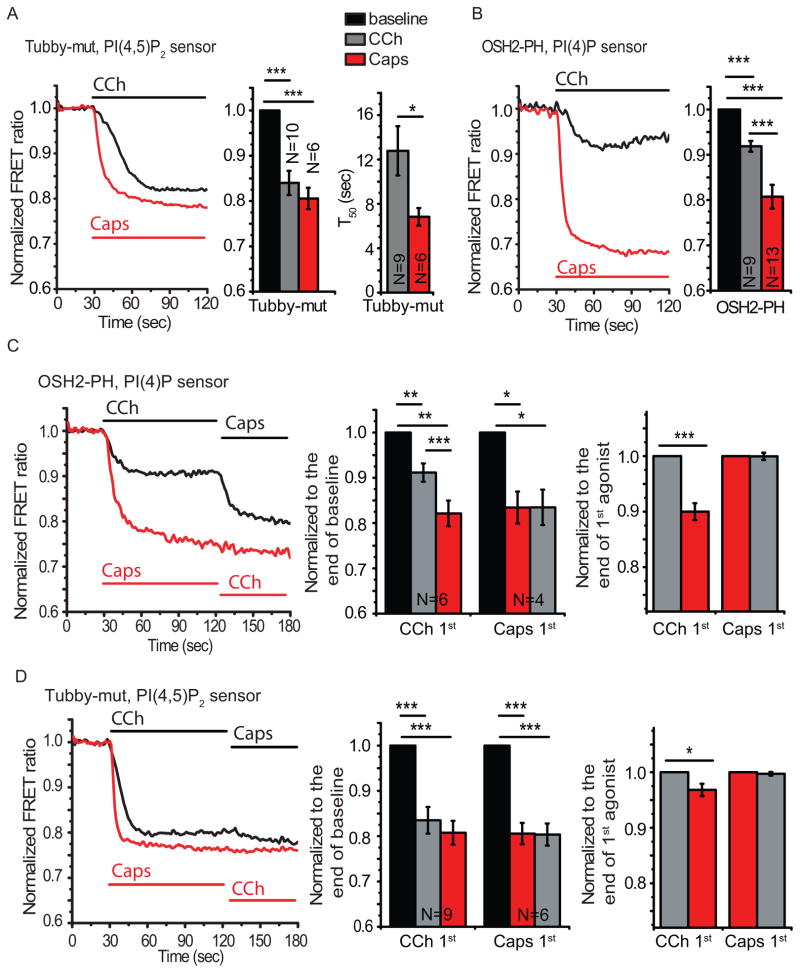
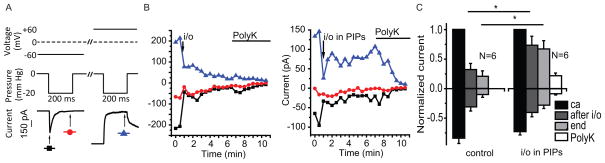
Capsaicin is an activator of the heat-sensitive TRPV1 (transient receptor potential vanilloid 1) ion channels and has been used as a local analgesic. We found that activation of TRPV1 channels with capsaicin either in dorsal root ganglion neurons or in a heterologous expression system inhibited the mechanosensitive Piezo1 and Piezo2 channels by depleting phosphatidylinositol 4,5-bisphosphate [PI(4,5)P2] and its precursor phosphatidylinositol 4-phosphate [PI(4)P] from the plasma membrane through Ca(2+)-induced phospholipase Cδ (PLCδ) activation. Experiments with chemically inducible phosphoinositide phosphatases and receptor-induced activation of PLCβ indicated that inhibition of Piezo channels required depletion of both PI(4)P and PI(4,5)P2. The mechanically activated current amplitudes decreased substantially in the excised inside-out configuration, where the membrane patch containing Piezo1 channels is removed from the cell. PI(4,5)P2 and PI(4)P applied to these excised patches inhibited this decrease. Thus, we concluded that Piezo channel activity requires the presence of phosphoinositides, and the combined depletion of PI(4,5)P2 and PI(4)P reduces channel activity. In addition to revealing a role for distinct membrane lipids in mechanosensitive ion channel regulation, these data suggest that inhibition of Piezo2 channels may contribute to the analgesic effect of capsaicin.


Conflict of interest statement

Competing interests: The authors declare no competing interests.

Figures

Figure 1
Figure 1
The effects of capsaicin on whole-cell MA currents in DRG neurons isolated from TRPV1 reporter mice. (A) Pie chart showing the distribution of the rapidly adapting (RA), intermediate adapting (IA), and slowly adapting (SA) MA currents in small YFP-positive neurons. The RA group is subdivided into cells that respond to 1 μM capsaicin with large inward currents (Caps +) and cells that did not (Caps −). The numbers in parenthesis are the number of neurons tested in each group. None of the IA and SA cells responded to capsaicin. (B) Pie chart showing the distribution of the different types of MA currents in medium and large YFP-positive neurons. None of these neurons responded to capsaicin. Bottom panels in A and B show overlay of fluorescent and phase contrast images of a small and large neuron, respectively. (C) A representative traces recorded at −60 mV with mechanical stimulation every 30 seconds in a capsaicin-responsive neuron (left) and a nonresponsive neuron (right); the application of 1 μM capsaicin is indicated by the horizontal bars. The downward spikes correspond to the individual MA current evoked by the repetitive mechanical stimuli. Insets show individual MA currents on enlarged time scales before and after the application of capsaicin; the mechanical step protocol, indicating the displacement of the mechanical probe is also shown. (D) Statistical analysis for small neurons showing the raw data (left) and normalized data (right) of peak MA currents measured before and after capsaicin. * p<0.05, Analysis of Variance (ANOVA)
Figure 2
Figure 2
The effects of TRPV1 activation on Piezo2-mediated MA currents. HEK293 cells were transiently cotransfected with Piezo2 and TRPV1, and MA currents were measured in whole-cell patch clamp experiments at −60 mV. (A) Cellular responses to repeated mechanical stimuli applied every 30 seconds recorded with application of 1 μM capsaicin in 2 mM Ca2+ containing (left) and Ca2+ free (right) extracellular (EC) solution. (B) Statistical analysis shows raw data (left) and normalized data (right) before and after the application of capsaicin. *p<0.05, **p<0.01, ANOVA
Figure 3
Figure 3
The effects of TRPV1 activation on Piezo1-mediated MA currents. HEK293 cells were transiently cotransfected with Piezo1 and TRPV1, and MA currents were measured in whole-cell patch clamp experiments at −60 mV. (A) Responses to repeated mechanical stimuli applied every 30 seconds recorded with the application of 1 μM capsaicin as indicated. Insets throughout the figure show individual MA currents in response to a mechanical step of the same experiment before and after the application of capsaicin. Scale indicator lines identical to those in this panel were used throughout the figure. (B) Stimulus-response curves before and after the application of capsaicin. (C) Representative trace in a cell not transfected with TRPV1. (D) Representative trace of a Piezo1 and TRPV1 cotransfected cell assayed in the absence of extracellular Ca2+. (E) Representative trace of a Piezo1 and TRPV1 cotransfected cell assayed in normal extracellular (2 mM) Ca2+ with 40 μM PI(4,5)P2 (left) or 40 μM PI(4)P (right) in the intracellular (IC) solution. (F) Left: statistical summary of current amplitudes before and after the application of capsaicin including those measured in the presence of the indicated concentrations of MgATP in the patch pipette. Right: the time course of the effect of PI(4,5)P2 (PIP2), PI(4)P (PIP), and Ca2+-free EC solution. Data in all measurements were normalized to the current amplitudes before the application of capsaicin, individual MA current amplitudes every 30 seconds are shown (mean ± SEM). Capsaicin (1 μM) was applied for 120 sec in most measurements (range 60 – 150 s). To obtain comparable time courses, the time scale of each measurement was synchronized again to the first point after the washout of capsaicin. *p<0.05, ***p<0.001, ANOVA
Figure 4
Figure 4
The effects of hM1 activation on Piezo1-mediated MA currents. HEK293 cells were transiently cotransfected with Piezo1 and hM1 and MA currents were measured in whole-cell patch clamp experiments at −60 mV with mechanical stimuli applied every 30 seconds. (A) Representative traces for experiments with 2 mM ATP-containing IC solution in the patch pipette with 5-minute application of 100 μM carbachol (CCh) (left) and control solution (right). Insets show individual MA currents recorded before and after 5-minute carbachol application or at identical times for the control cell. Scale indicator lines identical to those in this panel were used throughout the figure. (B) Statistical analysis of carbachol-treated and control groups using raw data (left) and normalized data (right) before and after 2.5 and 5 minutes of carbachol application. (C) Stimulus response curves recorded in carbachol-treated and flow control groups with increasing steps of mechanical stimuli. (D–F) Identical experiments and data analysis with ATP-free IC solution in the patch pipette. *p<0.05, **p<0.01, ***p<0.001, NS not significant (p=0.101), ANOVA
Figure 5
Figure 5
The effects of rapamycin-induced plasma membrane translocation of the PI(4,5)P2 4,5-phosphatase pseudojanin on Piezo1-mediated MA currents. HEK293 cells were cotransfected with Piezo1 and components of the pseudojanin system; MA currents were measured in whole-cell patch clamp experiments at −60 mV with mechanical stimuli applied every 30 seconds. (A) Representative traces show responses to 100 nM rapamycin during repeated mechanical stimuli in cells expressing Piezo1 and the active PI(4,5)P2 4,5-phosphatase pseudojanin (left) or the inactive PI(4,5)P2 phosphatase (right). Insets show individual MA current traces before and after the application of rapamycin. (B) Plots of raw data (left) and normalized data (right) show statistical analysis of peaks of MA currents in cells transfected with inactive or active PI(4,5)P2 4,5-phosphatase (inactive ptase, PJ 4,5-ptase) or active PI(4,5)P2 5-phosphatase (PJ 5-ptase) before and after 5 minutes of rapamycin application. ***p<0.001, NS not significant (p=0.128); ANOVA and t-test
Figure 6
Figure 6
Fluorescence-based PI(4,5)P2 and PI(4)P measurements in HEK cells cotransfected with hM1 or TRPV1 and phosphoinositide sensors. (A) FRET measurements in cells expressing the Tubby-mut PI(4,5)P2 sensor. Left panel shows individual traces in response to 100 μM carbachol (CCh) in an hM1-transfected cell and in response to 1 μM capsaicin in a TRPV1-transfected cell. Middle panel show statistical analysis of FRET ratios, right panel shows FRET decay half times for cells exposed to carbachol or capsaicin. (B) Individual FRET measurements in cells expressing the OSH2-PH domain PI(4)P sensor and either hM1 or TPRV1 (left) and statistical analysis of FRET ratios (right). (C) FRET measurements in cells cotransfected with the OSH2-PH sensor and both TRPV1 and hM1. The sequential applications of 1 μM capsaicin and 100 μM carbachol are indicated by the horizontal lines in the representative traces (left). Statistical analyses of OSH2-PH FRET ratios normalized to the baseline (middle) or to the end of first agonist application (right) are shown. (D) FRET measurements in cells cotransfected with the Tubby-mut PI(4,5)P2 sensor and both TRPV1 and hM1. Data are presented as in panel C. *p<0.05, **p<0.01, ***p<0.001, ANOVA, t-test
Figure 7
Figure 7
The effects of PI(4,5)P2 and PI(4)P on Piezo1-mediated MA currents in excised inside-out patches in HEK293 cells transfected with Piezo1. (A) Voltage (upper) and pressure (middle) protocols and representative MA currents (lower). The holding potential was 0 mV, a 3s long voltage step to −60 mV was applied, during which a 200 ms long negative pressure pulse was used to elicit MA currents; 15 s later a second 3 s voltage step to +60 mV was applied during which the MA currents were induced with a −20 mmHg pressure step. The protocol was repeated every 30 s. (A, lower) Individual traces with marks showing peak currents (black square) and the currents at the end of the pressure step (red circle) at −60 mV, and peak currents (blue triangle) at +60 mV, which were plotted in panel B. (B) Representative MA peaks and end currents (as marked in the lower part of A) measured when patches were excised (i/o) into control bath solution (left), or a bath solution containing 10 μM PI(4,5)P2 and 10 μM PI(4)P (PIPs) (right). At the time periods indicated by the horizontal lines the patch was perfused with 30 μg/ml Poly-lysine (Poly K). (C) Statistical summary of peak MA currents recorded at −60 mV (downward bars) and +60 mV (upward bars) in the cell attached configuration (ca), after excision (i/o), 5 minutes after excision (end), and after application of 30 μg/ml Poly-lysine (PolyK). All data were normalized to the cell-attached current values at +60 mV *p<0.05, ANOVA

Comment in

References

    1. Sachs F. Stretch-activated ion channels: what are they? Physiology (Bethesda) 2010;25:50–56. - PMC - PubMed
    1. Delmas P, Coste B. Mechano-gated ion channels in sensory systems. Cell. 2013;155:278–284. - PubMed
    1. Nilius B. Pressing and squeezing with Piezos. EMBO Rep. 2010;11:902–903. - PMC - PubMed
    1. Coste B, Mathur J, Schmidt M, Earley TJ, Ranade S, Petrus MJ, Dubin AE, Patapoutian A. Piezo1 and Piezo2 are essential components of distinct mechanically activated cation channels. Science. 2010;330:55–60. - PMC - PubMed
    1. Bae C, Gottlieb PA, Sachs F. Human PIEZO1: removing inactivation. Biophys J. 2013;105:880–886. - PMC - PubMed

Publication types

MeSH terms

LinkOut - more resources