. 2015 Feb 15;142(4):644-53.
doi: 10.1242/dev.113357.

Enteroendocrine cells are generated from stem cells through a distinct progenitor in the adult Drosophila posterior midgut

Affiliations

Enteroendocrine cells are generated from stem cells through a distinct progenitor in the adult Drosophila posterior midgut

Xiankun Zeng et al. Development. .

Abstract

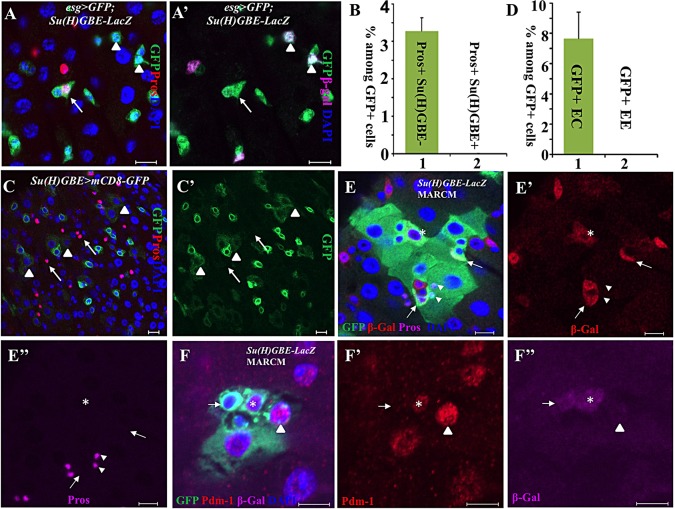
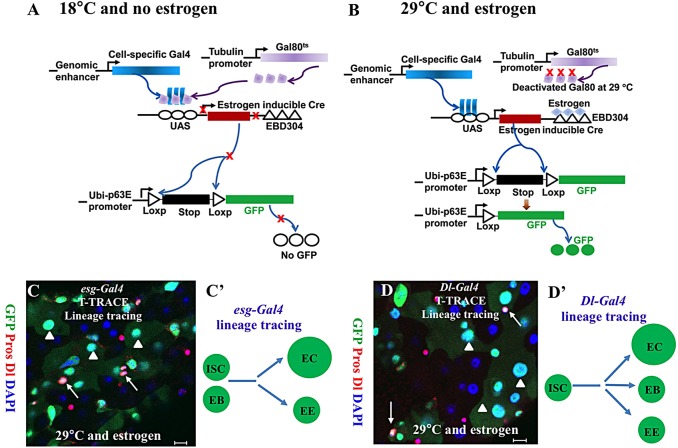
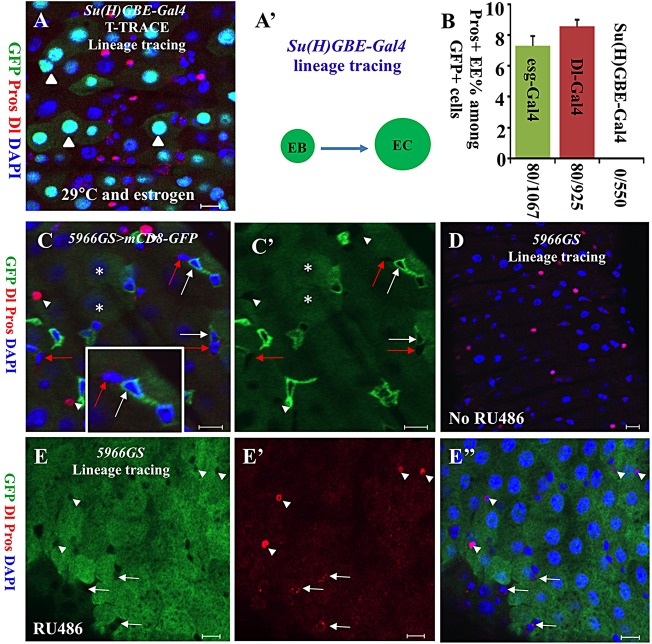
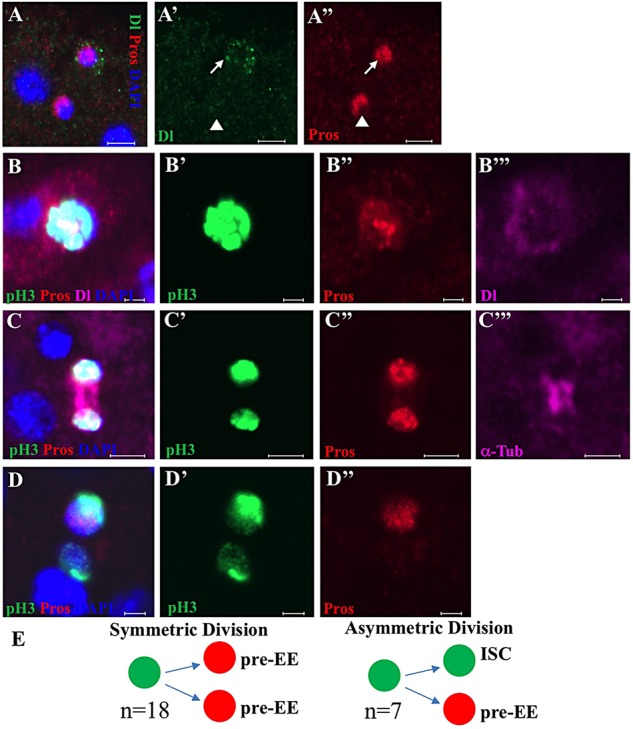
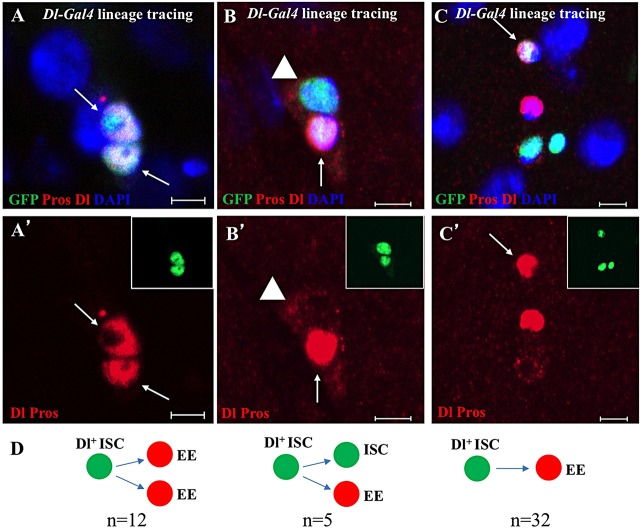
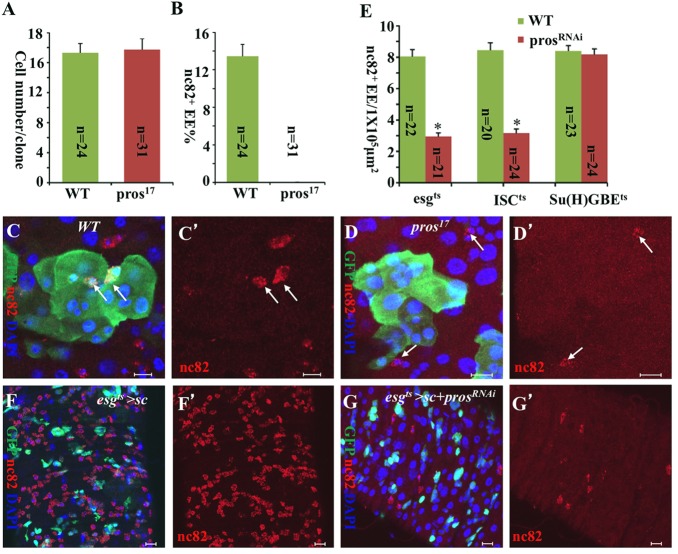
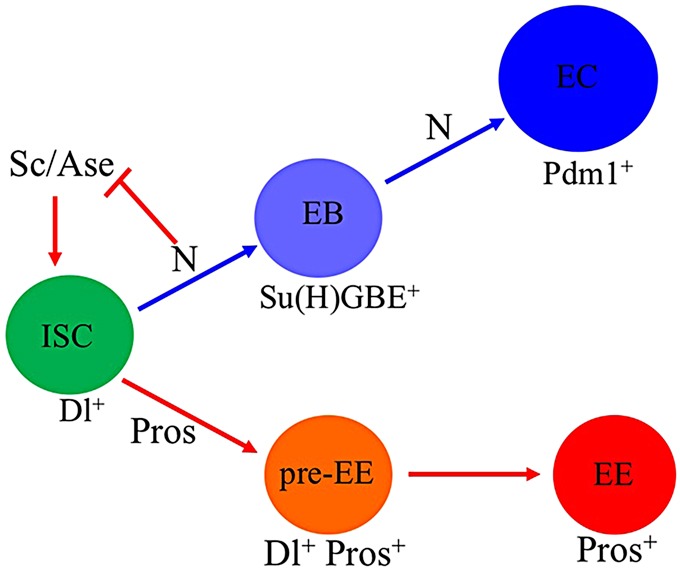
Functional mature cells are continually replenished by stem cells to maintain tissue homoeostasis. In the adult Drosophila posterior midgut, both terminally differentiated enterocyte (EC) and enteroendocrine (EE) cells are generated from an intestinal stem cell (ISC). However, it is not clear how the two differentiated cells are generated from the ISC. In this study, we found that only ECs are generated through the Su(H)GBE(+) immature progenitor enteroblasts (EBs), whereas EEs are generated from ISCs through a distinct progenitor pre-EE by a novel lineage-tracing system. EEs can be generated from ISCs in three ways: an ISC becoming an EE, an ISC becoming a new ISC and an EE through asymmetric division, or an ISC becoming two EEs through symmetric division. We further identified that the transcriptional factor Prospero (Pros) regulates ISC commitment to EEs. Our data provide direct evidence that different differentiated cells are generated by different modes of stem cell lineage specification within the same tissues.

Keywords: Drosophila; Intestinal stem cell; Pre-enteroendocrine cell; Prospero; Secretory enteroendocrine cell.


Figures

Fig. 1.
Fig. 1.
Su(H)GBE+ EBs are not EE progenitors. (A,A′) Esg+ (green) Pros+ (red) cells (arrows) do not express the EB marker Su(H)GBE-lacZ (arrowheads, purple in A′). (B) The quantification of Esg+ Pros+ Su(H)GBE and Esg+ Pros+ Su(H)GBE+ cells among all Esg+ cells. Data are represented as mean±s.e.m. (C,C′) Some of the ECs (arrowheads) inherited weak GFP from Su(H)GBE+ EBs; none of the EEs (arrow) inherited GFP from Su(H)GBE+ EBs, suggesting that ECs, but not EEs, are developed from Su(H)GBE+ EBs. (D) The quantification of GFP+ ECs and EEs among all GFP+ cells in Su(H)GBE>GFP posterior midguts. Data are represented as mean±s.e.m. (E-E″) Wild-type MARCM clones with Su(H)GBE-lacZ. Some polyploid ECs (asterisks) express β-Gal inherited from Su(H)GBE-lacZ+ EBs (arrows). However, none of the EEs (arrowhead) expresses β-Gal, suggesting that ECs, but not EEs, are developed from Su(H)GBE+ EBs. (F-F″) Wild-type MARCM clones with Su(H)GBE-lacZ. The arrows indicate a β-Gal+ Pdm-1 EB. The asterisks indicate a β-Gal+ Pdm-1+ EC. The arrowheads indicate a β-Gal Pdm-1+ EC. Scale bars: 10 μm.
Fig. 2.
Fig. 2.
The T-TRACE analysis system. (A,B) The molecular mechanisms of the T-TRACE system. In this system, TARGET mediates the expression of an estrogen-inducible Cre, which in turn removes a loxP-flanked transcriptional termination cassette inserted between a ubiquitin-p63E (Ubi-p63E) promoter fragment and the GFP open reading frame. Therefore, the Ubi-p63E promoter will drive GFP expression in all subsequent daughter cells derived from the initial Gal4-expressing progenitor cells. (C,C′) Fluorescence images showing T-TRACE analysis of the esg-Gal4 line at 29°C on food with estrogen (C). A schematic shows the result of lineage tracing using esg-Gal4 (C′). (D,D′) Fluorescence images showing T-TRACE analysis of the Dl-Gal4 line at 29°C on food with estrogen (D). A schematic diagram shows the result of lineage tracing using Dl-Gal4 (D′). In C and D, the adult fly posterior midguts were stained with anti-GFP (green), anti-Dl (cytoplasmic, red), anti-Pros (nuclear, red) and DAPI (blue). Arrows, GFP+ Pros+ EEs; arrowheads, GFP+ polyploid ECs. Scale bars: 10 μm.
Fig. 3.
Fig. 3.
EEs are not developed from Su(H)GBE+ and 5966GS+ EBs. (A) A fluorescence image showing T-TRACE analysis of the Su(H)GBE-Gal4 line at 29°C on food with estrogen. Arrowheads, GFP+ polyploid ECs. (A′) A schematic diagram of the result of lineage tracing using Su(H)GBE-Gal4. (B) The quantitative percentages of Pros+ cells among GFP+ cells from T-TRACE analysis of esg-Gal4, Dl-Gal4 and Su(H)GBE-Gal4. Data are mean±s.e.m. (C,C′) 5966GS (PswitchPC)-Gal4/UAS-mCD8-GFP expression. GFP is expressed in EBs (white arrows) and ECs (asterisks), but is not expressed in ISCs (red arrows) and EEs (white arrowheads). The inset shows an enlarged view. (D-E″) Fluorescence images showing UAS-flp/5966GS/Act<y+<EGFP analysis at 22°C on food without RU486 (D), or at 22°C on food with RU486 (E-E″). Arrowheads, Pros+ EEs; arrows, Dl+ ISCs. The adult fly posterior midguts were stained with anti-GFP (green), anti-Dl (cytoplasmic, red), anti-Pros (nuclear, red) and DAPI (blue). Scale bars: 10 μm.
Fig. 4.
Fig. 4.
EE generation during ISC division. (A-A″) A representative image showing a Dl+ Pros+ pre-EE cell (arrows) and Dl Pros+ EE cell (arrowheads). (B-B‴) Representative images of a pH3+ Pros+ Dl+ cell in the posterior midgut of wild-type flies. (C-C‴) Representative images showing an ISC becoming two pre-EEs through symmetric division. α-Tubulin was used to label the spindle of the dividing cell. (D-D″) Representative images showing an ISC becoming a new ISC and a pre-EE through asymmetric division. In all images, the 1-week-old wild-type flies were stained using the antibodies indicated. Scale bars: 2 μm. (E) Schematic showing the quantitation of EE generation from ISCs through symmetric and asymmetric division in the posterior midguts of wild-type flies.
Fig. 5.
Fig. 5.
EEs are generated by symmetric and asymmetric division of ISCs and are directly converted from ISCs. Fluorescence images showing T-TRACE analysis of the Dl-Gal4 line at 29°C on food with estrogen. The adult fly posterior midguts were stained with anti-GFP (green), anti-Dl (cytoplasmic, red), anti-Pros (nuclear, red) and DAPI (blue). Scale bars: 5 μm. (A,A′) An ISC becomes two EEs (arrows) through symmetric division. (B,B′) An ISC becomes a new ISC (arrowhead) and an EE (arrow) through asymmetric division. (C,C′) An ISC directly becomes an EE (arrow). (D) Schematic showing the quantitation of EE generation from ISCs. The GFP-marked cells are illustrated in the insets of A′,B′,C′.
Fig. 6.
Fig. 6.
Pros regulates EE cell fate determination in ISCs. (A) The quantitative cell numbers per clone in C-D′. (B) The quantitative percentages of nc82+ EEs in GFP+ clones in C-D′. Data are represented as mean±s.e.m. (C-D′) MARCM clones of wild-type control (C,C′) and pros17 (D,D′). Seven days after clone induction, GFP-marked clones of pros17 (D,D′) were completely devoid of nc82+ EEs (arrow) compared with their wild-type counterparts (C,C′), whereas the clone sizes are similar (A). (E) The numbers of nc82+ EE cells in the posterior midguts of prosRNAi driven by indicated Gal4, compared with wild-type controls. Data are represented as mean±s.e.m. *P<0.01. (F,F′) The overexpression of sc in ISCs and EBs (esgts>sc). (G,G′) The overexpression of sc and prosRNAi in ISCs and EBs (esgts>sc+prosRNAi). The overexpression of prosRNAi suppressed the excess EE phenotype associated with sc overexpression, indicating that Pros functions either downstream of or parallel to Sc. The adult fly posterior midguts were stained with anti-GFP (green), anti-nc82 (red) and DAPI (blue). Scale bars: 10 μm.
Fig. 7.
Fig. 7.
Model of intestinal stem cell lineage generation. A model of intestinal stem cell lineage development in the adult Drosophila posterior midgut. More details are provided in the text.

Similar articles

Cited by

References

    1. Bardin A. J., Perdigoto C. N., Southall T. D., Brand A. H. and Schweisguth F. (2010). Transcriptional control of stem cell maintenance in the Drosophila intestine. Development 137, 705-714 10.1242/dev.039404 - DOI - PMC - PubMed
    1. Barker N., van Es J. H., Kuipers J., Kujala P., van den Born M., Cozijnsen M., Haegebarth A., Korving J., Begthel H., Peters P. J. et al. (2007). Identification of stem cells in small intestine and colon by marker gene Lgr5. Nature 449, 1003-1007 10.1038/nature06196 - DOI - PubMed
    1. Beebe K., Lee W.-C. and Micchelli C. A. (2010). JAK/STAT signaling coordinates stem cell proliferation and multilineage differentiation in the Drosophila intestinal stem cell lineage. Dev. Biol. 338, 28-37 10.1016/j.ydbio.2009.10.045 - DOI - PubMed
    1. Biteau B. and Jasper H. (2014). Slit/Robo signaling regulates cell fate decisions in the intestinal stem cell lineage of Drosophila. Cell Rep. 7, 1867-1875 10.1016/j.celrep.2014.05.024 - DOI - PMC - PubMed
    1. Biteau B., Hochmuth C. E. and Jasper H. (2011). Maintaining tissue homeostasis: dynamic control of somatic stem cell activity. Cell Stem Cell 9, 402-411 10.1016/j.stem.2011.10.004 - DOI - PMC - PubMed

Publication types

Substances

LinkOut - more resources