. 2015 Apr;56(4):786-800.
doi: 10.1194/jlr.M050781. Epub 2015 Feb 10.

Sphingomyelin metabolism is involved in the differentiation of MDCK cells induced by environmental hypertonicity

Affiliations

Sphingomyelin metabolism is involved in the differentiation of MDCK cells induced by environmental hypertonicity

Nicolás Octavio Favale et al. J Lipid Res. 2015 Apr.

Abstract

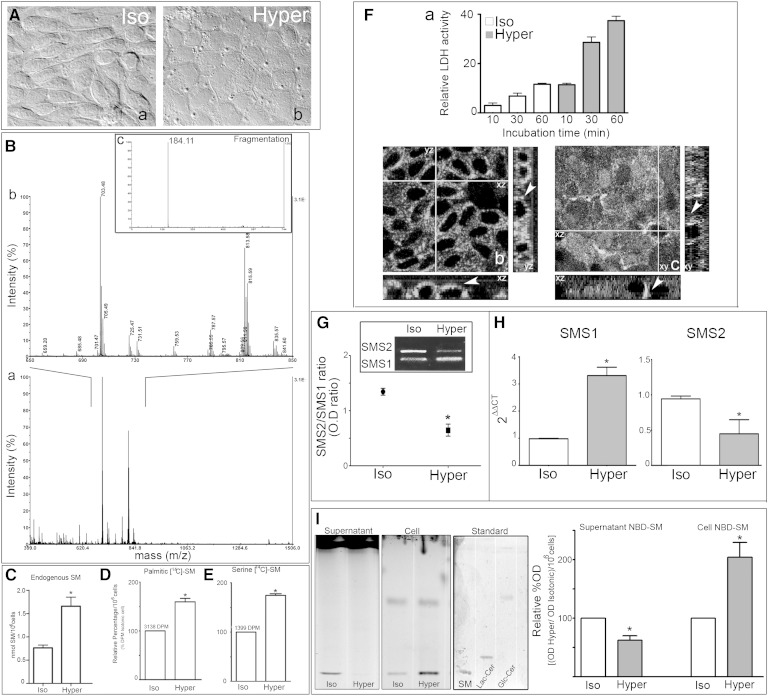
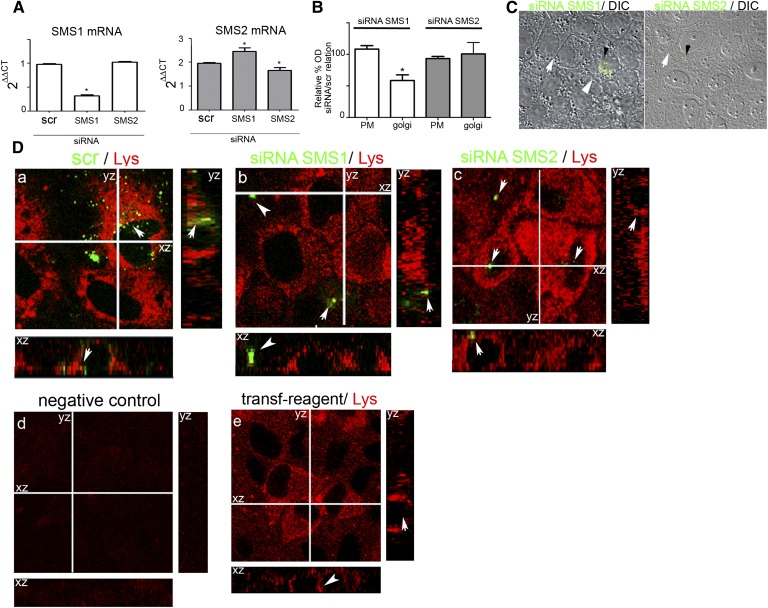
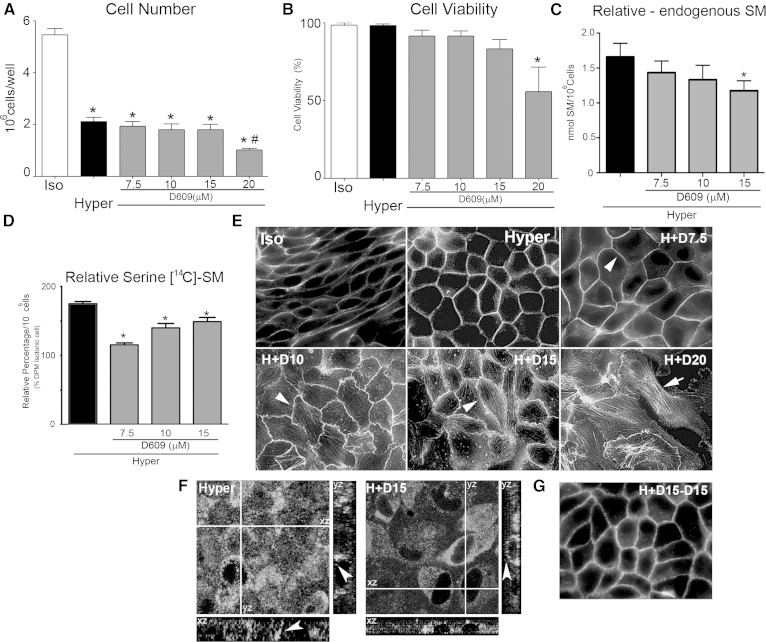
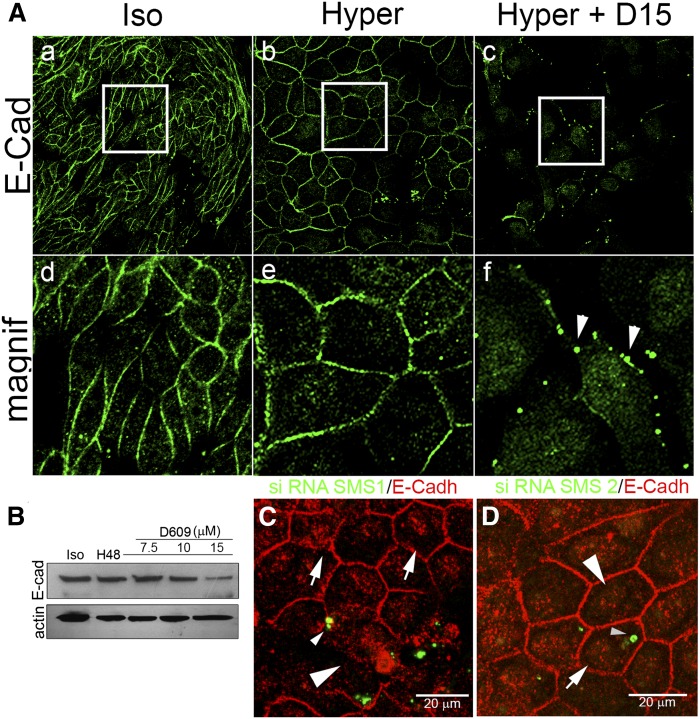
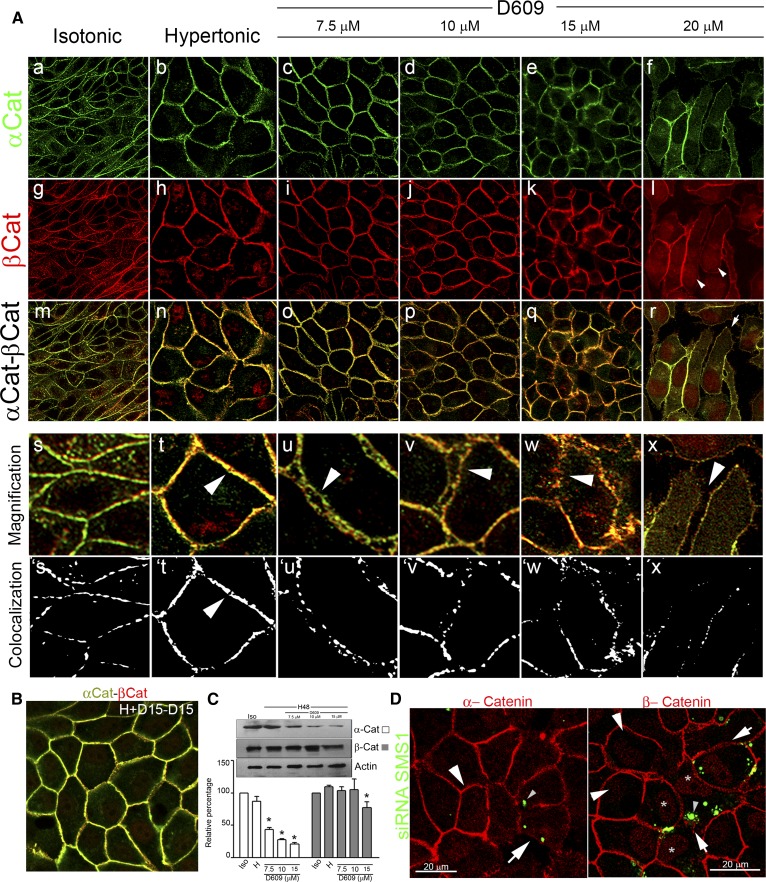
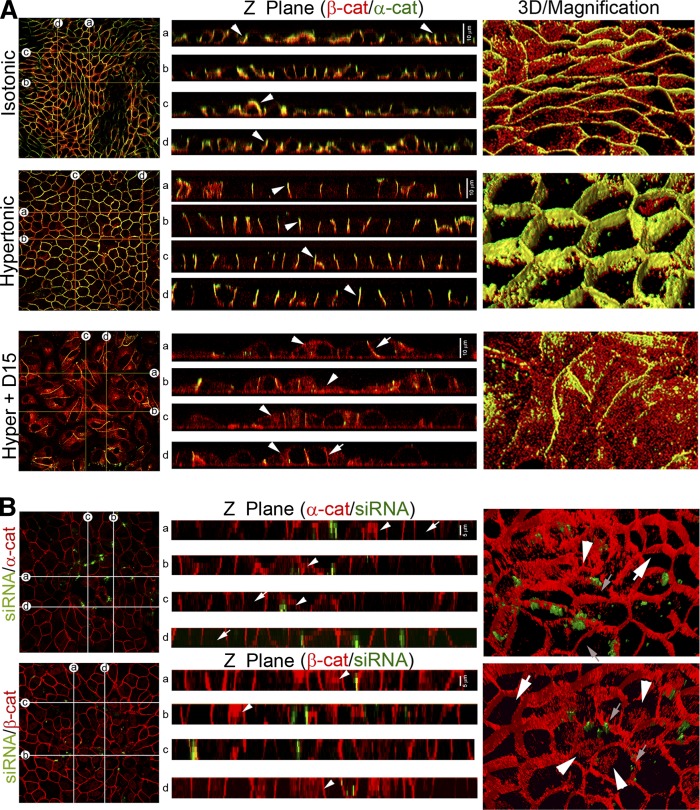
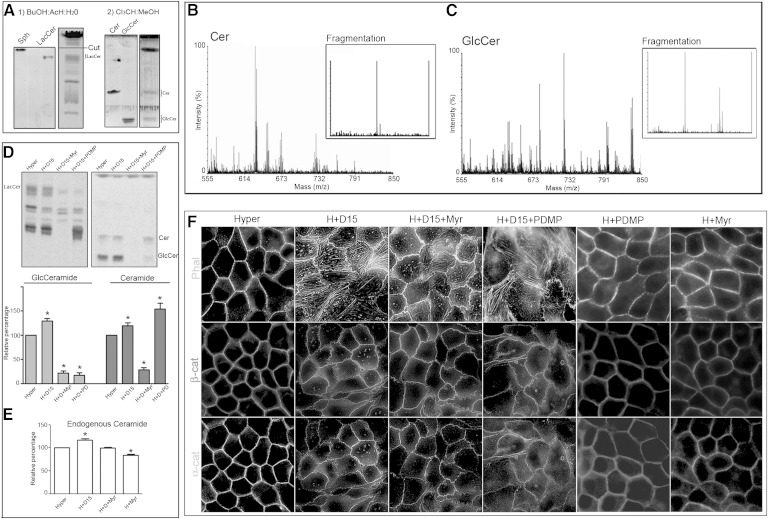
Sphingolipids (SLs) are relevant lipid components of eukaryotic cells. Besides regulating various cellular processes, SLs provide the structural framework for plasma membrane organization. Particularly, SM is associated with detergent-resistant microdomains. We have previously shown that the adherens junction (AJ) complex, the relevant cell-cell adhesion structure involved in cell differentiation and tissue organization, is located in an SM-rich membrane lipid domain. We have also demonstrated that under hypertonic conditions, Madin-Darby canine kidney (MDCK) cells acquire a differentiated phenotype with changes in SL metabolism. For these reasons, we decided to evaluate whether SM metabolism is involved in the acquisition of the differentiated phenotype of MDCK cells. We found that SM synthesis mediated by SM synthase 1 is involved in hypertonicity-induced formation of mature AJs, necessary for correct epithelial cell differentiation. Inhibition of SM synthesis impaired the acquisition of mature AJs, evoking a disintegration-like process reflected by the dissipation of E-cadherin and β- and α-catenins from the AJ complex. As a consequence, MDCK cells did not develop the hypertonicity-induced differentiated epithelial cell phenotype.

Keywords: Madin-Darby canine kidney cells; renal epithelial cells; sphingomyelin synthase.


Figures

Fig. 1.
Fig. 1.
SMS1 expression and activity are increased during induced MDCK differentiation. MDCK morphological changes were evaluated by DIC microscopy. A: Confluent MDCK cells cultured in isotonic medium (a) and subjected to external hypertonicity for 48 h (b). B: MALDI TOF/TOF analysis of the TLC spot corresponding to the Rf of SM. The intensity versus mass (m/z) graph (a), magnification (b), fragmentation (c). C: Endogenous SM expressed as nmol SM per 106 cells. [14C]palmitic acid (D) and [14C]serine incorporation (E), expressed as relative percentage of incorporation per 106 cells (* P < 0.05). F-a: Lytic lysenin activity (final concentration, 5 μM/ml) by different incubation times (10, 30, and 60 min) was measured by the release of LDH. The results are expressed as relative LDH activity respect to 100% value of the cell layer lysed with 0.2% Tween 20. SM distributions using lysenin staining were observed by confocal microscopy optical section and the xz and yz plane reconstruction. Images from a middle confocal plane in both cultured cell conditions (b and c) and z-plane reconstruction (xy and zy) were observed. RT-PCR (G) and qRT-PCR (H) for SMS1 and SMS2 were performed. I: Representative TLC of NBD-SM synthesis in the supernatant and cell. Quantification expressed as relative percentage of optical density (Hyper/Iso per 106 cells) (* P < 0.05).
Fig. 2.
Fig. 2.
SMS1 knockdown impairs the acquisition of the differentiated phenotype. A: qRT-PCR analysis of the effect of SMS1 and SMS2 silencing on SMS1 and SMS2 expression. B: Effect of SMS1 and SMS2 silencing on PM and Golgi synthesis of SM expressed as relative percentage of siRNA/scr activity (* P < 0.05 data compared by ANOVA). C: DIC of SMS1 and SMS2 siRNA. SMS1-transfected cells (siRNA-Alexafluor488 green dotted cells, arrowhead) and nontransfected cells (white arrow). D: SM distributions using lysenin staining were observed by confocal microscopy optical section and the xz and yz plane reconstruction. Images from a middle confocal plane and z-plane reconstruction (xy and zy) in siRNA scramble (a), siRNA SMS1 (b), and siRNA SMS2 (c) transfected cells were observed. Negative control (avoiding lysenin) (d) and transfection reagent control (e) were performed.
Fig. 3.
Fig. 3.
The morphological changes induced by hypertonicity are impaired by D609, an SMS inhibitor, in a concentration-dependent manner. Effect of increasing concentrations of D609 on cell number (A) and viability (B) (* P < 0.01 data compared vs. Iso; # P < 0.05 data compared vs. Hyper). C: Effect of increasing concentrations of D609 on the endogenous levels of SM expressed as nmol of SM per 106 cells (* P < 0.05). D: Effect of increasing concentrations of D609 on SM de novo synthesis (* P < 0.05). E: Wide-field fluorescence microscopy showing the effect of increasing concentrations of D609 on cell morphology. F: Lysenin staining of SM in control (Hyper) and D609 treated cells (H+D15). G: Washed cells reincubated for 24 h without inhibitor.
Fig. 4.
Fig. 4.
SMS inhibition and SMS1 knockdown impair AJ assembly: alteration of E-cadherin. A: E-cadherin (green fluorescence) images of the middle confocal plane and their magnification under isotonicity (a and d), hypertonicity (b and e), and under hypertonicity with 15 µM D609 (c and f). B: Effect of increasing concentrations of D609 on E-cadherin level. C: Immunofluorescence of E-cadherin distribution in SMS1 knockdown transfected cells (small arrowhead) as compared with nontransfected cells (white arrowhead). D: Immunofluorescence of E-cadherin distribution in SMS2 knockdown transfected cells (small arrowhead) compared with nontransfected cells (white arrowhead).
Fig. 5.
Fig. 5.
SMS inhibition and SMS1 knockdown impair AJ assembly: alteration of α- and β-catenin. A: Confocal immunofluorescence of the middle confocal plane of α-catenin (α-Cat) and β-catenin (β-Cat) distribution, under isotonic (a, g, respectively) or hypertonic conditions (b, h, respectively). Merged images (m, n). Confocal immunofluorescence of the middle confocal plane of α-catenin (c–f) and β-catenin distribution (i–l). Merged images of β- and α-catenin (o–r). Digital magnification (s–x). Arrowheads show the progressive alteration of AJ and cell-cell adhesion. From magnified images, segmentation processes were performed. Yellow pixels are represented as white pixels (Colocalization: s´, t´, u´, v´, w´, and x´). B: α-catenin (green) and β-catenin (red) were detected in wash cultured cells and reincubated without inhibitor. C: Effect of increasing concentrations of D609 on α-catenin (white bars) and β-catenin (gray bars) levels determined by Western blot analysis. Actin was used as loading control (representative image, n = 4, P < 0.05). D: Effect of SMS1 knockdown on α-catenin (red) and β-catenin (red) distribution. Transfected cells are seen as green dotted cells (small arrowhead).
Fig. 6.
Fig. 6.
Z-plane and 3D reconstruction. SMS inhibition and knockdown. A: Z-plane cross-sections across the monolayer were generated (a–d). Analysis of z-planes (Z Plane) showed β- and α-catenin in the periphery of the cells, both under isotonicity and under hypertonicity (white arrowhead). In cells treated with 15 µM D609, cell-cell adhesion was impaired and the peripheral localization of α- and β-catenin is lost (Hyper+D15, white arrow). Cytosolic β-catenin was observed (Hyper+D15, white arrowhead). 3D reconstructions were performed from the optical sections (3D/Magnification). Under isotonicity, cells presented an elongated phenotype while under hypertonicity presented a cobblestone-like morphology (Hypertonic, 3D/Magnification). D609 treatment impaired the acquisition of the differentiated phenotype (Hyper + D15, 3D/Magnification), showing β-catenin intracellular accumulation. B: Effect of SMS1 knockdown on AJ formation and cell morphology, α- and β-catenin (red fluorescence in both cases). The green fluorescence corresponded to transfection control. Analysis of z-planes (Z Plane, α-cat and β-cat) showed that images from transfected cells (arrowhead) present a mislocalization of both catenins, with a clear cytoplasmic β-catenin distribution (Z Plane, β-cat, arrowhead). No alteration is observed in nontransfected cells, which present a cobblestone-like phenotype, with β-catenin peripherally distributed (white arrow). In α-catenin 3D/Magnification nontransfected cells (white arrow) present a peripheral distribution of α-catenin, whereas peripheral distribution is disrupted in transfected cells. In β-catenin 3D/Magnification nontransfected cells showed a peripheral distribution (white arrow), whereas transfected cells (white arrowhead) present intracellular distribution with accumulation in a structure that should be the nucleus. The small arrowhead indicates the transfection control.
Fig. 7.
Fig. 7.
The alteration in differentiated phenotype acquisition by SMS inhibition is not due to Cer accumulation. A: Representative TLC performed as described in Materials and Methods, using butanol-acetic acid-water (60:20:20, v/v/v) as first solvent system and chloroform-methanol (98:2, v/v) as second solvent system. B, C: MALDI TOF/TOF mass spectrometry of chromatographic spots that comigrated with Cer and GlcCer standards. The intensity versus mass (m/z) graph shows most of the signals in the m/z 520–690 range in the Cer spot and signals in the m/z 682–808 range in the GlcCer spot. These m/z peaks are consistent with the possible Cer and GlcCer subspecies (different fatty acid carbon number). The molecular structures of Cer and GlcCer subspecies were confirmed by fragmentation, with the detection of two peaks at m/z for Cer and three peaks for GlcCer confirming their identities. D: Effect of SPT and GlcCer synthase inhibition on [14C]serine incorporation, in D609-treated cells. E: Endogenous content of Cer evaluated by cupric acetate reagent. F: Effect of SPT and GlcCer synthase inhibition on the D609-induced alteration of F-actin and α- and β-catenin (α-cat/β-cat) distributions.

Similar articles

Cited by

References

    1. Ogretmen B., Hannun Y. A. 2004. Biologically active sphingolipids in cancer pathogenesis and treatment. Nat. Rev. Cancer. 4: 604–616. - PubMed
    1. van Echten G., Birk R., Brenner-Weiss G., Schmidt R. R., Sandhoff K. 1990. Modulation of sphingolipid biosynthesis in primary cultured neurons by long chain bases. J. Biol. Chem. 265: 9333–9339. - PubMed
    1. Merrill A. H., Jones D. D. 1990. An update of the enzymology and regulation of sphingomyelin metabolism. Biochim. Biophys. Acta. 1044: 1–12. - PubMed
    1. Huitema K., van den Dikkenber J., Brouwers J. F., Holthuis J. C. 2004. Identification of a family of animal sphingomyelin synthases. EMBO J. 23: 33–44. - PMC - PubMed
    1. Slotte J. P. 2013. Biological functions of sphingomyelins. Prog. Lipid Res. 52: 424–437. - PubMed

MeSH terms