

Reducing the genetic redundancy of Arabidopsis PHOSPHATE TRANSPORTER1 transporters to study phosphate uptake and signaling
- PMID: 25670816
- PMCID: PMC4378149
- DOI: 10.1104/pp.114.252338
Reducing the genetic redundancy of Arabidopsis PHOSPHATE TRANSPORTER1 transporters to study phosphate uptake and signaling
Abstract
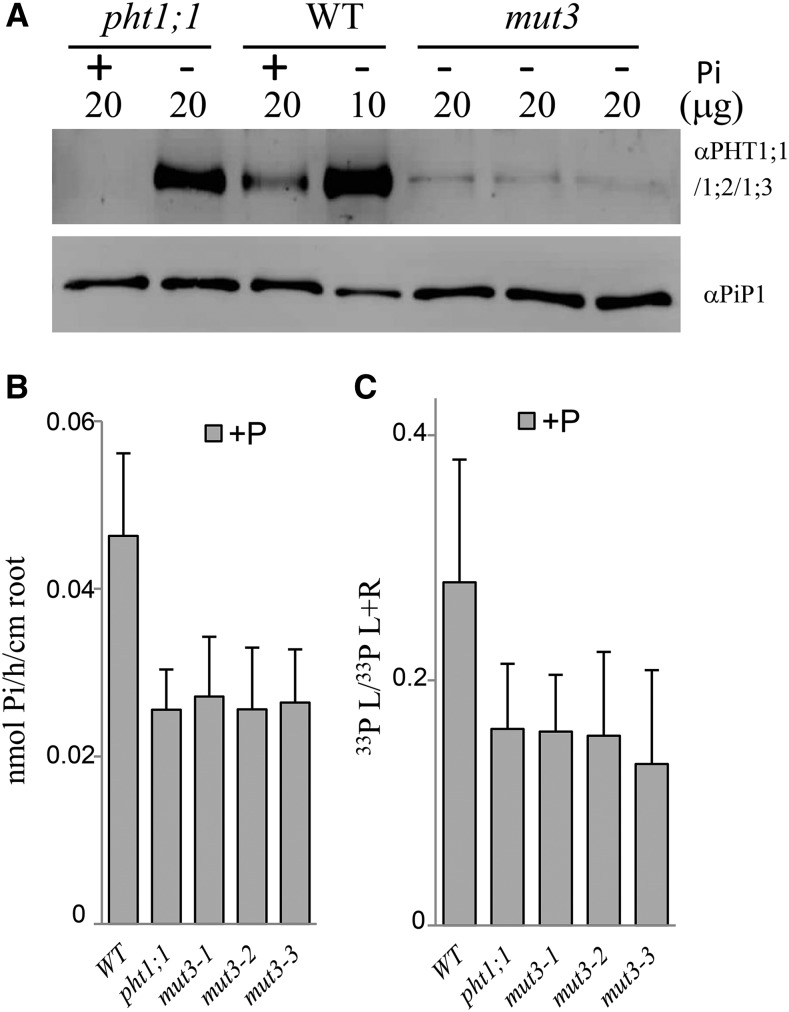
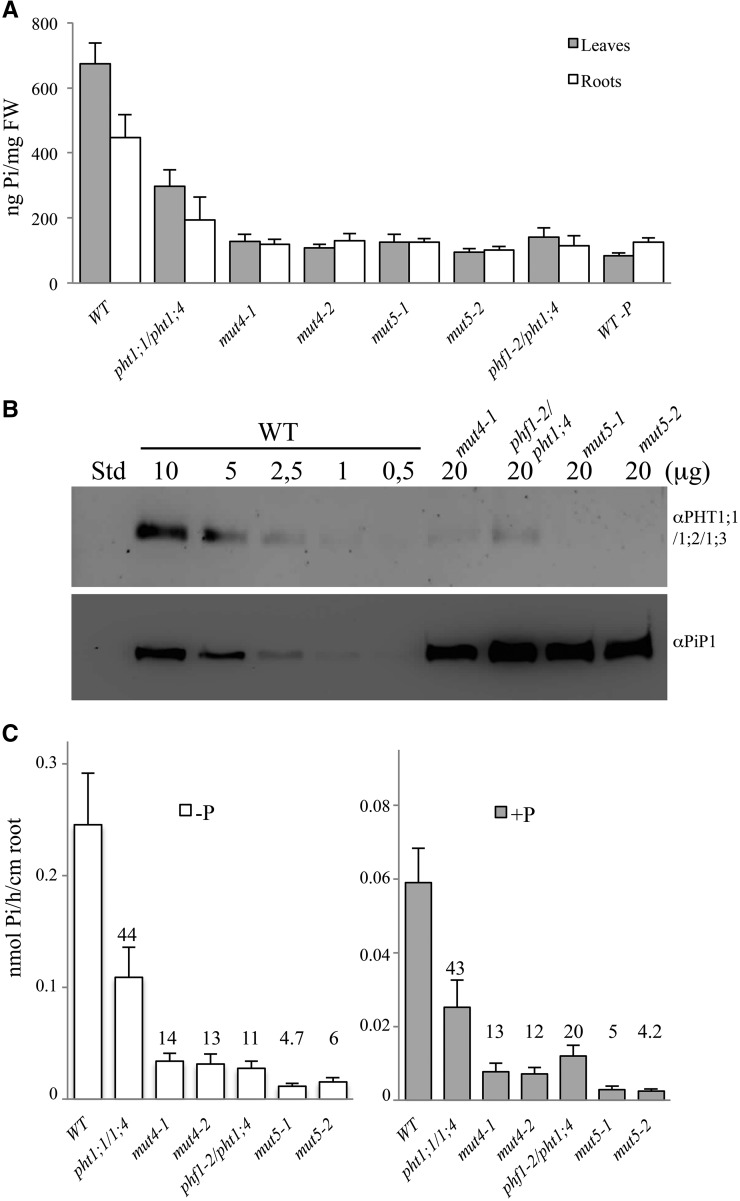
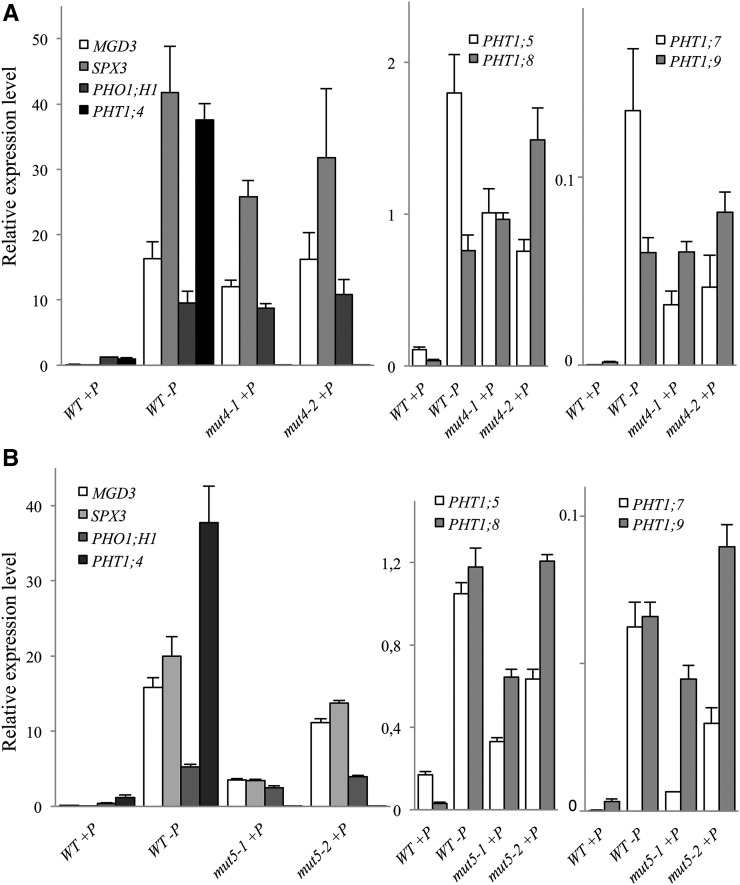
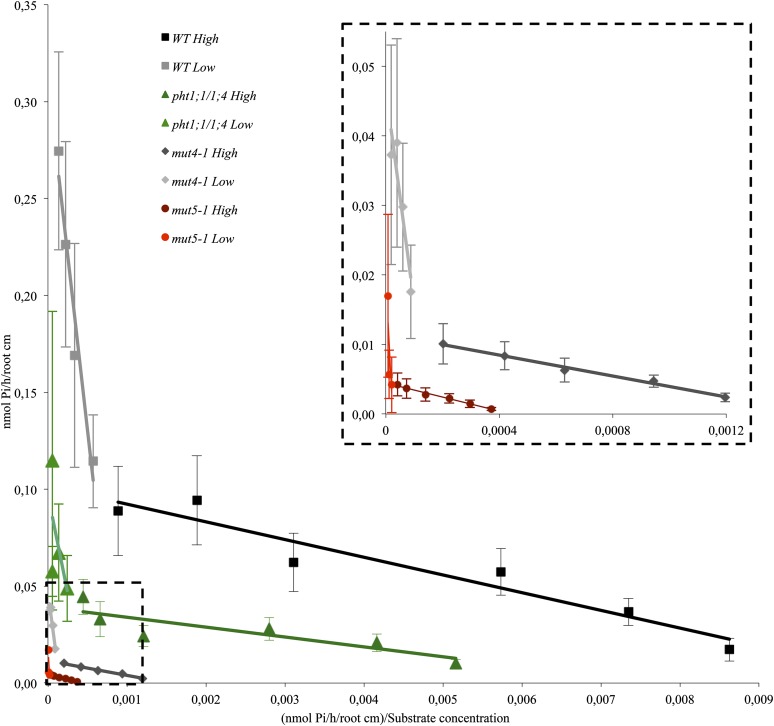
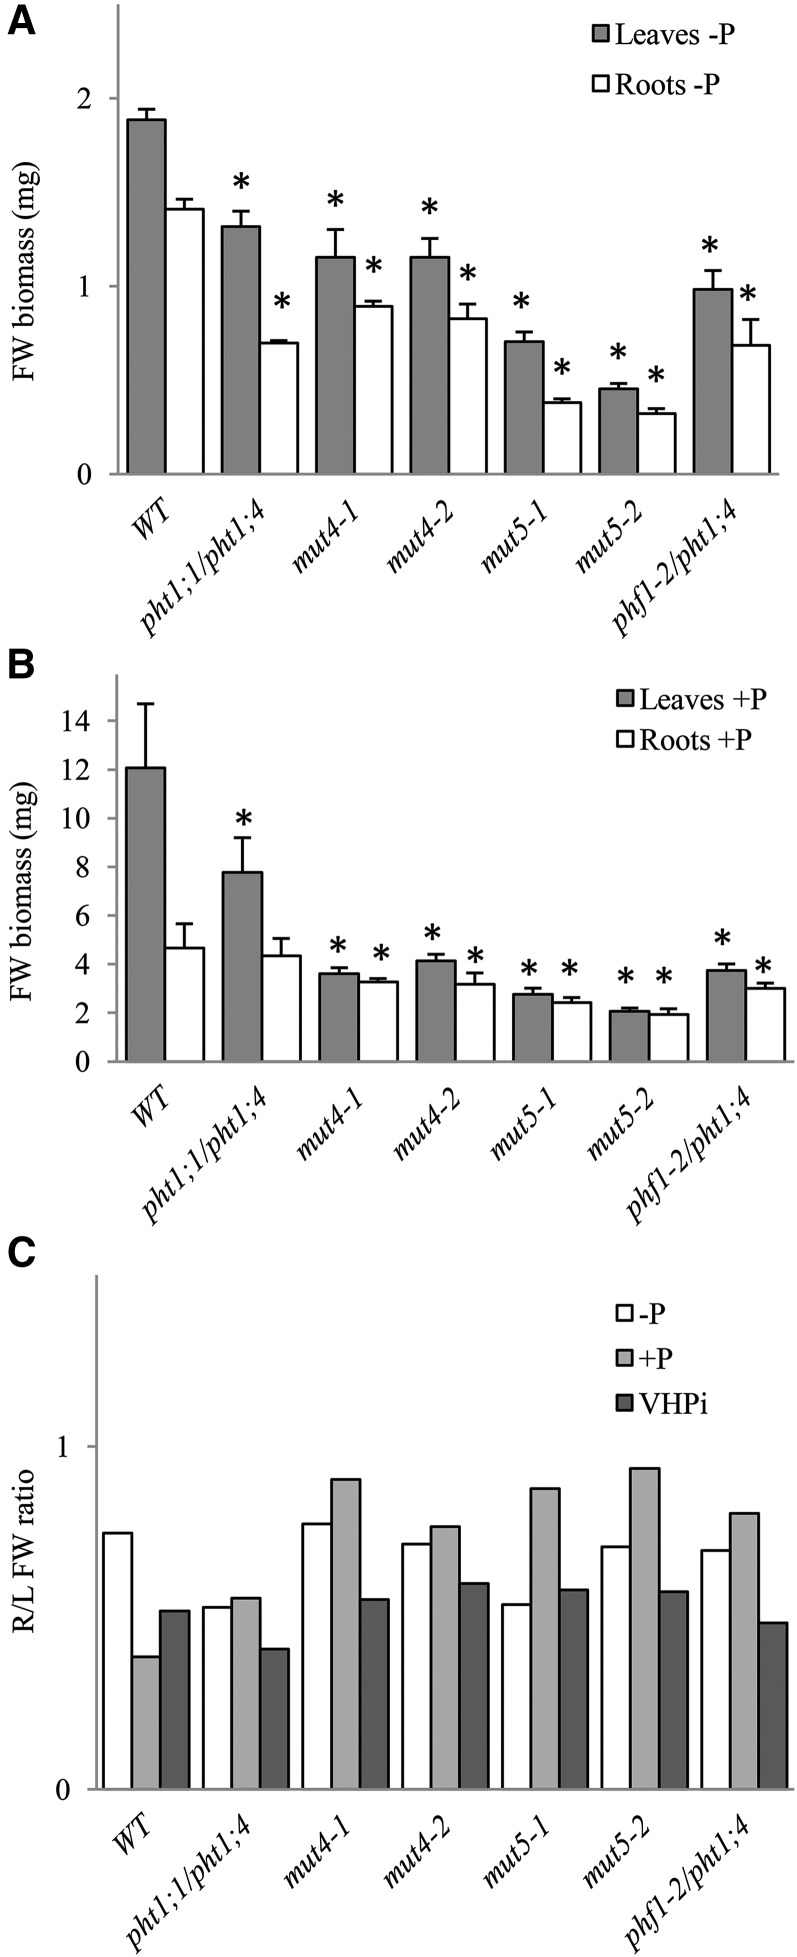
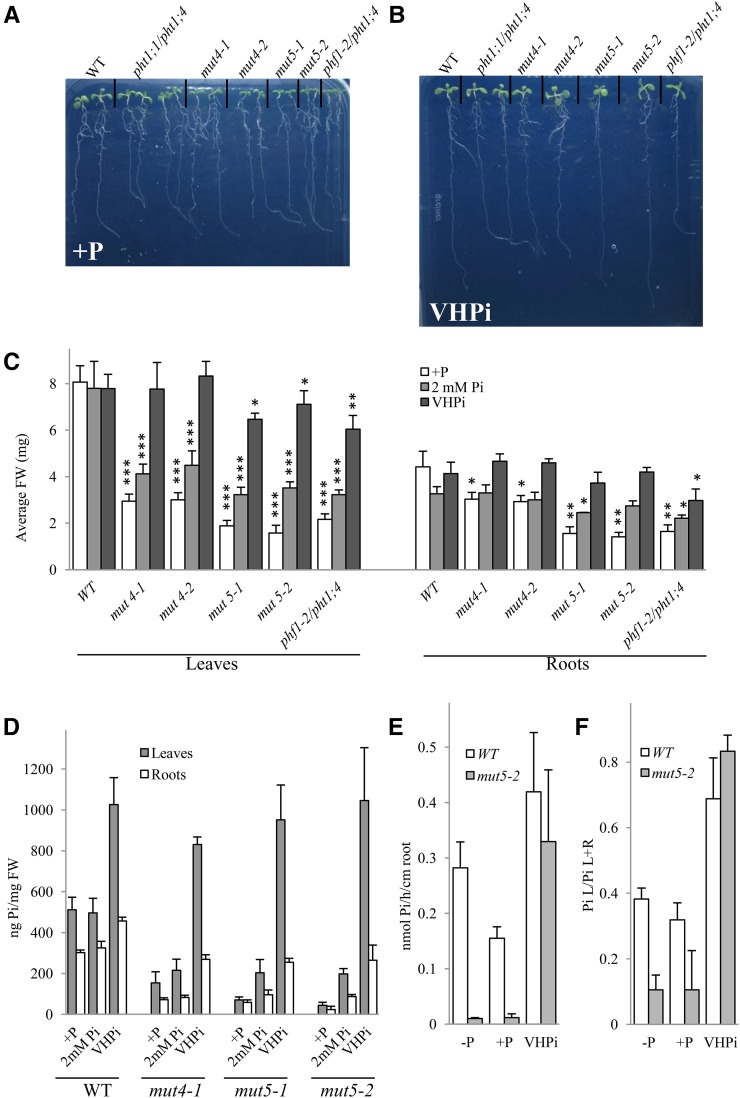
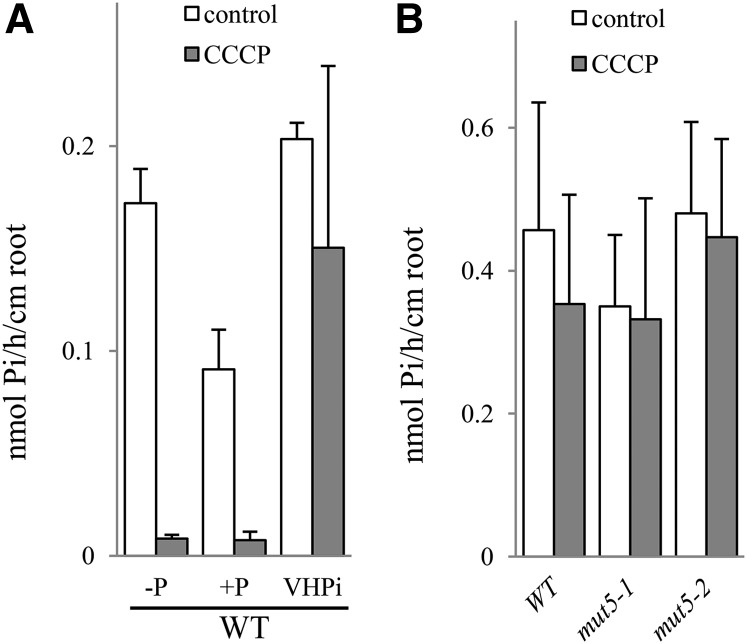
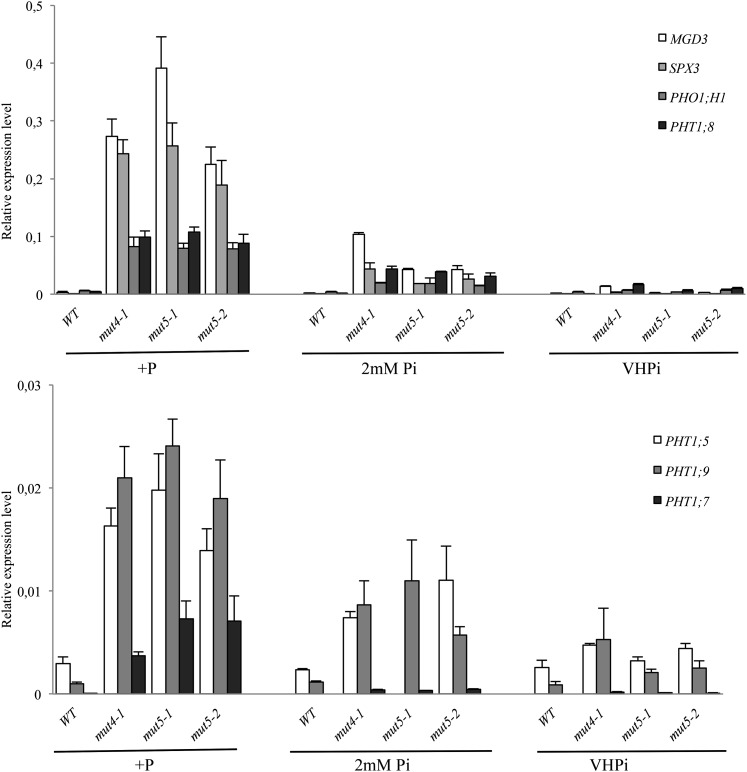
Arabidopsis (Arabidopsis thaliana) absorbs inorganic phosphate (Pi) from the soil through an active transport process mediated by the nine members of the PHOSPHATE TRANSPORTER1 (PHT1) family. These proteins share a high level of similarity (greater than 61%), with overlapping expression patterns. The resulting genetic and functional redundancy prevents the analysis of their specific roles. To overcome this difficulty, our approach combined several mutations with gene silencing to inactivate multiple members of the PHT1 family, including a cluster of genes localized on chromosome 5 (PHT1;1, PHT1;2, and PHT1;3). Physiological analyses of these lines established that these three genes, along with PHT1;4, are the main contributors to Pi uptake. Furthermore, PHT1;1 plays an important role in translocation from roots to leaves in high phosphate conditions. These genetic tools also revealed that some PHT1 transporters likely exhibit a dual affinity for phosphate, suggesting that their activity is posttranslationally controlled. These lines display significant phosphate deficiency-related phenotypes (e.g. biomass and yield) due to a massive (80%-96%) reduction in phosphate uptake activities. These defects limited the amount of internal Pi pool, inducing compensatory mechanisms triggered by the systemic Pi starvation response. Such reactions have been uncoupled from PHT1 activity, suggesting that systemic Pi sensing is most probably acting downstream of PHT1.
© 2015 American Society of Plant Biologists. All Rights Reserved.
Figures
Similar articles
-
The Pht1;9 and Pht1;8 transporters mediate inorganic phosphate acquisition by the Arabidopsis thaliana root during phosphorus starvation.New Phytol. 2012 Jul;195(2):356-371. doi: 10.1111/j.1469-8137.2012.04167.x. Epub 2012 May 11. New Phytol. 2012. PMID: 22578268
-
Arabidopsis PHOSPHATE TRANSPORTER1 genes PHT1;8 and PHT1;9 are involved in root-to-shoot translocation of orthophosphate.BMC Plant Biol. 2014 Nov 27;14:334. doi: 10.1186/s12870-014-0334-z. BMC Plant Biol. 2014. PMID: 25428623 Free PMC article.
-
Transcriptional regulation and functional properties of Arabidopsis Pht1;4, a high affinity transporter contributing greatly to phosphate uptake in phosphate deprived plants.Plant Mol Biol. 2004 Jul;55(5):727-41. doi: 10.1007/s11103-004-1965-5. Plant Mol Biol. 2004. PMID: 15604713
-
The conservation of phosphate-binding residues among PHT1 transporters suggests that distinct transport affinities are unlikely to result from differences in the phosphate-binding site.Biochem Soc Trans. 2016 Oct 15;44(5):1541-1548. doi: 10.1042/BST20160016. Biochem Soc Trans. 2016. PMID: 27911737 Review.
-
Environmental Control of Phosphorus Acquisition: A Piece of the Molecular Framework Underlying Nutritional Homeostasis.Plant Cell Physiol. 2021 Sep 24;62(4):573-581. doi: 10.1093/pcp/pcab010. Plant Cell Physiol. 2021. PMID: 33508134 Review.
Cited by
-
Functional characterization of the PHT1 family transporters of foxtail millet with development of a novel Agrobacterium-mediated transformation procedure.Sci Rep. 2017 Oct 25;7(1):14064. doi: 10.1038/s41598-017-14447-0. Sci Rep. 2017. PMID: 29070807 Free PMC article.
-
Ca14-3-3 Interacts With CaWRKY58 to Positively Modulate Pepper Response to Low-Phosphorus Starvation.Front Plant Sci. 2021 Jan 14;11:607878. doi: 10.3389/fpls.2020.607878. eCollection 2020. Front Plant Sci. 2021. PMID: 33519860 Free PMC article.
-
A simple high-throughput protocol for the extraction and quantification of inorganic phosphate in rice leaves.Appl Plant Sci. 2020 Oct 30;8(10):e11395. doi: 10.1002/aps3.11395. eCollection 2020 Oct. Appl Plant Sci. 2020. PMID: 33163294 Free PMC article.
-
Phosphorus uptake, transport, and signaling in woody and model plants.For Res (Fayettev). 2024 May 6;4:e017. doi: 10.48130/forres-0024-0014. eCollection 2024. For Res (Fayettev). 2024. PMID: 39524430 Free PMC article. Review.
-
Integrative analyses of morpho-physiological, biochemical, and transcriptomic reveal the seedling growth response of Pinus yunnanensis to nitrogen and phosphorus fertilization.Front Plant Sci. 2025 Jan 27;15:1405638. doi: 10.3389/fpls.2024.1405638. eCollection 2024. Front Plant Sci. 2025. PMID: 39931342 Free PMC article.
References
-
- Ai P, Sun S, Zhao J, Fan X, Xin W, Guo Q, Yu L, Shen Q, Wu P, Miller AJ, et al. (2009) Two rice phosphate transporters, OsPht1;2 and OsPht1;6, have different functions and kinetic properties in uptake and translocation. Plant J 57: 798–809 - PubMed
-
- Barbier-Brygoo H, De Angeli A, Filleur S, Frachisse JM, Gambale F, Thomine S, Wege S (2011) Anion channels/transporters in plants: from molecular bases to regulatory networks. Annu Rev Plant Biol 62: 25–51 - PubMed
Publication types
MeSH terms
Substances
LinkOut - more resources
Full Text Sources
Other Literature Sources
Molecular Biology Databases
Research Materials
Miscellaneous
