. 2015 Mar 27;290(13):8469-81.
doi: 10.1074/jbc.M114.622696. Epub 2015 Feb 10.

The steroid hormone 20-hydroxyecdysone via nongenomic pathway activates Ca2+/calmodulin-dependent protein kinase II to regulate gene expression

Affiliations

The steroid hormone 20-hydroxyecdysone via nongenomic pathway activates Ca2+/calmodulin-dependent protein kinase II to regulate gene expression

Yu-Pu Jing et al. J Biol Chem. .

Abstract

The steroid hormone 20-hydroxyecdysone (20E) triggers calcium signaling pathway to regulate 20E response gene expression, but the mechanism underlying this process remains unclear. We propose that the 20E-induced phosphorylation of Ca(2+)/calmodulin-dependent protein kinase II (CaMKII) serves an important function in 20E response gene transcription in the lepidopteran insect Helicoverpa armigera. CaMKII showed increased expression and phosphorylation during metamorphosis. 20E elevated CaMKII phosphorylation. However, the G protein-coupled receptor (GPCR) and ryanodine receptor inhibitor suramin, the phospholipase C inhibitor U73122, and the inositol 1,4,5-triphosphate receptor inhibitor xestospongin C suppressed 20E-induced CaMKII phosphorylation. Two ecdysone-responsible GPCRs and Gαq protein were involved in 20E-induced CaMKII phosphorylation by RNA interference analysis. 20E regulated CaMKII threonine phosphorylation at amino acid 290, thereby inducing CaMKII nuclear translocation. CaMKII knockdown by dsCaMKII injection into the larvae prevented the occurrence of larval-pupal transition and suppressed 20E response gene expression. CaMKII phosphorylation and nuclear translocation maintained USP1 lysine acetylation at amino acid 303 by inducing histone deacetylase 3 phosphorylation and nuclear export. The lysine acetylation of USP1 was necessary for the interaction of USP1 with EcRB1 and their binding to the ecdysone response element. Results suggest that 20E (via GPCR activation and calcium signaling) activates CaMKII phosphorylation and nuclear translocation, which regulate USP1 lysine acetylation to form an EcRB1-USP1 complex for 20E response gene transcription.

Keywords: 20-Hydroxyecdysone; Ca2+/Calmodulin-dependent Protein Kinase II (CaMKII); Histone Deacetylase 3 (HDAC3); Phosphorylation; Steroid Hormone; Transcription Regulation; USP1 Lysine Acetylation.


Figures

FIGURE 1.
FIGURE 1.
CaMKII expression profile and phosphorylation were analyzed during the larval stage of H. armigera. A, analysis of CaMKII expression profiles by Western blot using polyclonal antibody against H. armigera CaMKII and qRT-PCR. β-Actin was used as the quantity and quality control to normalize gene expression. The relative expression of CaMKII was calculated using the 2−ΔΔCT method. The data indicate the means ± S.D. of three independent biological experiments. 5F, fifth instar feeding larvae at 24 h after ecdysis; 5M, fifth instar molting larvae; 6-120, sixth instar larvae at 0–120 h; P-0, 0-day pupae; F, feeding; M, molting; MM, metamorphic molting; P, pupa. B, analysis of CaMKII phosphorylation by Western blot. 20E was injected into sixth instar larvae at 6 h (500 ng/larva). The total protein was extracted from tissues of 3–10 larvae at 5, 15, 30, and 60 min after 20E injection. DMSO was used as the negative control. Gel concentration of SDS-PAGE was 7.5%. Density statistical analyses of Western blot bands were acquired by Quantity One software based on three independent biological experiments. The bars indicate the means ± S.D. of three independent biological experiments. The asterisks denote significant differences as determined by Student's t test: *, p < 0.05; **, p < 0.01. C, the λ phosphatase treatment was conducted using protein extracts from 20E-treated HaEpi cells (2 μm for 0.5 h). β-Actin was used as a protein control using antiserum against β-actin in H. armigera. Gel concentration of SDS-PAGE was 7.5%.
FIGURE 2.
FIGURE 2.
20E-induced CaMKII phosphorylation and nuclear translocation. A, 20E induced CaMKII phosphorylation, which could be depressed by inhibitors and dsRNA transfection. HaEpi cells were incubated with suramin (50 μm), SU6668 (5 μm), U73122 (10 μm), or XeC (3 μm) for 30 min, or dsErGPCR1, dsErGPCR2, dsGαq, or dsGFP (1 μg/ml in the medium) for 12 h. Subsequently, the cells were incubated with 20E (2 μm) for 0.5 h. DMSO was used as the 20E solvent control. dsGFP was transfected as the nonspecific dsRNA control. The total protein was extracted for Western blot. β-Actin was used as the loading control. Density statistical analyses of Western blot bands were acquired by Quantity One software based on three independent biological experiments. The bars indicate the means ± S.D. of three independent biological experiments. The asterisks denote significant differences as determined by Student's t test: *, p < 0.05; **, p < 0.01. Panel a, semiquantitative RT-PCR determined the efficiencies of ErGPCR1, ErGPCR2, and Gαq knockdown. B, 20E promoted nuclear translocation of CaMKII. The CaMKII-RFP-His, CaMKII-T290A-RFP-His, or pIEx-4-RFP-His was overexpressed in HaEpi cells, after which the cells were treated with 20E (2 μm) for 0.5 h. DMSO was used as the solvent control. Red fluorescence indicated CaMKII-RFP-His, CaMKII-T290A-RFP-His, or pIEx-RFP-His (control). The yellow bars denote 20 μm at 40× magnification. Blue fluorescence distinguishes the cell nucleus stained by DAPI. The fluorescence was observed using an Olympus BX51 fluorescence microscope (Shinjuku-ku, Tokyo, Japan). C, Western blot was performed to confirm CaMKII phosphorylation and nuclear translocation under 20E induction. D, Western blot showed CaMKII phosphorylation and CaMKII-T290A-RFP-His nonphosphorylation in HaEpi cells under 20E induction. β-Actin was used as a protein control. Panel d, Western blot was performed to exclude RFP phosphorylation and nuclear translocation under 20E induction. Nu, nuclear fraction; Cy, cytoplasmic fraction; Loading control, SDS-PAGE. Gel concentration of SDS-PAGE was 7.5%.
FIGURE 3.
FIGURE 3.
CaMKII knockdown blocked larval-pupal transition and 20E response gene expression. A, insect phenotypes after CaMKII and GFP (negative control) knockdown (dsCaMKII or dsGFP was injected into sixth instar larvae at 6 h). The photograph was captured at pupal stage using a Nikon E995 digital camera (Hiyoda-ku, Tokyo, Japan). B, statistical analysis of phenotypes after CaMKII and GFP knockdown. Abnormal pupae display larval-pupal chimeras. dsGFP was used as nonspecific dsRNA control. The bars indicate the means ± S.D. of three independent biological experiments (with 30 larvae individuals per replication). The asterisks denotes significant differences as determined by Student's t test: *, p < 0.05. C, expression levels of 20E-induced genes in larval midgut after knockdown of CaMKII and GFP (negative control). dsCaMKII or dsGFP was injected into sixth instar larvae at 6 h, and then the total mRNA was isolated from larval midgut at 6–120 h for qRT-PCR analysis. D, expression levels of 20E-induced genes after CaMKII and GFP (negative control) knockdown in HaEpi cells. Cells were transfected with dsCaMKII (1 μg/ml in the medium) for 12 h and subsequently treated with 20E (2 μm) for 6 h. An equivalent volume of DMSO was applied to cells as solvent control for 20E. In the experiments of C and D, dsGFP and β-actin were used as nonspecific dsRNA and quantitative control, respectively. The relative expression of 20E-induced genes was calculated by qRT-PCR analysis using the 2−ΔΔCT method. The bars indicate the means ± S.D. of three independent biological experiments. The asterisks denote significant differences as determined by Student's t test: *, p < 0.05; **, p < 0.01.
FIGURE 4.
FIGURE 4.
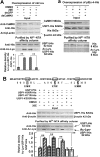
CaMKII regulated USP1 lysine acetylation under 20E induction. A, 20E induce USP1 lysine acetylation through CaMKII. USP1-His was overexpressed in HaEpi cells. Subsequently, the cells were treated with 20E (2 μm) for 1 h. DMSO was used as the negative control. Input, protein expression levels of CaMKII, USP1-His, and β-actin in HaEpi cells, which were detected by Western blot using antibody anti-CaMKII, anti-His, and anti-β-actin, respectively. Gel concentration of SDS-PAGE was 10%. USP1-His lysine acetylation was detected by Western blot using anti-Ac-Lys antibody after being purified by Ni2+-NTA affinity column. Panel a, His tag was overexpressed by the plasmid pIEx-4-His as a control, and the lysine acetylation was detected by the same methods as described in A. B, identification of the 20E-induced acetylation site in USP1. Plasmid of USP1-His, USP1-K58R-His, USP1-K71R-His, or USP1-K303R-His was overexpressed in HaEpi cells, after which the cells were treated with 20E (2 μm) for 1 h. DMSO was used as the solvent control. Input, expression levels of USP1-His, USP1-K58R-His, USP1-K71R-His, and USP1-K303R-His in HaEpi cells were detected by Western blot using antibody against His tag. β-Actin was used as loading control. The gel concentration of SDS-PAGE was 10%. Density statistical analyses of Western blot bands were acquired by Quantity One software based on three independent biological experiments. The bars indicate the means ± S.D. of three independent biological experiments. The asterisks denote significant differences as determined by Student's t test: **, p < 0.01.
FIGURE 5.
FIGURE 5.
20E induced HR3 transcription through HDAC3. Cells were transfected with dsHDAC3, dsHDAC4, or dsHDAC6 (1 μg/ml in the medium) for 12 h and subsequently treated with 20E (2 μm) for 6 h. An equivalent volume of DMSO was applied to cells as solvent control for 20E, and dsGFP was used as nonspecific dsRNA. Total mRNA was isolated for qRT-PCR analysis using the 2−ΔΔCT method. The bars indicate the means ± S.D. of three independent biological experiments. The asterisks denote significant differences as determined by Student's t test: *, p < 0.05; **, p < 0.01.
FIGURE 6.
FIGURE 6.
20E induced HDAC3 phosphorylation and nuclear export through CaMKII to maintain USP1 lysine acetylation. A, 20E regulated HDAC3 subcellular location through activating CaMKII in HaEpi cells. The HDAC3-RFP-His or pIEx-4-RFP-His (negative control) was overexpressed in HaEpi cells, and the cells were transfected with dsCaMKII or dsGFP (1 μg/ml in the medium) for 12 h. dsGFP was used as the nonspecific dsRNA control. The cells were treated with 20E (2 μm) for 0.5 h for immunocytochemical localization analysis. An equivalent volume of DMSO was applied to cells as solvent control for 20E. Red fluorescence indicated HDAC3-RFP-His or pIEx-4-RFP-His. The yellow bars denote 20 μm at 40× magnification. Blue fluorescence distinguished the cell nucleus stained by DAPI. The fluorescence was observed using an Olympus BX51 fluorescence microscope. B, 20E induced HDAC3 phosphorylation, which could be depressed by dsCaMKII treatment in HaEpi cells. The number of moles of phosphorus per mole of HDAC3-RFP-His was determined using a phosphoprotein phosphate estimation assay kit after HDAC3-RFP-His was purified by Ni2+-NTA affinity column. HDAC3-RFP-His was overexpressed in HaEpi cells, after which the cells were treated with dsCaMKII and treated with 2 μm 20E or an equivalent amount of DMSO for 0.5 h. pIEx-4-RFP-His was overexpressed as the control. Significant difference was determined by Student's t test based on three independent biological experiments: *, p < 0.05. C, 20E-induced USP1 lysine acetylation was depressed by HDAC3 in the nucleus. USP1-His and HDAC3-RFP-His were co-overexpressed in HaEpi cells, after which the cells were treated with dsCaMKII and treated with 20E (2 μm for 1 h). pIEx-4-RFP, USP1-His co-overexpression, and dsGFP were used as the negative controls. USP1-His was isolated by Ni2+-NTA affinity column and detected by Western blot using antibody anti-His and anti-Ac-Lys. Input, protein expression levels of CaMKII, HDAC3-RFP-His, RFP-tag, USP1-His, and β-actin in HaEpi cells were detected by Western blot using antibody anti-CaMKII, anti-RFP, anti-His, and anti-β-actin, respectively. Gel concentration of SDS-PAGE was 10%. Density statistical analyses of Western blot bands of Ac-Lys-USP1-His/USP1-His were acquired by Quantity One software based on three independent biological experiments. The bars indicate the means ± S.D. of three independent biological experiments. The asterisks denotes significant differences as determined by Student's t test: *, p < 0.05.
FIGURE 7.
FIGURE 7.
20E, via activating CaMKII, regulated USP1 lysine acetylation to determine its interaction with EcRB1. A, CaMKII regulated the formation of EcRB1 and USP1 heterodimer under 20E induction. USP1-His and EcRB1-RFP-His were overexpressed in HaEpi cells, after which the cells were transfected with dsCaMKII and dsGFP (1 μg/ml in the medium) for 12 h prior to incubation with 20E (2 μm) for 3 h. DMSO was used as the solvent control. Input, protein expression levels of CaMKII, EcRB1-RFP-His, USP1-His, and β-actin in HaEpi cells were detected by Western blot using antibody anti-CaMKII, anti-RFP, anti-His, and anti-β-actin, respectively. Co-IP, EcRB1-RFP-His was immunoprecipitated with antibody against RFP, and the co-precipitated USP1-His was detected by Western blot using antibody anti-His. Gel concentration of SDS-PAGE was 10%. Density statistical analyses of Western blot bands were acquired by Quantity One software based on three independent biological experiments. The bars indicate the means ± S.D. of three independent biological experiments. The asterisks denotes significant differences, as determined by Student's t test: *, p < 0.05. Panel a, pIEx-4-His and pIEx-4-RFP-His were overexpressed in HaEpi cells as the negative controls. The cells were treated, and the proteins were detected by the same methods used in A. B, USP1 lysine acetylation was necessary to form the EcRB1 and USP1 heterodimer. USP1-His, USP1-K303R-His, and EcRB1-RFP-His were overexpressed in HaEpi cells, after which the cells were treated with 20E (2 μm) for 3 h. DMSO was used as solvent control. Input, protein expression levels of EcRB1-RFP-His, USP1-His, USP1-K303R-His, and β-actin in HaEpi cells were detected by Western blot using antibody anti-RFP, anti-His, and anti-β-actin, respectively. Co-IP, EcRB1-RFP-His was immunoprecipitated with antibody against RFP, and the co-precipitated USP1-His or USP1-K303R-His was detected by Western blot using antibody anti-His. Gel concentration of SDS-PAGE was 10%. Density statistical analyses of Western blot bands were acquired by Quantity One software based on three independent biological experiments. The bars indicate the means ± S.D. of three independent biological experiments. The asterisks denote significant differences as determined by Student's t test: **, p < 0.01. C, ChIP and qRT-PCR analyses of the binding capabilities of USP1-His and USP1-K303R-His to EcRE in the HR3 promoter by anti-His precipitation. USP1-His or USP1-K303R-His was overexpressed in HaEpi cells, after which the cells were treated with 20E (2 μm) for 3 h. DMSO was used as solvent control. Expression levels of USP1-His, USP1-K303R-His, and His tag in HaEpi cells were detected by Western blot using antibody anti-His. β-Actin was used as loading control. pIEx-4-His was overexpressed and used as negative control for ChIP analysis. Gel concentration of SDS-PAGE was 10%. The relative expression was calculated by qRT-PCR with the DNA template in the precipitates by antibody anti-His. The bars indicate the means ± S.D. of three independent biological experiments. The asterisks denotes significant difference as determined by Student's t test: **, p < 0.01.
FIGURE 8.
FIGURE 8.
Explanation for the role of CaMKII involved in the 20E pathways. 20E induced CaMKII phosphorylation via ErGPCRs, Gαq, PLC, and calcium signaling pathways. Phosphorylated CaMKII enters the nucleus to regulate USP1 lysine acetylation via induction of HDAC3 phosphorylation and nuclear export. The lysine-acetylated USP1 interacts with EcRB1 to form the EcRB1-USP1 transcriptional complex, which binds with EcRE to initiate genes transcription in the 20E pathway.

Similar articles

Cited by

References

    1. Thompson E. B. (1995) Steroid hormones: membrane transporters of steroid hormones. Curr. Biol. 5, 730–732 - PubMed
    1. Meldrum D. R. (2007) G-protein-coupled receptor 30 mediates estrogen's nongenomic effects after hemorrhagic shock and trauma. Am. J. Pathol. 170, 1148–1151 - PMC - PubMed
    1. Sandén C., Broselid S., Cornmark L., Andersson K., Daszkiewicz-Nilsson J., Mårtensson U. E., Olde B., Leeb-Lundberg L. M. (2011) G protein-coupled estrogen receptor 1/G protein-coupled receptor 30 localizes in the plasma membrane and traffics intracellularly on cytokeratin intermediate filaments. Mol. Pharmacol. 79, 400–410 - PubMed
    1. Falkenstein E., Tillmann H. C., Christ M., Feuring M., Wehling M. (2000) Multiple actions of steroid hormones: a focus on rapid, nongenomic effects. Pharmacol. Rev. 52, 513–556 - PubMed
    1. Davis P. J., Tillmann H. C., Davis F. B., Wehling M. (2002) Comparison of the mechanisms of nongenomic actions of thyroid hormone and steroid hormones. J. Endocrinol. Invest. 25, 377–388 - PubMed

Publication types

MeSH terms

Associated data

LinkOut - more resources