

Analysis of cytochrome P450 CYP119 ligand-dependent conformational dynamics by two-dimensional NMR and X-ray crystallography
- PMID: 25670859
- PMCID: PMC4400317
- DOI: 10.1074/jbc.M114.627935
Analysis of cytochrome P450 CYP119 ligand-dependent conformational dynamics by two-dimensional NMR and X-ray crystallography
Abstract
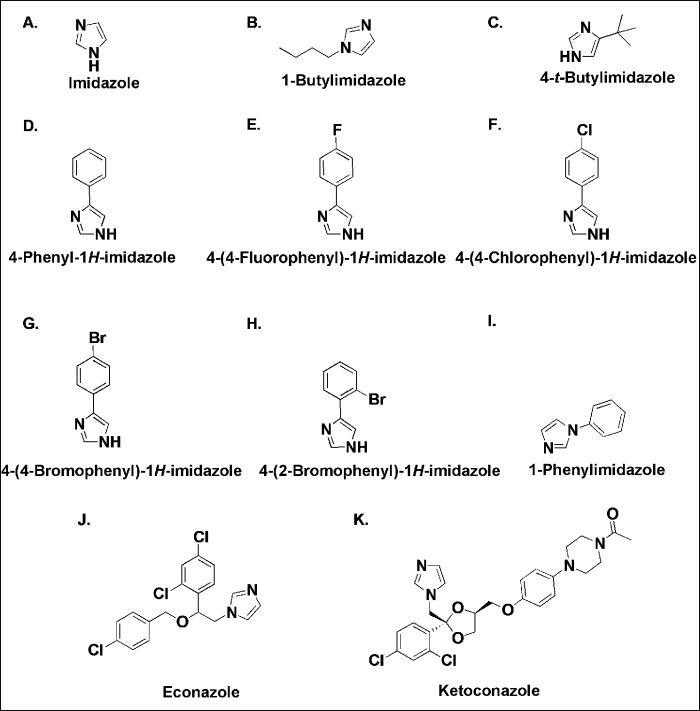
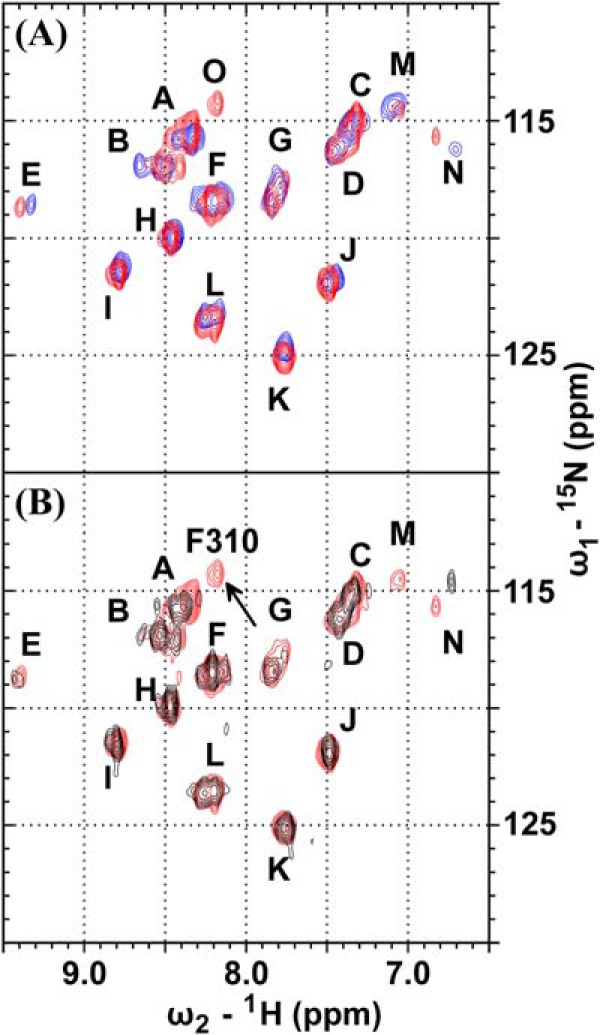
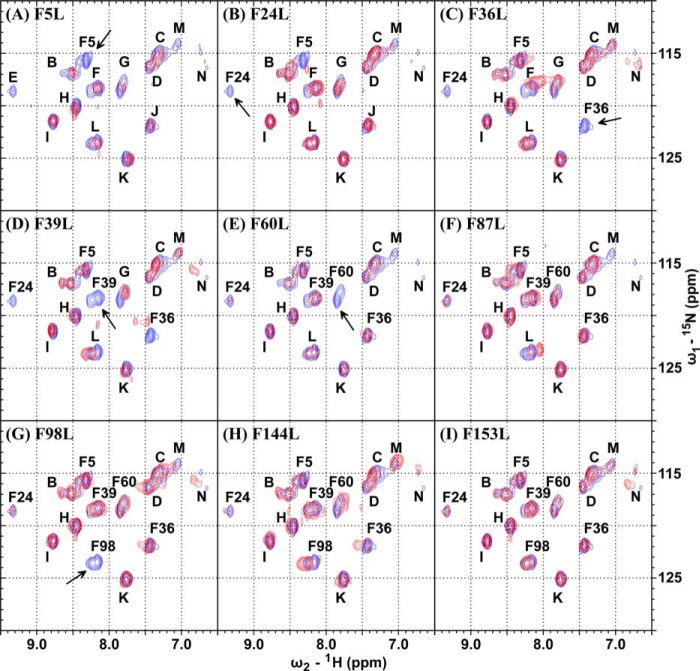
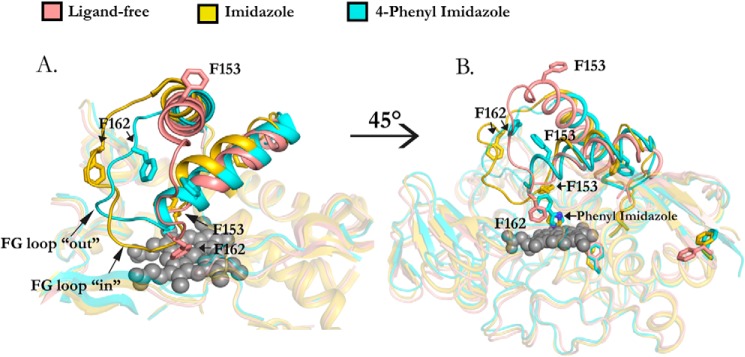
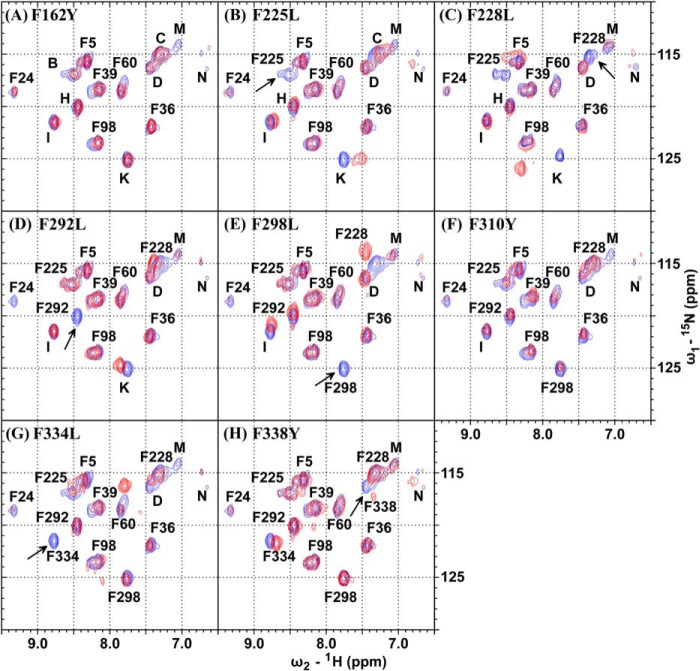
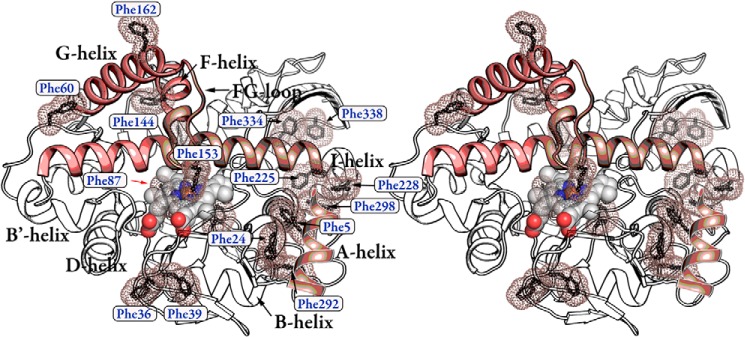
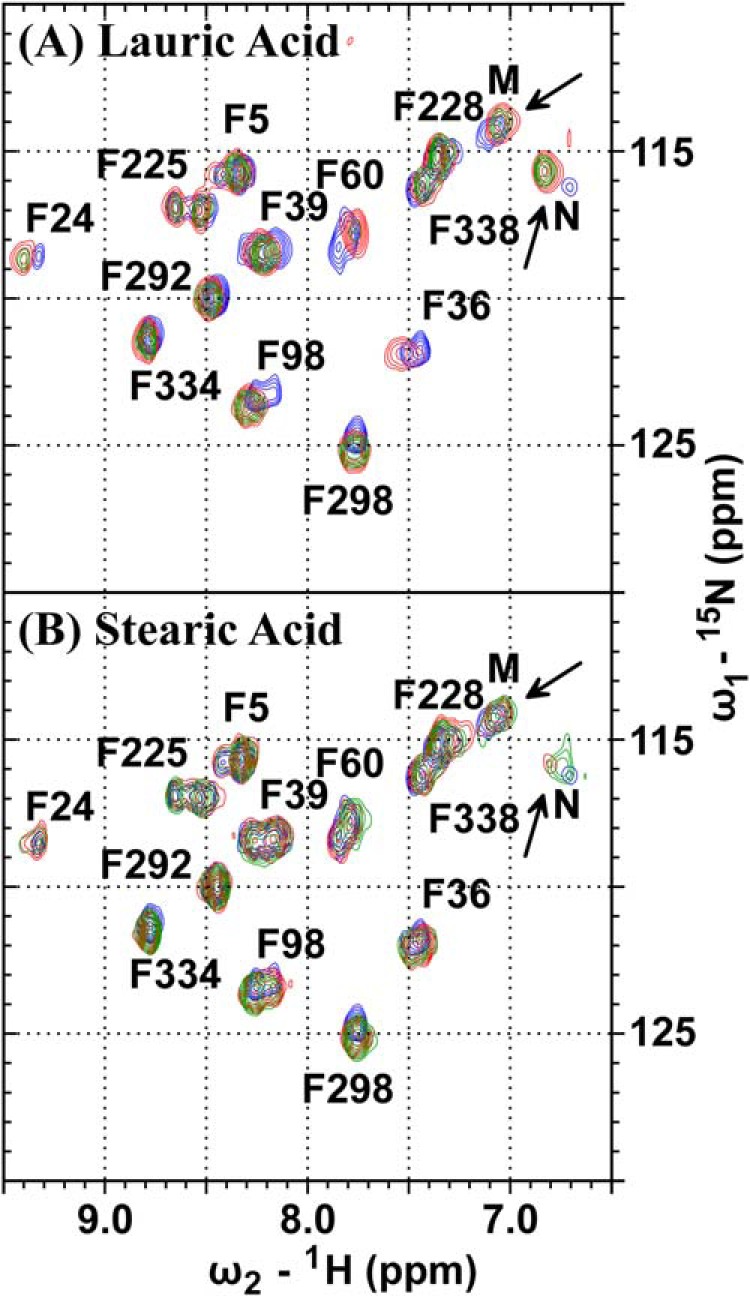
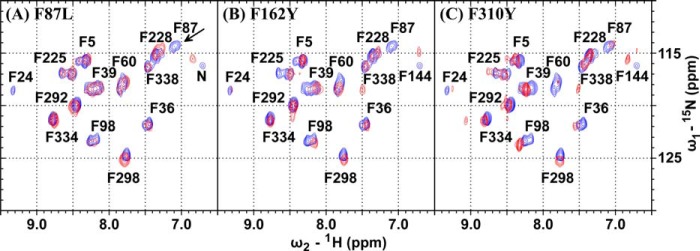
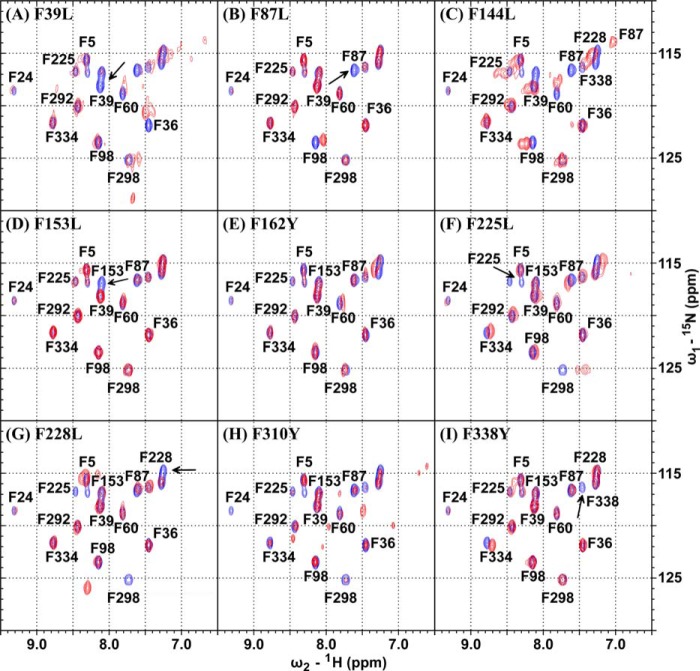
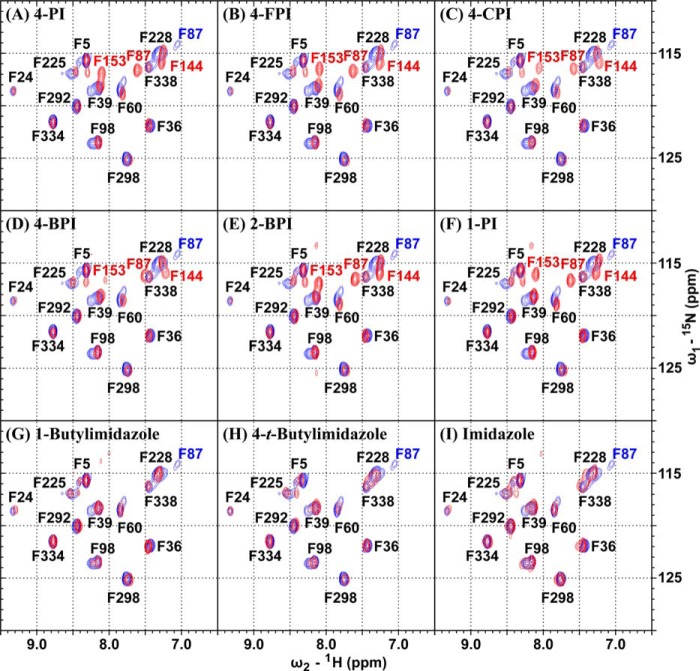
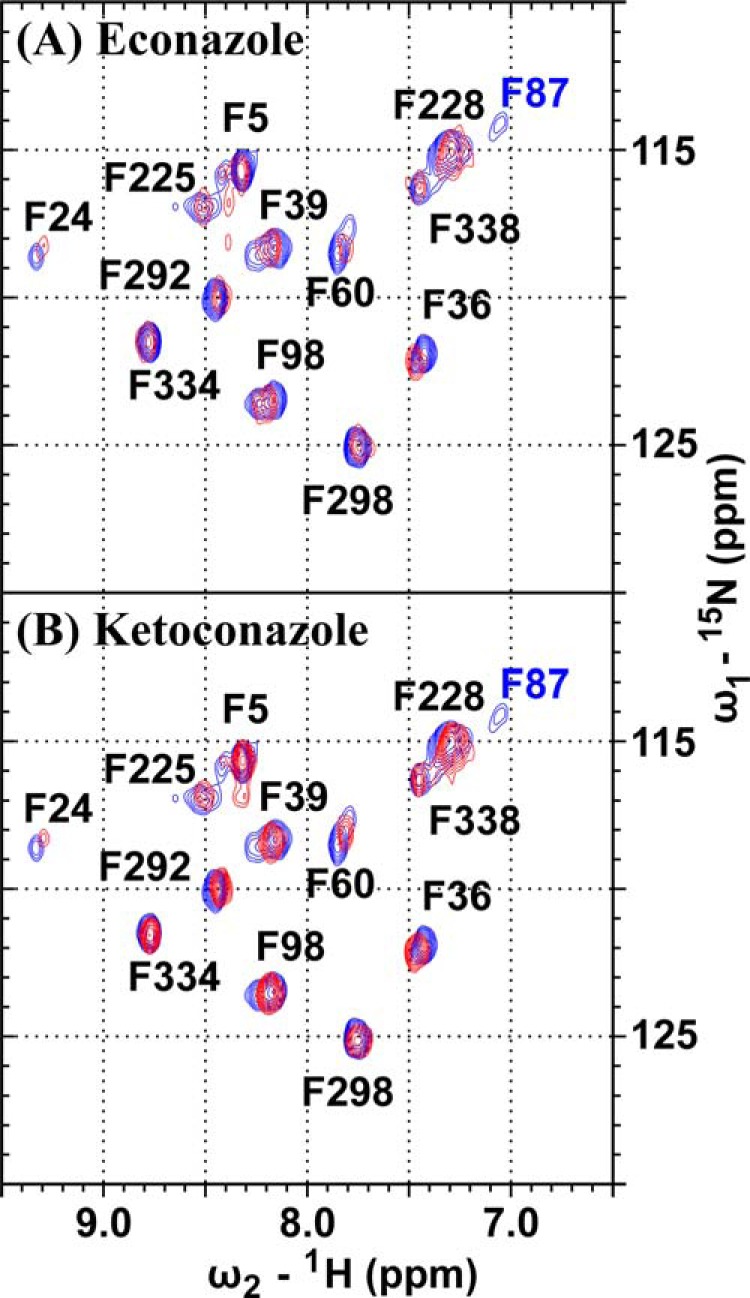
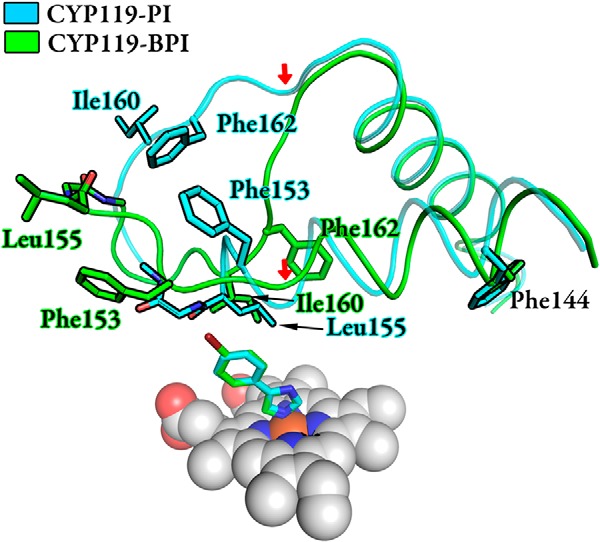
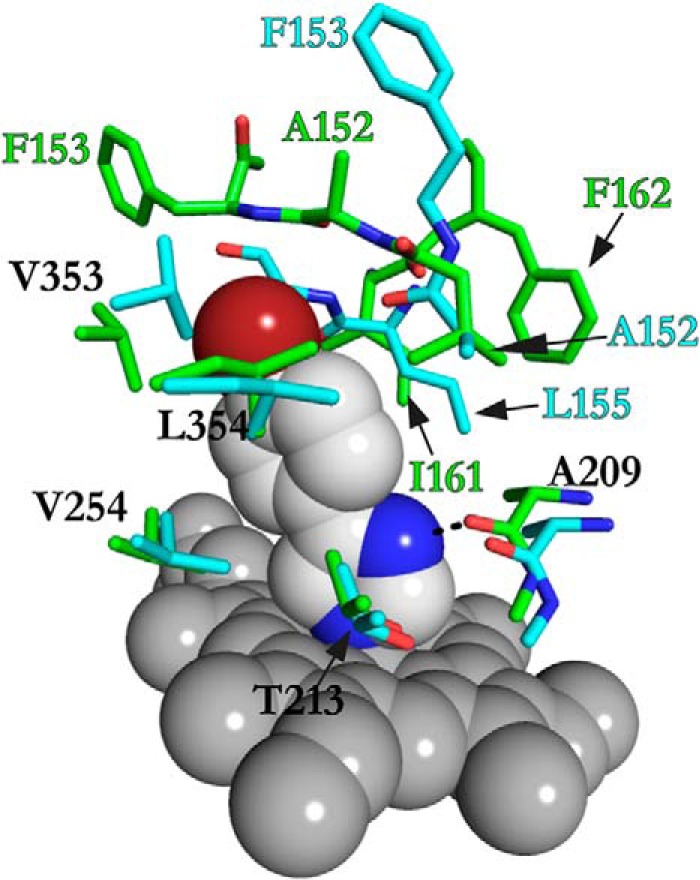
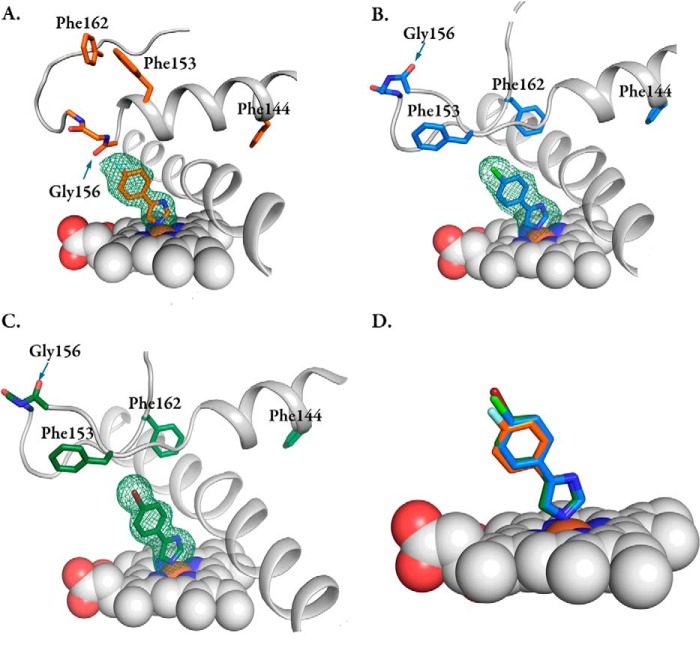
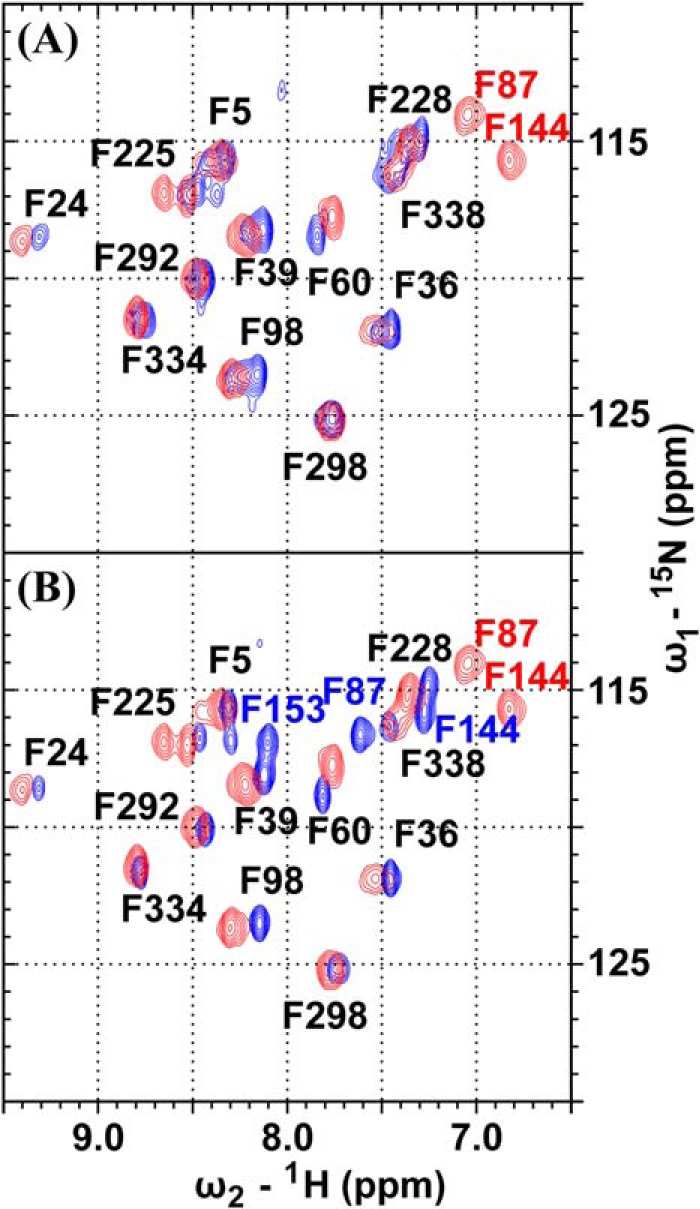
Defining the conformational states of cytochrome P450 active sites is critical for the design of agents that minimize drug-drug interactions, the development of isoform-specific P450 inhibitors, and the engineering of novel oxidative catalysts. We used two-dimensional (1)H,(15)N HSQC chemical shift perturbation mapping of (15)N-labeled Phe residues and x-ray crystallography to examine the ligand-dependent conformational dynamics of CYP119. Active site Phe residues were most affected by the binding of azole inhibitors and fatty acid substrates, in agreement with active site localization of the conformational changes. This was supported by crystallography, which revealed movement of the F-G loop with various azoles. Nevertheless, the NMR chemical shift perturbations caused by azoles and substrates were distinguishable. The absence of significant chemical shift perturbations with several azoles revealed binding of ligands to an open conformation similar to that of the ligand-free state. In contrast, 4-phenylimidazole caused pronounced NMR changes involving Phe-87, Phe-144, and Phe-153 that support the closed conformation found in the crystal structure. The same closed conformation is observed by NMR and crystallography with a para-fluoro substituent on the 4-phenylimidazole, but a para-chloro or bromo substituent engendered a second closed conformation. An open conformation is thus favored in solution with many azole ligands, but para-substituted phenylimidazoles give rise to two closed conformations that depend on the size of the para-substituent. The results suggest that ligands selectively stabilize discrete cytochrome P450 conformational states.
Keywords: Conformational Change; Cytochrome P450; Molecular Dynamics; Nuclear Magnetic Resonance (NMR); X-ray Crystallography.
© 2015 by The American Society for Biochemistry and Molecular Biology, Inc.
Figures
Similar articles
-
Two-dimensional NMR and all-atom molecular dynamics of cytochrome P450 CYP119 reveal hidden conformational substates.J Biol Chem. 2010 Mar 26;285(13):9594-9603. doi: 10.1074/jbc.M109.087593. Epub 2010 Jan 22. J Biol Chem. 2010. PMID: 20097757 Free PMC article.
-
Thermophilic cytochrome P450 (CYP119) from Sulfolobus solfataricus: high resolution structure and functional properties.J Inorg Biochem. 2002 Sep 20;91(4):491-501. doi: 10.1016/s0162-0134(02)00446-4. J Inorg Biochem. 2002. PMID: 12237217
-
Ligand-induced conformational heterogeneity of cytochrome P450 CYP119 identified by 2D NMR spectroscopy with the unnatural amino acid (13)C-p-methoxyphenylalanine.J Am Chem Soc. 2008 Dec 3;130(48):16168-9. doi: 10.1021/ja8071463. J Am Chem Soc. 2008. PMID: 18998650 Free PMC article.
-
Structural features of cytochromes P450 and ligands that affect drug metabolism as revealed by X-ray crystallography and NMR.Future Med Chem. 2010 Sep;2(9):1451-68. doi: 10.4155/fmc.10.229. Future Med Chem. 2010. PMID: 21103389 Free PMC article. Review.
-
Conformational diversity and ligand tunnels of mammalian cytochrome P450s.Biotechnol Appl Biochem. 2013 Jan-Feb;60(1):134-45. doi: 10.1002/bab.1074. Biotechnol Appl Biochem. 2013. PMID: 23587001 Review.
Cited by
-
Directed Evolution of Artificial Metalloenzymes in Whole Cells.Angew Chem Int Ed Engl. 2022 Jan 26;61(5):e202110519. doi: 10.1002/anie.202110519. Epub 2021 Dec 22. Angew Chem Int Ed Engl. 2022. PMID: 34766418 Free PMC article.
-
Spectroscopic studies of the cytochrome P450 reaction mechanisms.Biochim Biophys Acta Proteins Proteom. 2018 Jan;1866(1):178-204. doi: 10.1016/j.bbapap.2017.06.021. Epub 2017 Jun 28. Biochim Biophys Acta Proteins Proteom. 2018. PMID: 28668640 Free PMC article. Review.
-
Advances in the Understanding of Protein-Protein Interactions in Drug Metabolizing Enzymes through the Use of Biophysical Techniques.Front Pharmacol. 2017 Aug 8;8:521. doi: 10.3389/fphar.2017.00521. eCollection 2017. Front Pharmacol. 2017. PMID: 28848438 Free PMC article. Review.
-
Pervasive cooperative mutational effects on multiple catalytic enzyme traits emerge via long-range conformational dynamics.Nat Commun. 2021 Mar 12;12(1):1621. doi: 10.1038/s41467-021-21833-w. Nat Commun. 2021. PMID: 33712579 Free PMC article.
-
Synthesis, Optimization, Antifungal Activity, Selectivity, and CYP51 Binding of New 2-Aryl-3-azolyl-1-indolyl-propan-2-ols.Pharmaceuticals (Basel). 2020 Aug 8;13(8):186. doi: 10.3390/ph13080186. Pharmaceuticals (Basel). 2020. PMID: 32784450 Free PMC article.
References
-
- Nebert D. W., Dalton T. P. (2006) The role of cytochrome P450 enzymes in endogenous signalling pathways and environmental carcinogenesis. Nat. Rev. Cancer 6, 947–960 - PubMed
-
- Ingelman-Sundberg M. (2004) Pharmacogenetics of cytochrome P450 and its applications in drug therapy: the past, present and future. Trends Pharmacol. Sci. 25, 193–200 - PubMed
-
- Martinez C. A., Rupashinghe S. G. (2013) Cytochrome P450 bioreactors in the pharmaceutical industry: challenges and opportunities. Curr. Top. Med. Chem. 13, 1470–1490 - PubMed
-
- Hopkins A. L., Groom C. R. (2002) The druggable genome. Nat. Rev. Drug Discov. 1, 727–730 - PubMed
-
- Wackett L. P. (1998) Directed evolution of new enzymes and pathways for environmental biocatalysis. Ann. N.Y. Acad. Sci. 864, 142–152 - PubMed
Publication types
MeSH terms
Substances
Associated data
- Actions
- Actions
- Actions
- Actions
