

A Genome-Wide Screen for Large-Effect Alloimmunization Susceptibility Loci among Red Blood Cell Transfusion Recipients with Sickle Cell Disease
- PMID: 25670933
- PMCID: PMC4280456
- DOI: 10.1159/000369079
A Genome-Wide Screen for Large-Effect Alloimmunization Susceptibility Loci among Red Blood Cell Transfusion Recipients with Sickle Cell Disease
Abstract
Background: A selective susceptibility of certain individuals to form multiple alloantibodies in response to red cell transfusion is well-recognized in clinical practice, and is a particular problem in persons with sickle cell disease (SCD). The reason for this differential susceptibility is unclear, but inter-individual genetic differences are likely to contribute.
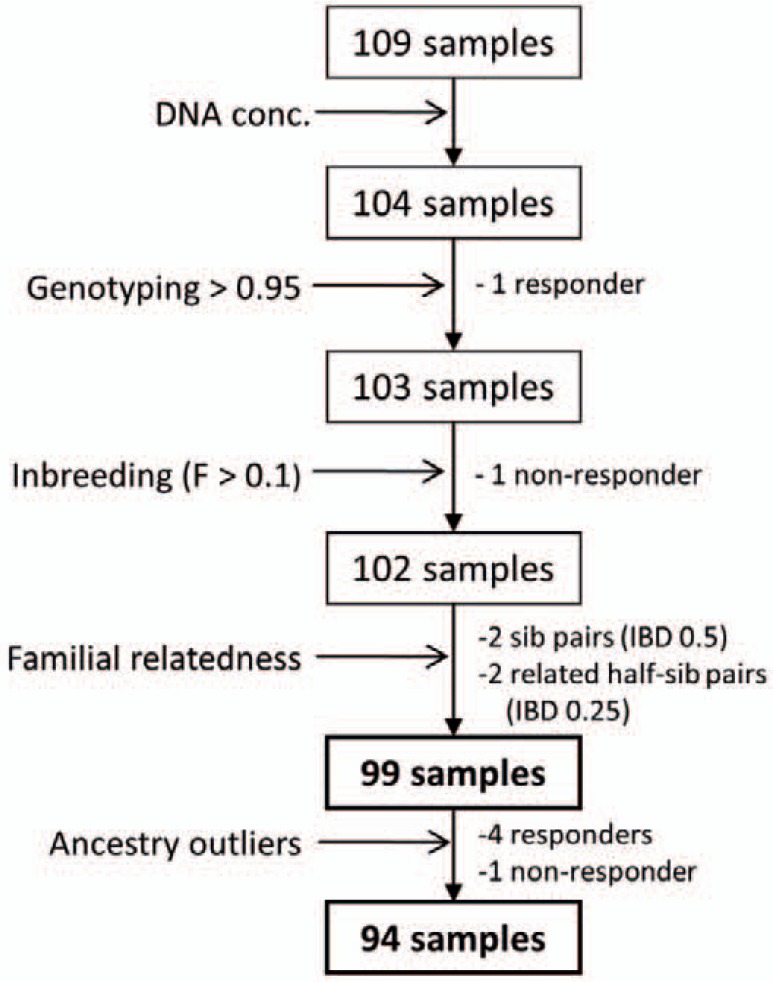
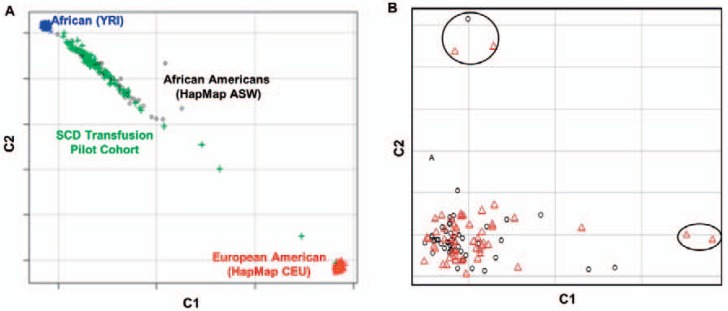
Methods: We conducted a pilot case-control genome-wide association study using 1,000,000 SNPs in 94 alloimmune responders (cases) and non-responders (controls) with SCD in order to identify loci of large effect size associated with alloimmunization.
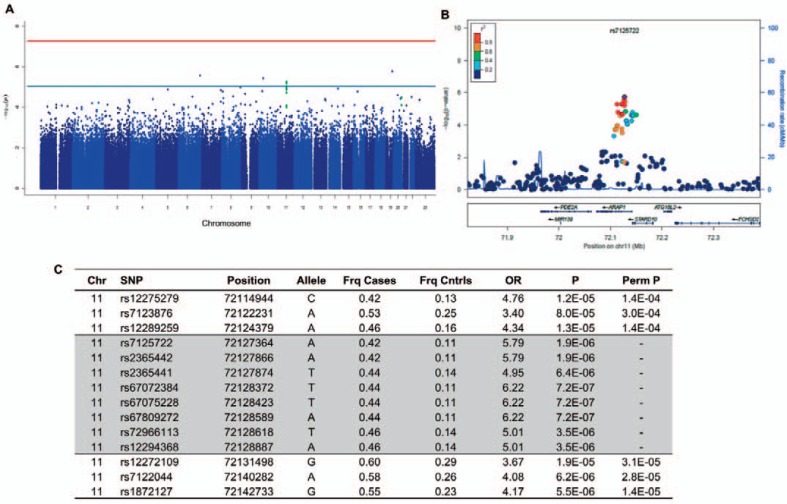
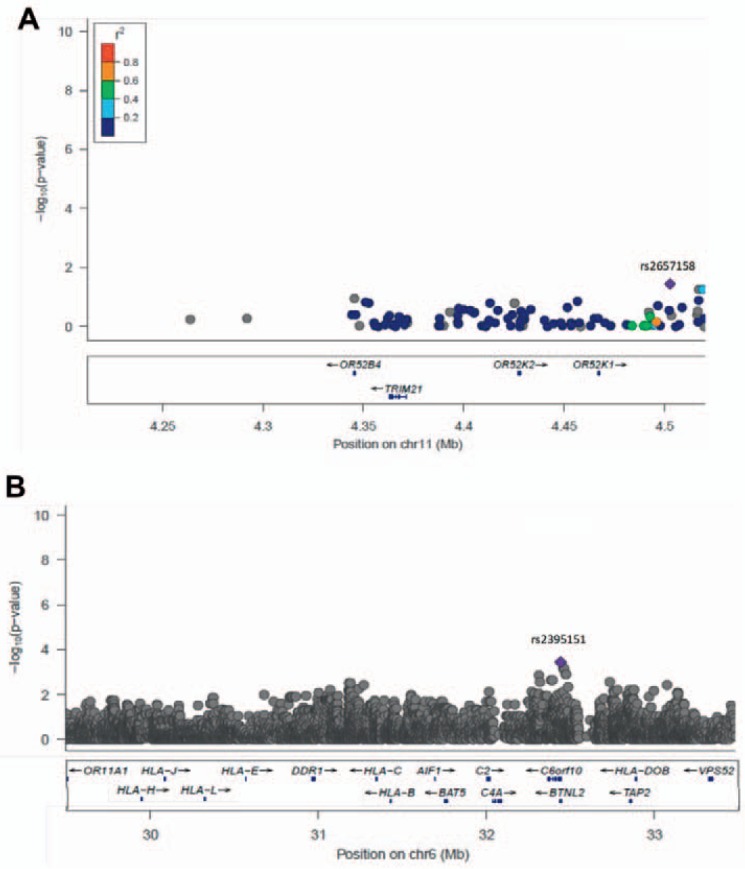
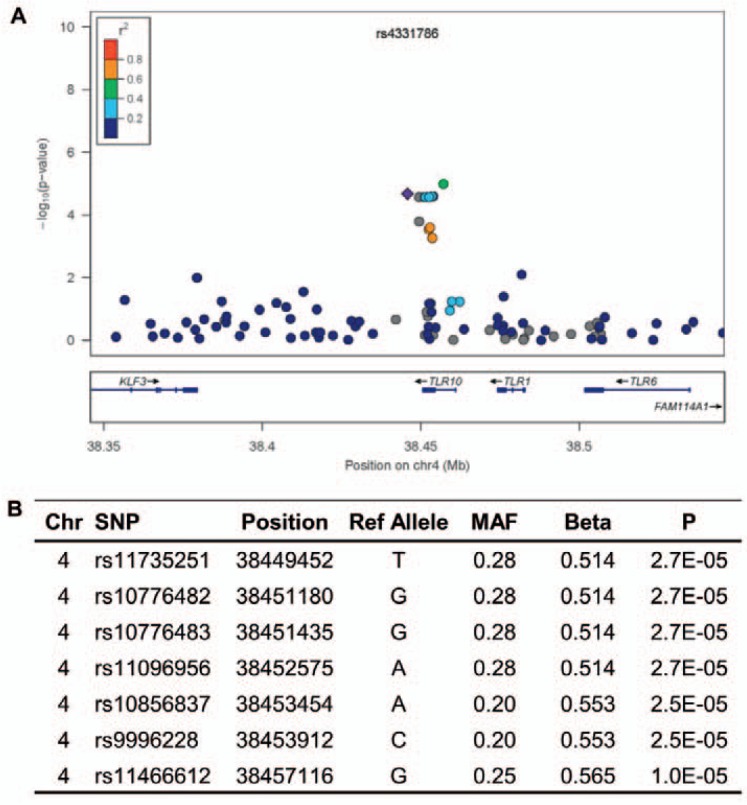
Results: No loci showed evidence of association at a genome-wide significance cut-off (p < 0.5 × 10(-8)). SNPs in the ARAP1/STARD10 region showed suggestive association (p < 1 × 10(-6)), but no association was observed at previously implicated loci TRIM21 or HLA. In analyses of the number of accumulated antibodies, a modest association was found with SNPs in the Toll-like receptor gene TLR10 (p < 1 × 10(-4)).
Conclusions: Alloimmunization in persons with SCD is unlikely to be mediated by loci of very large effect size; however, larger and more comprehensive studies are required to fully evaluate loci with more moderate effects. This study provides a working approach to such future studies in SCD.
Keywords: African American; GWAS; Genome-wide association studies; Genomics; Responders.
Figures
References
-
- Schonewille H, Haak HL, van Zijl AM. Alloimmunization after blood transfusion in patients with hematologic and oncologic diseases. Transfusion. 1999;39:763–771. - PubMed
-
- Heddle NM, Soutar RL, O'Hoski PL, Singer J, McBride JA, Ali MA, Kelton JG. A prospective study to determine the frequency and clinical significance of alloimmunization post-transfusion. Br J Haematol. 1995;91:1000–1005. - PubMed
-
- Rosse WF, Gallagher D, Kinney TR, Castro O, Dosik H, Moohr J, Wang W, Levy PS. Transfusion and alloimmunization in sickle cell disease. The Cooperative Study of Sickle Cell Disease. Blood. 1990;76:1431–1437. - PubMed
-
- Aygun B, Padmanabhan S, Paley C, Chandrasekaran V. Clinical significance of RBC alloantibodies and autoantibodies in sickle cell patients who received transfusions. Transfusion. 2002;42:37–43. - PubMed
-
- Bauer MP, Wiersum-Osselton J, Schipperus M, Vandenbroucke JP, Briet E. Clinical predictors of alloimmunization after red blood cell transfusion. Transfusion. 2007;47:2066–2071. - PubMed
Grants and funding
LinkOut - more resources
Full Text Sources
Other Literature Sources
Research Materials
