Review
. 2014 Nov 13;3(1):25.
doi: 10.1186/2047-9158-3-25. eCollection 2014.

Dual destructive and protective roles of adaptive immunity in neurodegenerative disorders

Affiliations
Review

Dual destructive and protective roles of adaptive immunity in neurodegenerative disorders

Kristi M Anderson et al. Transl Neurodegener. .

Abstract

Inappropriate T cell responses in the central nervous system (CNS) affect the pathogenesis of a broad range of neuroinflammatory and neurodegenerative disorders that include, but are not limited to, multiple sclerosis, amyotrophic lateral sclerosis, Alzheimer's disease and Parkinson's disease. On the one hand immune responses can exacerbate neurotoxic responses; while on the other hand, they can lead to neuroprotective outcomes. The temporal and spatial mechanisms by which these immune responses occur and are regulated in the setting of active disease have gained significant recent attention. Spatially, immune responses that affect neurodegeneration may occur within or outside the CNS. Migration of antigen-specific CD4+ T cells from the periphery to the CNS and consequent immune cell interactions with resident glial cells affect neuroinflammation and neuronal survival. The destructive or protective mechanisms of these interactions are linked to the relative numerical and functional dominance of effector or regulatory T cells. Temporally, immune responses at disease onset or during progression may exhibit a differential balance of immune responses in the periphery and within the CNS. Immune responses with predominate T cell subtypes may differentially manifest migratory, regulatory and effector functions when triggered by endogenous misfolded and aggregated proteins and cell-specific stimuli. The final result is altered glial and neuronal behaviors that influence the disease course. Thus, discovery of neurodestructive and neuroprotective immune mechanisms will permit potential new therapeutic pathways that affect neuronal survival and slow disease progression.

Keywords: Effector T cell; MCAM; MPTP; Migration; Neurodegeneration; Neuroinflammation; Neuroprotection; Regulatory T cell.


Figures

Figure 1
Figure 1
The immune system and neurodegeneration. Death or damage of neurons can be mediated via several mechanisms in the CNS. Upon insult, healthy neurons become damaged, causing release of self-antigens or modified proteins. These antigens remain in the CNS to activate surrounding resting microglia to an activated phenotype. Reactive microglia produce proinflammatory mediators such as neurotoxic cytokines and reactive oxygen and nitrogen species (ROS/RNS), increase oxidative stress, and further contribute to neuronal damage. Modified and misfolded self-proteins that drain into secondary lymphoid tissues are phagocytized, processed, and presented on MHC by APCs to naïve T cells (N). Upon recognition of antigen, T cells differentiate into antigen-specific T effector (Teff) or T regulatory (Treg) phenotypes. Teff subsets include Th1 (1), Th2 (2), Th9 (9), Th17 (17), Th22 (22), and cytotoxic T lymphocytes (CTLs). Additionally, reactive microglia signal proximal endothelial cells by cytokine and chemokine gradients to upregulate CAMs. In turn, activated Teffs such as Th1 and Th17 with upregulated integrins and CAM ligands bind CAMs via CAM-ligand interactions and extravasate across the BBB. Upon recognition of modified self-antigen presented by MHC of microglia/macrophages, activated Teffs generate neurotoxic and proinflammatory factors that drive M1 microglia or resting microglia to a higher reactive state and support a neurotoxic cascade. CD4+ Th1 or Th17 Teffs induce FAS ligand or produce neurotoxic cytokines such as TNF-α, IL-17, and IFN-γ that may directly interact with cognate receptors expressed by neurons. CD8+ CTLs can recognize antigen/MHC I complexes on neurons to induce perforin- and/or granzyme-mediated cytolysis. In response to inflammatory events, Tregs (R) attempt to counteract the neurotoxic cascade through inhibition of antigen presentation, production of anti-inflammatory cytokines, metabolic disruption, cytolysis of Teffs or reactive microglia, and induction of neurotrophic factors by astrocytes; all mechanisms aim to interdict the neuroinflammatory-neurodegenerative cycle and ultimately support neuronal survival.
Figure 2
Figure 2
Migration of activated T cells into brain. Peripherally, naïve T cells (N) encounter APC that present peptides from aberrant, misfolded, or aggregated proteins associated with neuroinflammatory processes. Upon presentation of antigen and delivery of appropriate co-stimulatory signals by APC, naïve T cells recognizing the antigen/MHC complex via the TCR become activated (A) leading to upregulation of CAMs on the T cell surface. These receptors and ligands include, but are not limited to, integrins, MCAM, and PSGL-1. Similarly, at sites of neuronal injury and neuroinflammation, danger signals, pro-inflammatory cytokines, and chemokines induce upregulation of endothelial associated CAMs on the basolateral side of the blood brain barrier. Following upregulation of CAMs, activated T cells (such as pro-inflammatory, anti-inflammatory or regulatory T cells) enter the vasculature and begin the process of extravasation via either a trans- or para-cellular route. This migratory process occurs in a step-wise manner beginning with T cells loosely tethering to endothelial cells via the binding of T cell ligands to selectins, such as E-selectin and other CAMs, such as VCAM, ICAM, and laminin 411 on the luminal side of the endothelial cells. Loose tethering allows the cell to roll along the luminal side of the endothelium and interact with CAMs, pulling it closer to the endothelial cell layer to eventual capture. Upon clustering of receptors and ligands on T cell and endothelial cell surfaces, the T cell begins "crawling" across the endothelial surface until reaching an endothelial cell junction, which signals the initiation of extravasation. Transmigration proceeds, via a chemotactic gradient allowing antigen-specific T cells entrance to the brain. Once in the parenchyma, activated T cells recognize antigen presented by MHC, initiating the efferent response program of the T cells to deliver either effector or regulatory function that supports the respective neurodegenerative or neuroprotective outcome.
Figure 3
Figure 3
MPTP-intoxication increases T cell migration. CD3+ T cells were obtained and enriched from spleen and lymph nodes of male donor C57BL/6J mice. Isolated T cells were activated with anti-CD3 for 3 days. Syngeneic recipients were treated with 4 doses of MPTP-HCl in PBS (18 mg/kg, based on freebase MPTP) or PBS alone; each dose administered at 2 hour intervals. Activated T cells were labeled with 111In-oxyquinoline (GE Healthcare), and 20 ×106111In-labeled T cells were adoptively transferred to each MPTP- or PBS-treated recipient. CT/SPECT images from each animal were acquired at 24, 48, 72, 96, and 120 hours post-transfer. For each mouse at each sampling time, electronic bit maps were drawn to circumscribe (A) brain, (B) lungs, (C) kidneys, (D) spleen, (E) cervical lymph nodes, (F) all other lymph nodes, and entire body. Counts of radiolabeled T cells were determined by digital image analysis software (VIVID, GE Healthcare) and corrected for decay from the time of labeling. Counts for each organ were normalized as the percentage of total body counts for each time (A-F). Means ± SEMs of radiolabel percentages were determined for 3–5 mice/treatment group and differences between the 2 treatment groups were determined by Student’s t-test where p ≤0.05 was considered significant.
Figure 4
Figure 4
Expression of MCAM (CD146) parallels MPTP treatment and adoptive T cell transfers. CD3+ T cells were obtained from donor mice expressing CD90.1 (Thy1.1) and were activated with anti-CD3. (A) Following activation, and prior to adoptive transfer (AT), donor cells were analyzed for co-expression of CD4 and CD146 (CD4+CD146+) (Pre AT). Activated donor T cells (Thy1.1) were adoptively transferred to recipient mice expressing CD90.2 (Thy1.2) after treatment with MPTP at dosages of 18 mg/kg every 2 hours for 4 doses or with PBS. Thus, detection of Thy1.1 or Thy1.2 by flow cytometric analysis differentiates donor (adoptively transferred) and recipient (endogenous) T cells, respectively. (A) Forty-eight hours after adoptive transfer (AT), spleens (SP) and lymph nodes (LN) were removed from recipient animals and cells were analyzed by flow cytometric analysis for percentages of CD4+CD146+ T cells among donor (Thy1.1) T cells. (B) Twenty-four or forty-eight hours after PBS- or MPTP-treatment, lymph nodes were removed from mice that did not receive adoptive transfer, and cells analyzed by flow cytometric analysis for percentages of CD4+CD146+ T cells among the endogenous Thy1.2+ T cells. Additionally, 48 hours after adoptive transfer, lymph nodes from recipient mice were removed and analyzed for percentages of CD4+CD146+ T cells among the endogenous recipient Thy1.2 T cells. Means ± SEMs were determined from data within the 95% confidence intervals of the means for n =4-5 mice per group and were compared by one-way ANOVA with Fisher’s LSD post-hoc test where p ≤0.05 was considered significant.
Figure 5
Figure 5
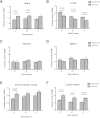
Anti-MCAM treatment affects T cell migration to the lungs but not brain. Donor CD4+ cells were isolated from spleens and lymph nodes of C57BL/6 male mice. T cells were activated and polarized by culture for 5 days in the presence of anti-CD3 and a Th17-polarizing cocktail (3 ng/ml TGF-β, 10 ng/ml IL-6, 5 ng/ml IL-1β, 10 ng/ml IL-23, 3 μg/ml anti IL-4, 3 μg/ml anti IL-12, 3 μg/ml anti IFN-ɣ, and 3 μg/ml anti IL-2). Th17 Teffs were harvested and labeled with 111In-oxyquinoline and 20 × 106111In-labeled Th17 Teffs were adoptively transferred to recipients treated with MPTP at dosages of 18 mg/kg every 2 hours for 4 doses. One hour prior to adoptive transfer and every 24 hours thereafter, recipients were treated ip with 10 mg/kg of either anti-MCAM or rat isotype control antibody. CT/SPECT images of each animal were acquired at 24, 48, and 72 hours post-transfer. Within tomographic images, electronic bit maps were drawn to circumscribe regions of interest that encompassed (A) brain, (B) lungs, (C) kidneys, (D) spleen, (E) cervical lymph nodes, (F) remaining lymph nodes, and included the entire body. Counts of radiolabeled T cells for each organ and entire body were determined by digital image analysis software (VIVID, GE Healthcare) and corrected for decay from the time of labeling. Counts for each organ were normalized as the percentage of total body counts at each time (A-F). Means ± SEMs of radiolabel percentages were determined for 3–4 mice/treatment group and differences of percentages between isotype antibody and anti-MCAM treatment groups were determined by Student’s t-test where p ≤0.05 was considered significant.
Figure 6
Figure 6
Blocking MCAM following N-4YSyn-specific splenocyte transfers elicits partial neuroprotection. Donor immune cells containing N-4YSyn-specific Teffs were obtained from spleens of mice immunized and boosted with N-4YSyn. To recipient mice that were treated with MPTP at dosages of 18 mg/kg every 2 hours for 4 doses, 30 × 106 donor cells were adoptively transferred (AT) twelve hours after the last dose of MPTP, while one group of MPTP mice received no donor immune cells. Of the 4 groups that received donor immune cells, one group received no other treatment, one group was treated with 10 mg/kg rat isotype control antibody (MPTP/Isotype/AT), one group with 10 mg/kg anti-MCAM antibody (MPTP/anti-MCAM/AT), and one group with 1 mg/kg fingolimod (MPTP/fingolimod/AT). Antibody and fingolimod treatments began the day before adoptive transfer and continued until the end of study. One group was treated with only PBS (PBS), and served as total neuron control. Seven days after MPTP treatment, mice were terminally anesthetized, transcardially perfused with PBS for exsanguination, fixed with 4% paraformaldehyde in PBS, and brains removed and processed for immunohistochemistry. Brains were sectioned through the midbrain, immunostained with rabbit anti-tyrosine hydroxylase (TH) and HRP-conjugated goat anti rabbit IgG, and visualized with DAB. Total numbers of surviving dopaminergic neurons (TH+) in the SN were quantified by stereological analysis (Stereo Investigator, MBF Bioscience). Means ± SEMs of total numbers of surviving dopaminergic neurons were determined from 5–8 mice per treatment group and were compared by one way ANOVA and Fisher’s LSD post-hoc test.

References

    1. Amor S, Peferoen LA, Vogel DY, Breur M, van der Valk P, Baker D, van Noort JM. Inflammation in neurodegenerative diseases–an update. Immunology. 2014;142:151–166. doi: 10.1111/imm.12233. - DOI - PMC - PubMed
    1. Mosley RL, Hutter-Saunders JA, Stone DK, Gendelman HE. Inflammation and adaptive immunity in Parkinson’s disease. Cold Spring Harb Perspect Med. 2012;2:a009381. doi: 10.1101/cshperspect.a009381. - DOI - PMC - PubMed
    1. Pachter JS, de Vries HE, Fabry Z. The blood–brain barrier and its role in immune privilege in the central nervous system. J Neuropathol Exp Neurol. 2003;62:593–604. - PubMed
    1. Carson MJ, Doose JM, Melchior B, Schmid CD, Ploix CC. CNS immune privilege: hiding in plain sight. Immunol Rev. 2006;213:48–65. doi: 10.1111/j.1600-065X.2006.00441.x. - DOI - PMC - PubMed
    1. Ziv Y, Ron N, Butovsky O, Landa G, Sudai E, Greenberg N, Cohen H, Kipnis J, Schwartz M. Immune cells contribute to the maintenance of neurogenesis and spatial learning abilities in adulthood. Nat Neurosci. 2006;9:268–275. doi: 10.1038/nn1629. - DOI - PubMed

LinkOut - more resources