

Intake of silica nanoparticles by giant lipid vesicles: influence of particle size and thermodynamic membrane state
- PMID: 25671142
- PMCID: PMC4311713
- DOI: 10.3762/bjnano.5.256
Intake of silica nanoparticles by giant lipid vesicles: influence of particle size and thermodynamic membrane state
Abstract
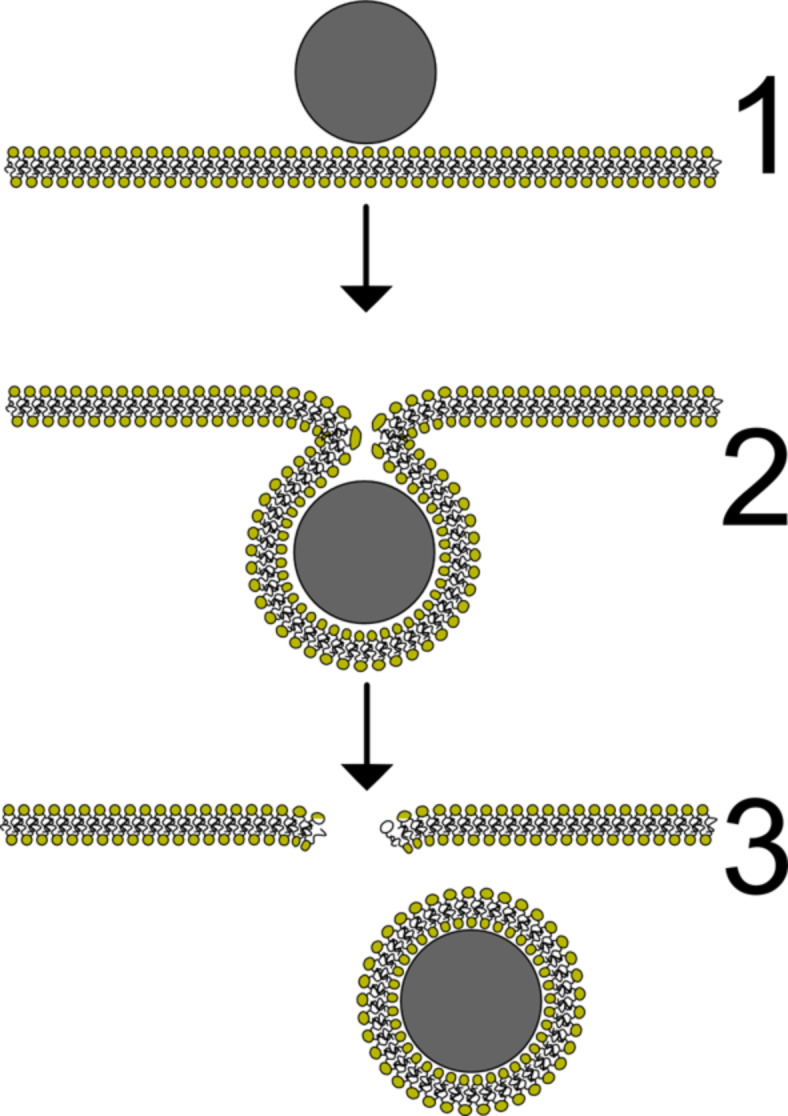
The uptake of nanoparticles into cells often involves their engulfment by the plasma membrane and a fission of the latter. Understanding the physical mechanisms underlying these uptake processes may be achieved by the investigation of simple model systems that can be compared to theoretical models. Here, we present experiments on a massive uptake of silica nanoparticles by giant unilamellar lipid vesicles (GUVs). We find that this uptake process depends on the size of the particles as well as on the thermodynamic state of the lipid membrane. Our findings are discussed in the light of several theoretical models and indicate that these models have to be extended in order to capture the interaction between nanomaterials and biological membranes correctly.
Keywords: cells; endocytosis; engulfment; fission; gel phase; giant unilamellar lipid vesicles (GUV); lipid membranes; liquid phase; nanoparticle; phosphocholines; uptake; vesicles; wrapping.
Figures
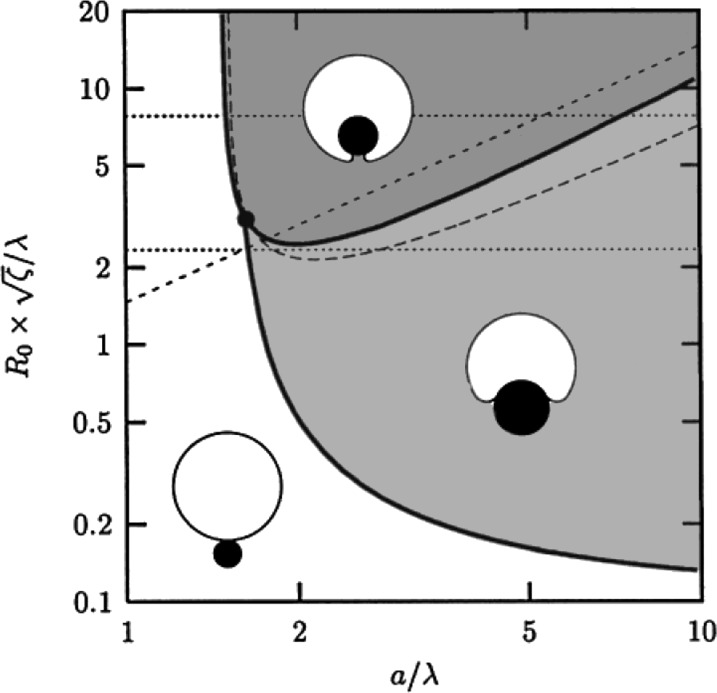
 ; ζ = gad/gten. In short, very small particles will not be wrapped at all due to the bending resistance (white). The wrapping of big particles is rather limited by membrane tension (light grey). Only for low vesicle tension and sufficiently big particles full wrapping is possible (dark grey). Reprinted with permission from [21]. Copyright 2002 American Chemical Society.


Similar articles
-
Wrapping anisotropic microgel particles in lipid membranes: Effects of particle shape and membrane rigidity.Proc Natl Acad Sci U S A. 2023 Jul 25;120(30):e2217534120. doi: 10.1073/pnas.2217534120. Epub 2023 Jul 17. Proc Natl Acad Sci U S A. 2023. PMID: 37459547 Free PMC article.
-
Shape changes and vesicle fission of giant unilamellar vesicles of liquid-ordered phase membrane induced by lysophosphatidylcholine.Langmuir. 2004 Oct 26;20(22):9526-34. doi: 10.1021/la049481g. Langmuir. 2004. PMID: 15491182
-
Wrapping Pathways of Anisotropic Dumbbell Particles by Giant Unilamellar Vesicles.Nano Lett. 2023 May 24;23(10):4267-4273. doi: 10.1021/acs.nanolett.3c00375. Epub 2023 May 4. Nano Lett. 2023. PMID: 37141427 Free PMC article.
-
Giant unilamellar vesicles - a perfect tool to visualize phase separation and lipid rafts in model systems.Acta Biochim Pol. 2009;56(1):33-9. Epub 2009 Mar 17. Acta Biochim Pol. 2009. PMID: 19287805 Review.
-
Elementary Processes and Mechanisms of Interactions of Antimicrobial Peptides with Membranes-Single Giant Unilamellar Vesicle Studies.Adv Exp Med Biol. 2019;1117:17-32. doi: 10.1007/978-981-13-3588-4_3. Adv Exp Med Biol. 2019. PMID: 30980351 Review.
Cited by
-
Characterizing the Structure and Interactions of Model Lipid Membranes Using Electrophysiology.Membranes (Basel). 2021 Apr 27;11(5):319. doi: 10.3390/membranes11050319. Membranes (Basel). 2021. PMID: 33925756 Free PMC article. Review.
-
Fission of Lipid-Vesicles by Membrane Phase Transitions in Thermal Convection.Sci Rep. 2019 Dec 11;9(1):18808. doi: 10.1038/s41598-019-55110-0. Sci Rep. 2019. PMID: 31827164 Free PMC article.
-
Wrapping anisotropic microgel particles in lipid membranes: Effects of particle shape and membrane rigidity.Proc Natl Acad Sci U S A. 2023 Jul 25;120(30):e2217534120. doi: 10.1073/pnas.2217534120. Epub 2023 Jul 17. Proc Natl Acad Sci U S A. 2023. PMID: 37459547 Free PMC article.
-
Exploring the dynamics of a single vesicle induced by Fe₃O₄ nanoparticles using micropipette manipulation.PLoS One. 2025 Jul 7;20(7):e0327639. doi: 10.1371/journal.pone.0327639. eCollection 2025. PLoS One. 2025. PMID: 40622984 Free PMC article.
-
Microfluidic Transfection System and Temperature Strongly Influence the Efficiency of Transient Transfection.ACS Omega. 2024 May 3;9(19):21637-21646. doi: 10.1021/acsomega.4c02590. eCollection 2024 May 14. ACS Omega. 2024. PMID: 38764649 Free PMC article.
References
-
- Casals E, Gonzalez E, Puntes V F. J Phys D: Appl Phys. 2012;45:443001. doi: 10.1088/0022-3727/45/44/443001. - DOI
LinkOut - more resources
Full Text Sources
Other Literature Sources