. 2015 Mar 10;6(7):5102-17.
doi: 10.18632/oncotarget.3244.

Haploinsufficiency of the c-myc transcriptional repressor FIR, as a dominant negative-alternative splicing model, promoted p53-dependent T-cell acute lymphoblastic leukemia progression by activating Notch1

Affiliations

Haploinsufficiency of the c-myc transcriptional repressor FIR, as a dominant negative-alternative splicing model, promoted p53-dependent T-cell acute lymphoblastic leukemia progression by activating Notch1

Kazuyuki Matsushita et al. Oncotarget. .

Abstract

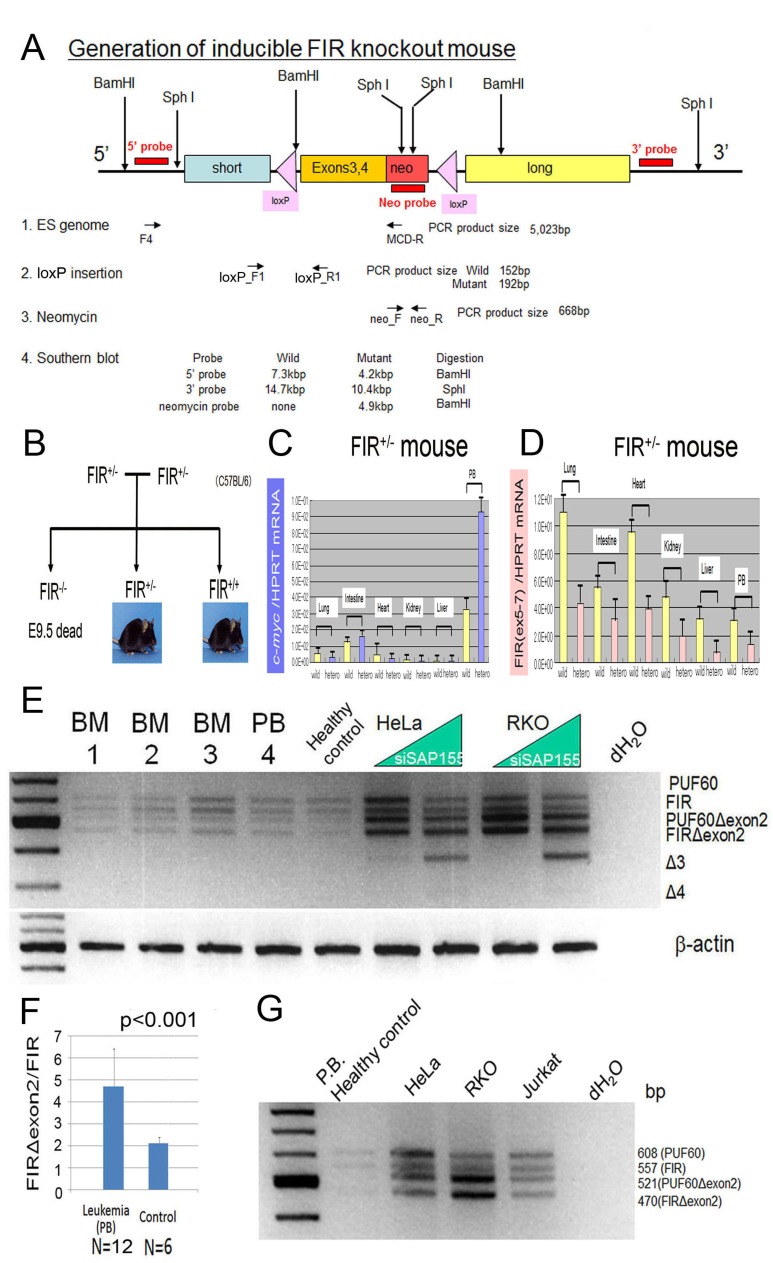
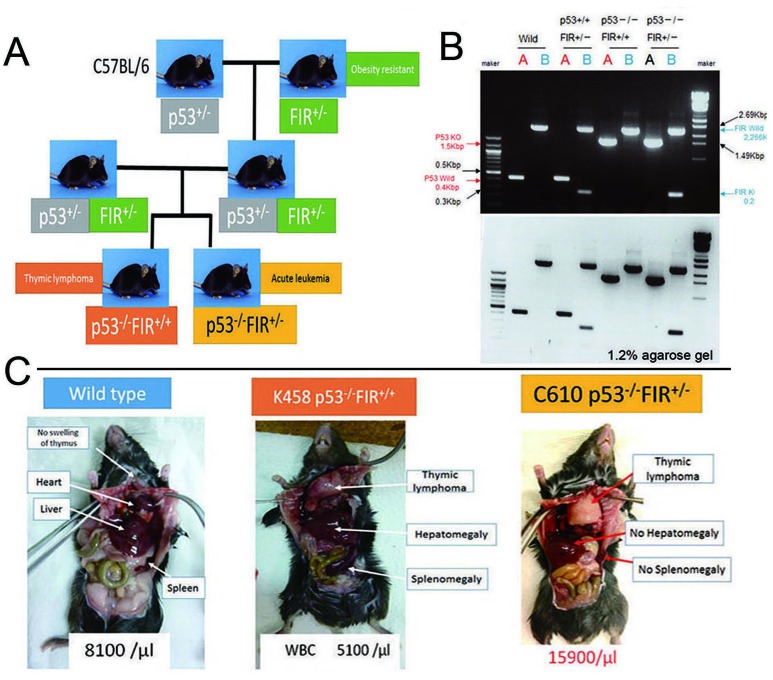
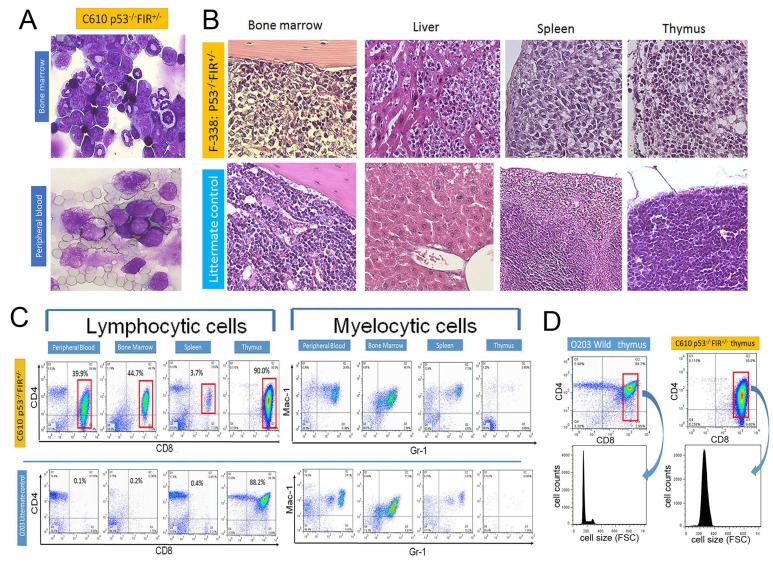
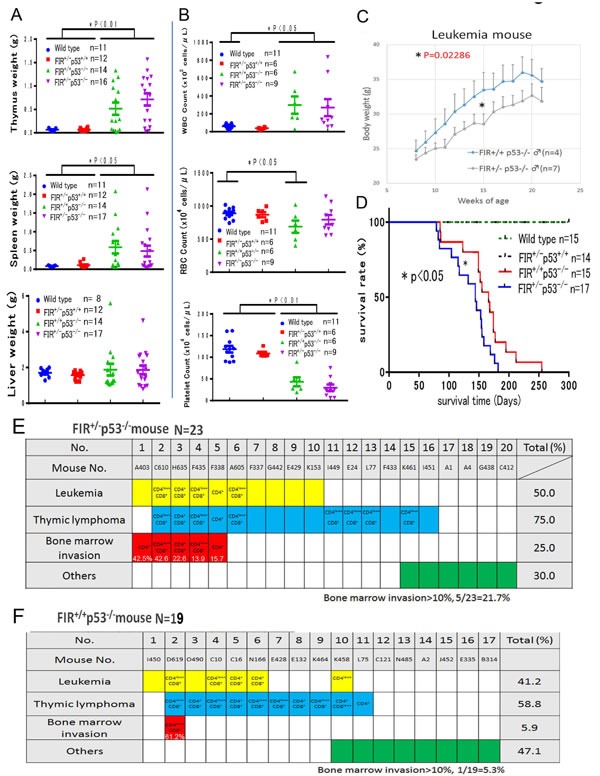
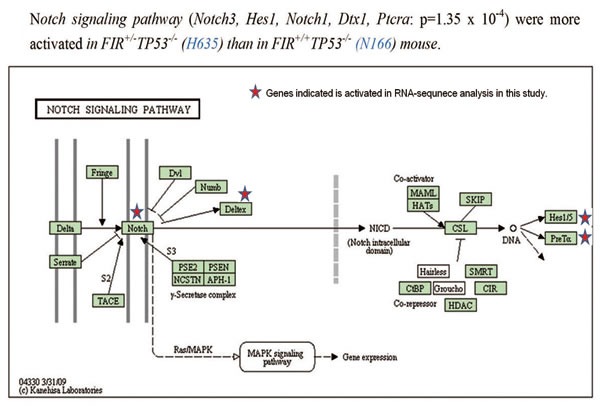
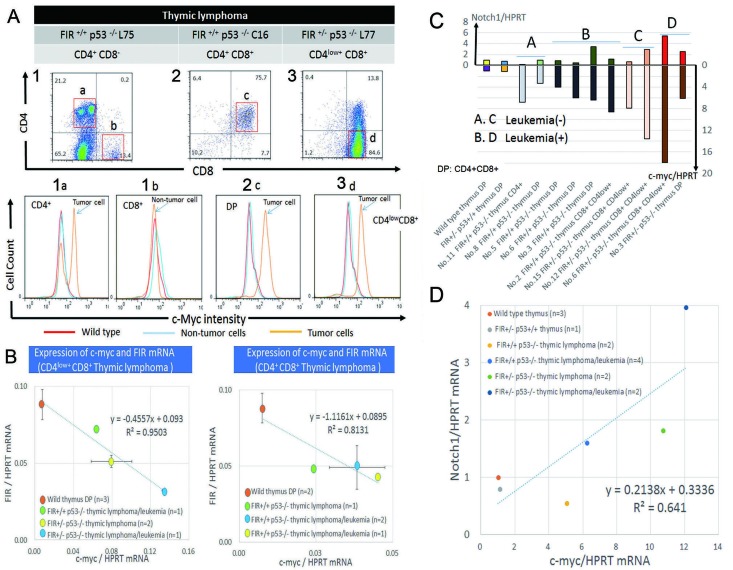
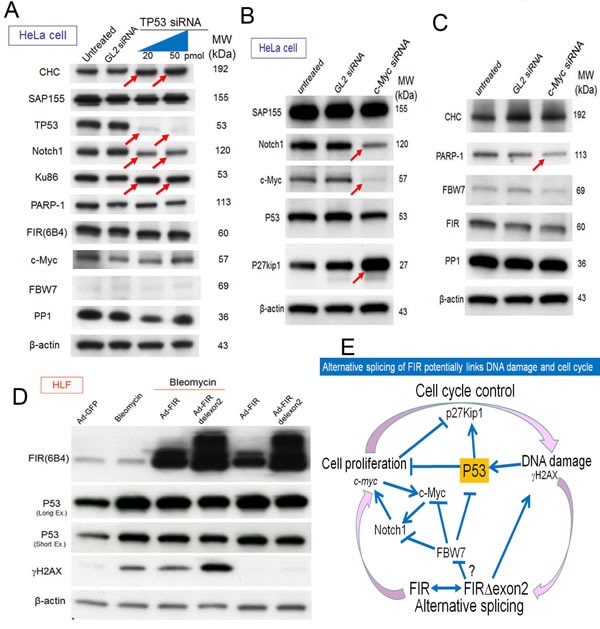
FUSE-binding protein (FBP)-interacting repressor (FIR) is a c-myc transcriptional suppressor. A splice variant of FIR that lacks exon 2 in the transcriptional repressor domain (FIRΔexon2) upregulates c-myc transcription by inactivating wild-type FIR. The ratio of FIRΔexon2/FIR mRNA was increased in human colorectal cancer and hepatocellular carcinoma tissues. Because FIRΔexon2 is considered to be a dominant negative regulator of FIR, FIR heterozygous knockout (FIR⁺/⁻) C57BL6 mice were generated. FIR complete knockout (FIR⁻/⁻) was embryonic lethal before E9.5; therefore, it is essential for embryogenesis. This strongly suggests that insufficiency of FIR is crucial for carcinogenesis. FIR⁺/⁻ mice exhibited prominent c-myc mRNA upregulation, particularly in the peripheral blood (PB), without any significant pathogenic phenotype. Furthermore, elevated FIRΔexon2/FIR mRNA expression was detected in human leukemia samples and cell lines. Because the single knockout of TP53 generates thymic lymphoma, FIR⁺/⁻TP53⁻/⁻ generated T-cell type acute lymphocytic/lymphoblastic leukemia (T-ALL) with increased organ or bone marrow invasion with poor prognosis. RNA-sequencing analysis of sorted thymic lymphoma cells revealed that the Notch signaling pathway was activated significantly in FIR⁺/⁻TP53⁻/⁻ compared with that in FIR⁺/⁺TP53⁻/⁻ mice. Notch1 mRNA expression in sorted thymic lymphoma cells was confirmed using qRT-PCR. In addition, flow cytometry revealed that c-myc mRNA was negatively correlated with FIR but positively correlated with Notch1 in sorted T-ALL/thymic lymphoma cells. Moreover, the knockdown of TP53 or c-myc using siRNA decreased Notch1 expression in cancer cells. In addition, an adenovirus vector encoding FIRΔexon2 cDNA increased bleomycin-induced DNA damage. Taken together, these data suggest that the altered expression of FIRΔexon2 increased Notch1 at least partially by activating c-Myc via a TP53-independent pathway. In conclusion, the alternative splicing of FIR, which generates FIRΔexon2, may contribute to both colorectal carcinogenesis and leukemogenesis.

Keywords: FBP interacting repressor (FIR); P53; T-ALL; haplo-insufficiency; leukemia; splicing variant.


Conflict of interest statement

Conflict of interest

We have no potential conflicts of interest to disclose.

Figures

Figure 1
Figure 1. c-Myc mRNA was activated in the peripheral blood cells of inducible FIR heterozygous knockout mouse and FIR/IRΔexon2 mRNA expression in human clinical leukemia/malignant lymphoma samples
(A) Genetic construction for inducible FIR+/− mouse. Primers locations for detecting ES genome, LoxP insertion, neomycin cassette and probes for Southern blot analysis were indicated. Expected DNA sizes for Southern blot analysis are also shown. (B) Family tree to obtain FIR homo knockout mouse FIR−/−, by cross-fertilization between FIR hetero knockout mouse: FIR+/−. FIR−/− mouse was revealed to be embryonic lethal at least before E9.5 by cross-fertilized between FIR hetero knockout mouse. The relative expression of c-myc and FIR mRNAs from lung, intestinal mucosae, heart muscle, kidneys, livers and peripheral blood (PB) were examined. (C) c-myc mRNA of PB of FIR hetero knockout mice was three-times higher than those of wild mouse. (D) FIR mRNA expression level of FIR hetero knockout mice was exactly half of those of wild mouse. (E) qRT-PCR of PUF60, FIR PUF60Δexon2, FIRΔexon2 mRNA were indicated by RT-PCR. Samples: leukemia cells from peripheral blood (PB) and bone marrow (BM) of adult patients (listed in table 2). (F) The ratio of FIR/FIRΔexon2 mRNA level of leukemia cells was significantly higher than those of non-leukemia or control samples (Student's t-test). (G) mRNA extracted from HeLa (human cervical squamous carcinoma cells), RKO (human colon adenocarcinoma cells), and Jurkat (human immortalized T lymphocyte) cells was examined for their FIR splicing variants expression.
Figure 2
Figure 2. Preparation of FIR+/−P53−/− and FIR+/+P53−/− mouse
(A) FIR+/− and P53−/− were obtained by cross-fertilization between FIR+/−P53−/− and FIR+/+P53−/− mice. FIR+/−P53+/− double compound hetero knockout mouse was prepared and mated each other, or female P53+/− was mated with male FIR+/−P53+/− mouse to obtain FIR+/−P53−/− because FIR+/−P53+/− showed low fertility. (B) Genotyping of FIR+/+P53−/−, FIR+/−P53+/+ and FIR+/−P53−/− and wild mice were confirmed by PCR. (C) Thymic lymphoma was observed in FIR+/+p53−/− mice.
Figure 3
Figure 3. Histologic features and flow cytometry analysis of FIR+/−P53−/−
(A) Atypical cells were indicated by Giemsa stain in bone marrow and peripheral blood of FIR+/−P53−/− mouse (C610). (B) Histologic features of bone marrow, liver, spleen and thymus in FIR+/−P53−/− (F338) and wild mouse by Hematoxylin-Eosin stain. (C) Flow cytometry analysis of lymphocytic cells with CD4 and CD8 as indicated markers. Mac1 and Gr1 were used for myelocytic markers. Flow cytometry analysis revealed that lymphocytic atypical cells (left) were CD4low+CD8+ phenotype (gated area) but no significant findings in myeloid cells (right) in FIR+/−P53−/− mouse (C610), and diagnosed as T-cell type acute lymphocytic/lymphoblastic leukemia (T-ALL)/lymphoma. (D) Cell size of gated area was measured by flow cytometry analysis (FSC: Forward Scatter).
Figure 4
Figure 4. Summary of organs' weight and blood tests, body weight and overall survival of curves of FIR−/−P53+/+, FIR+/−P53+/+, FIR+/+P53−/−, and FIR+/−P53−/− mice
(A) The weight of thymus of FIR+/−P53−/− and FIR+/+P53−/− was significantly heavier than that of wild or FIR+/−P53+/+ mouse (P<0.05). The weight of spleen of FIR+/+P53−/− -were significantly heavier than that of wild or FIR+/−P53+/+ mouse (P<0.05). The weight of liver of wild mouse, FIR+/−P53+/+, FIR+/+P53−/−, and FIR+/−P53−/− was no significant difference. (B) WBC count of FIR+/−P53−/− and FIR+/+P53−/− was significantly increased than that of wild mouse. RBC count of FIR+/+P53−/− was significantly less than that of wild mouse (P<0.05). Platelet count of FIR+/−P53−/− and FIR+/+P53−/− was significantly less than that of wild or FIR+/−P53+/+ mouse (P<0.05). (C) Body weight of FIR+/−P53−/− mice was significantly lighter than that of FIR+/+P53−/−. Statistical signifincace was calculated by Student's t-test. (D) The overall survival curves of four genetically different group: wild, FIR+/−p53+/+, FIR+/−p53−/−, and FIR+/+p53−/− mice. FIR+/−p53+/+ and FIR+/+p53+/+ were survived 100% up to 25 weeks after birth without obvious tumor formation, body weight loss or other physical disabilities. On the contrary, the overall survival curves (Kaplan-Meier method) of FIR+/−p53−/− and FIR+/+p53−/− mice were declined around 70 days after birth. Overall survival curves of four genetically different group: wild, FIR+/−p53+/+, FIR+/−p53−/−, and FIR+/+p53−/− mice were compared by log-rank test. (E) T-ALL with more than 10 % bone marrow infiltration of blast cells in FIR+/−P53−/− mice was 5 out of 23 (21.7%) including three pre-analytical alive mouse in FIR+/+P53−/− (1 out of 19=5.3%) including two pre-analytical alive mouse. (F) In FIR+/−P53−/− mice (N=23), T-ALL: 10 (50.0%), thymic lymphoma: 15 (75%), bone marrow invasion: 5 (25.0%). Whereas in FIR+/+P53−/− mice (N=17) T-ALL: 7 (41.2%), thymic lymphoma: 10 (58.8%), bone marrow invasion: 1 (5.9%). Blank in colored column indicated undetermined or not tested for cell surface marker.
Figure 5
Figure 5. Signaling pathway activated in sorted thymic lymphoma cells in FIR+/−TP53−/− mice
(A) KEGG pathway analysis showed that Notch Signaling pathway was more activated in FIR+/−TP53−/− mice compared with FIR+/−TP53−/− and FIR+/+TP53−/− mice, with the Notch3, Hes1, Notch1, Dtx1 and Ptcra genes upregulated (P=1.4×10⁻⁴). Other activated pathways were also shown in Figure S6.
Figure 6
Figure 6. c-Myc protein is enhanced and showed inverse correlation with FIR in thymic lymphoma cells and promotes bone marrow invasion
(A) Flow cytometry of thymic lymphoma cells in FIR+/+P53−/− or FIR+/−P53−/− mice are indicated. CD4+ cells of FIR+/+P53−/− (upper column 1) has two populations indicated c-Myc-high (1a) and c-Myc–low intensity (1b). Notably, c-Myc-high (1a) population, presumably lymphoma cells, has c-Myc-low peak, indicating non-tumor cells cluster. CD4+CD8+ cells (2c) also indicated c-Myc-high intensity population. CD4low+CD8+ (3d) showed c-Myc-high intensity population indicated by FACS (bottom). Red line: Thymus cells of wild type FIR+/+P53+/+ mouse. Thin blue line: non-tumor cells of FIR+/+P53−/− or FIR+/−P53−/− mice. Orange line: Tumor cells of FIR+/+P53−/− or FIR+/−P53−/− mice. (B) Inverse correlation with significance between c-myc and FIR mRNA expression in CD4low+CD8+ or CD4+CD8+thymus lymphocytes obtained from FIR+/+P53−/− or FIR+/−P53−/− mice. Relative c-myc (or FIR)/HPRT mRNA expression of CD4low+CD8+ thymic lymphoma/leukemia cells of FIR+/+p53−/− (light green) was 8.6 (0.81), thymic lymphoma cells of FIR+/−p53−/− (yellow) was 10.7 (0.58), and thymic lymphoma/leukemia cells of FIR+/−p53−/− (blue) was 18.0 (0.37) times as compare to thymic cells of wild mouse (dark orange), respectively (right). The relationship between c-myc/HPRT mRNA (x-axis) and FIR/HPRT mRNA (y-axis) was y=-0.4557x+0.093 (R2=0.9503). Relative c-myc (or FIR)/HPRT mRNA expression of CD4+CD8+ thymic lymphoma cells of FIR+/+p53−/− (light green) was 3.3 (0.56), thymic lymphoma/leukemia cells of FIR+/+p53−/− (yellow) was 6.1 (0.48), and thymic lymphoma/leukemia cells of FIR+/+p53−/− (blue) was 5.2 (0.56) times as compare to thymic cells of wild mouse (dark orange), respectively. The relationship between c-myc/HPRT mRNA (x-axis) and FIR/HPRT mRNA (y-axis) was y=-1.1161x+0.086 (R2=0.8131). (C) (D) c-myc mRNA and Notch1 mRNA expression was positively correlated each other in sorted thymic lymphoma cells extracted from mice of different genetic backgrounds.
Figure 7
Figure 7. Alternative splicing of FIR connects DNA damage response, c-myc activation and cell cycle control
(A) 20 and 50pmol of TP53 siRNA were transfected into HeLa cells. GL2 siRNA was transfected as the negative control. After 72h of incubation, whole-cell extracts were analyzed by western blotting for relevant protein expressions. (B, C) 20pmol c-Myc siRNA was transfected into HeLa cells. GL2 siRNA is for negative control. After 48h of incubation, whole-cell extracts were analyzed by western blotting for relevant protein expressions. (D) 3.76 × 10⁸ VP/ml (10 MOI) of Ad-FIR or Ad-FIRΔexon2 adenovirus vectors and DNA damaging agent bleomycin (30 μg/ml) were either co-treated or single treated into HLF cell. 3.76 × 10⁸ VP/ml (10 MOI) of GFP adenovirus (Ad-GFP) was treated as negative control. After 48h of incubation, whole-cell extracts were analyzed by western blotting. Severity of the DNA damage caused by bleomycin treatment is indicated by γH2AX expression. (E) Schematic view of haploinsufficiency, as a dominant negative-alternative splicing model of FIR in T-ALL pathogenesis. DNA damage affects alternative splicing of FIR that contributes to c-myc transcriptional activations. Activated c-Myc accelerates cell cycle by suppressing P27Kip1 and in turn accumulates DNA damage. The altered expression of FIRΔexon2 increased Notch1 at least partially by activating c-Myc via a TP53-independent pathway.

References

    1. Duncan R, Bazar L, Michelotti G, Tomonaga T, Krutzsch H, Avigan M, Levens D. A sequence-specific, single-strand binding protein activates the far upstream element of c-myc and defines a new DNA-binding motif. Genes Dev. 1994;8:465–80. - PubMed
    1. Bazar L, Meighen D, Harris V, Duncan R, Levens D, Avigan M. Targeted melting and binding of a DNA regulatory element by a transactivator of c-myc. J Biol Chem. 1995;270:8241–8. - PubMed
    1. Avigan MI, Strober B, Levens D. A far upstream element stimulates c-myc expression in undifferentiated leukemia cells. J Biol Chem. 1990;265:18538–45. - PubMed
    1. Liu J, He L, Collins I, Ge H, Libutti D, Li J, Egly JM, Levens D. The FBP interacting repressor targets TFIIH to inhibit activated transcription. Mol Cell. 2000;5:331–41. - PubMed
    1. Liu J, Akoulitchev S, Weber A, Ge H, Chuikov S, Libutti D, Wang XW, Conaway JW, Harris CC, Conaway RC, Reinberg D, Levens D. Defective interplay of activators and repressors with TFIH in xeroderma pigmentosum. Cell. 2001;104:353–63. - PubMed

Publication types

MeSH terms

Associated data

LinkOut - more resources