. 2015 Feb 11;10(2):e0117533.
doi: 10.1371/journal.pone.0117533. eCollection 2015.

Effects of ocean acidification on temperate coastal marine ecosystems and fisheries in the northeast Pacific

Affiliations

Effects of ocean acidification on temperate coastal marine ecosystems and fisheries in the northeast Pacific

Rowan Haigh et al. PLoS One. .

Abstract

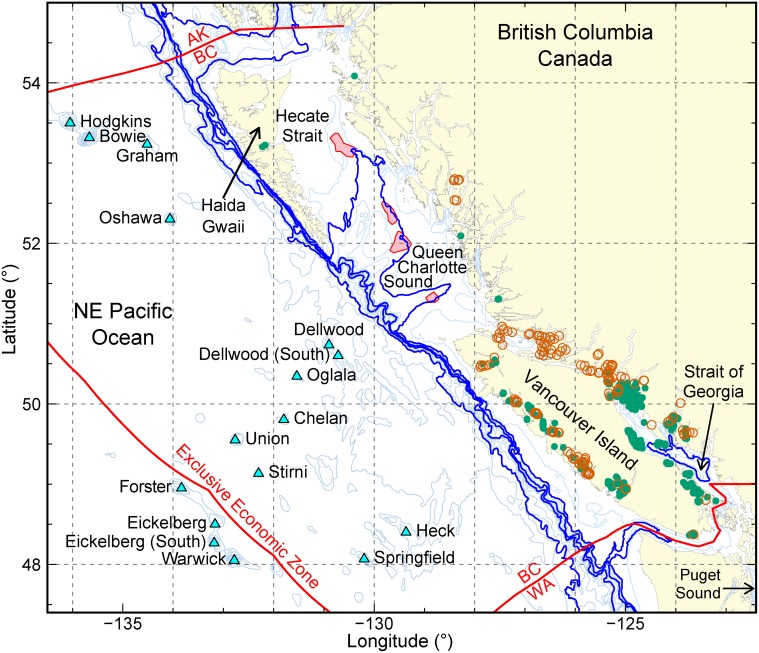
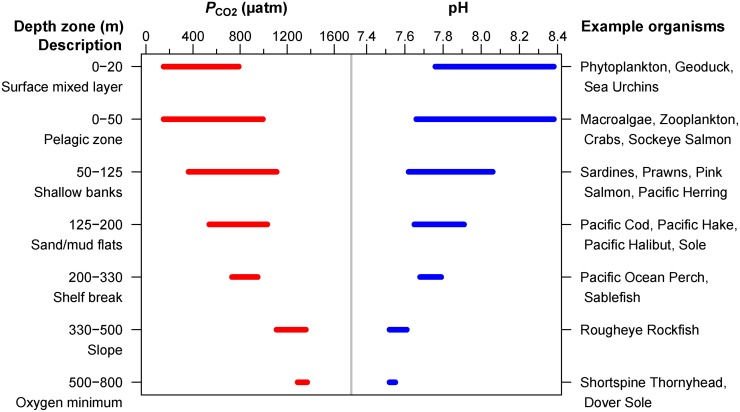
As the oceans absorb anthropogenic CO2 they become more acidic, a problem termed ocean acidification (OA). Since this increase in CO2 is occurring rapidly, OA may have profound implications for marine ecosystems. In the temperate northeast Pacific, fisheries play key economic and cultural roles and provide significant employment, especially in rural areas. In British Columbia (BC), sport (recreational) fishing generates more income than commercial fishing (including the expanding aquaculture industry). Salmon (fished recreationally and farmed) and Pacific Halibut are responsible for the majority of fishery-related income. This region naturally has relatively acidic (low pH) waters due to ocean circulation, and so may be particularly vulnerable to OA. We have analyzed available data to provide a current description of the marine ecosystem, focusing on vertical distributions of commercially harvested groups in BC in the context of local carbon and pH conditions. We then evaluated the potential impact of OA on this temperate marine system using currently available studies. Our results highlight significant knowledge gaps. Above trophic levels 2-3 (where most local fishery-income is generated), little is known about the direct impact of OA, and more importantly about the combined impact of multi-stressors, like temperature, that are also changing as our climate changes. There is evidence that OA may have indirect negative impacts on finfish through changes at lower trophic levels and in habitats. In particular, OA may lead to increased fish-killing algal blooms that can affect the lucrative salmon aquaculture industry. On the other hand, some species of locally farmed shellfish have been well-studied and exhibit significant negative direct impacts associated with OA, especially at the larval stage. We summarize the direct and indirect impacts of OA on all groups of marine organisms in this region and provide conclusions, ordered by immediacy and certainty.


Conflict of interest statement

Competing Interests: The authors have declared that no competing interests exist.

Figures

Fig 1
Fig 1. British Columbia (BC) coastline and bathymetry (isobaths in metres: thin grey—100, 200, 300, …, 1000, 1250, 1500, 2000, 2500; thick blue—200, 500, 800, and 1600).
The continental slope along most of BC comprises steep slopes, especially along the west coasts of Haida Gwaii and northern Vancouver Island. Hecate Strait is largely dominated by shallow waters and a flat seafloor. Sponge reef core protected areas in Hecate Strait and Queen Charlotte Sound are shaded pink. The Strait of Georgia forms a large inland sea that is heavily influenced by river runoff and tidal currents. Saltwater finfish farm and hatchery sites are indicated by open red circles, commercial marine shellfish farms are indicated by solid green circles [345]. Select seamounts [346] are marked by blue triangles. Canada’s Exclusive Economic Zone (200-nautical miles offshore) is delimited in red. Map was prepared using PBSmapping in R [347]. The R code is provided as Supporting Information (S1 Code).
Fig 2
Fig 2. Estimated present-day ranges of P CO2 (red) and pH (blue) during spring [40] and summer [27] for various depth zones along the outer BC continental shelf, with typical species found in each zone (see Methods).
There are numerous data above 50m and few below 125 m. The number of values in each depth zone from top to bottom are: 70, 116, 33, 45, 5, 4 and 2, respectively. Above 50 m, the distributions of values are skewed, such that high P CO2 (low pH) extremes occur less often than the low P CO2 (high pH) extremes. Data and R code for this figure are provided as Supporting Information (S2 Code).
Fig 3
Fig 3. Depth-of-capture, expressed as quantile box plots of depth (m), from fisheries and survey data (where available) for species groups identified in Fig. 4.
For each quantile box, the upper whisker, box top, box delimiter (horizontal line), box bottom and lower whisker correspond to the 0.025, 0.25, 0.5, 0.75, and 0.975 quantiles, respectively. Depth quantiles that lie deeper than the figure limit are indicated along the bottom. Horizontal dashed lines correspond to depth zones in Fig. 2. See Methods for data sources. Data and R code for this figure are provided in Supporting Information (S1 Data and S3 Code, respectively).
Fig 4
Fig 4. Summary of ocean acidification effects on (A) wild, and (B) farmed species groups in BC waters, including landed value for those that are fished or farmed.
Species groups are arranged vertically by trophic level, adapted from output by Preikshot [38] (courtesy of D. Preikshot, Madrone Environmental Services, Duncan BC). Areas of circles are proportional to the landed values in 2011, based on data in [34] (and [39] for euphausiids). Squares represent species groups that are not commercially harvested. Solid colours represent the likely direct effects of ocean acidification (see Results for explanations). Stippling refers to possible effects. For species marked by an asterisk (*), colours represent indirect effects. Data and R code for this figure are provided as Supporting Information (S4 Code).

References

    1. Intergovernmental Panel on Climate Change (2013) Climate Change 2013: The Physical Science Basis. Contribution of Working Group I to the Fifth Assessment Report of the Intergovernmental Panel on Climate Change. Cambridge, UK and New York, USA: Cambridge University Press, 1535 pp.
    1. Canadell JG, Le Quere C, Raupach MR, Field CB, Buitenhuis ET, et al. (2007) Contributions to accelerating atmospheric CO2 growth from economic activity, carbon intensity, and efficiency of natural sinks. Proc Natl Acad Sci USA 104: 18866–18870. 10.1073/pnas.0702737104 - DOI - PMC - PubMed
    1. Doney SC, Feely VJFRA, Kleypas JA (2009) Ocean acidification: the other CO2 problem. Ann Rev Mar Sci 1: 169–192. 10.1146/annurev.marine.010908.163834 - DOI - PubMed
    1. Intergovernmental Panel on Climate Change (2011) Workshop Report of the Intergovernmental Panel on Climate Change Workshop on Impacts of Ocean Acidification on Marine Biology and Ecosystems. Stanford, USA: Working Group II Technical Support Unit, Carnegie Institution, 164 pp.
    1. Raven J, Caldeira K, Elderfield H, Hoegh-Guldberg O, Liss P, et al. (2005) Ocean acidification due to increasing carbon dioxide. The Royal Society 12/05: viii + 60p.

Publication types

LinkOut - more resources