

Crossing latitudes--long-distance tracking of an apex predator
- PMID: 25671609
- PMCID: PMC4324986
- DOI: 10.1371/journal.pone.0116916
Crossing latitudes--long-distance tracking of an apex predator
Abstract
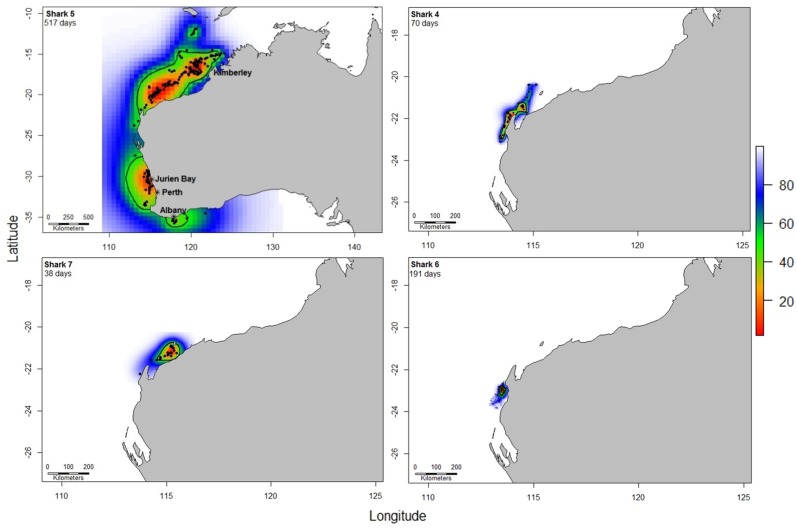
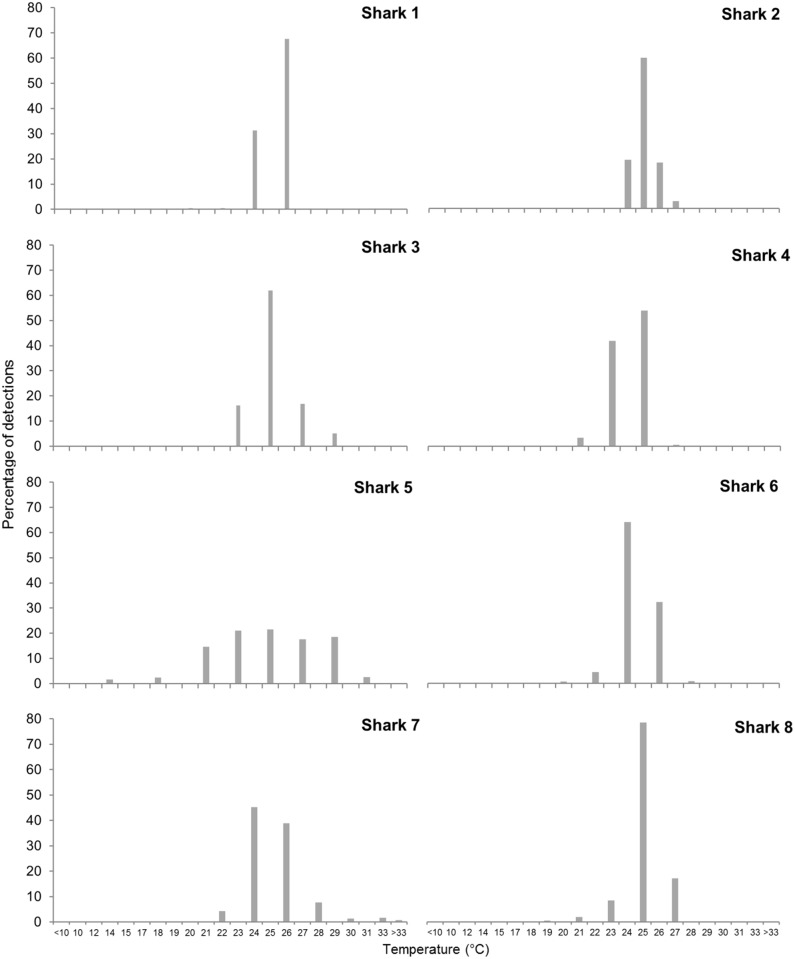
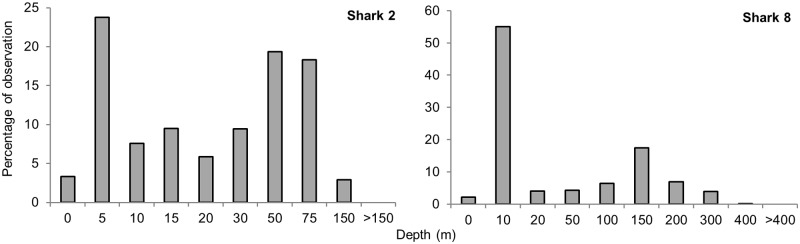
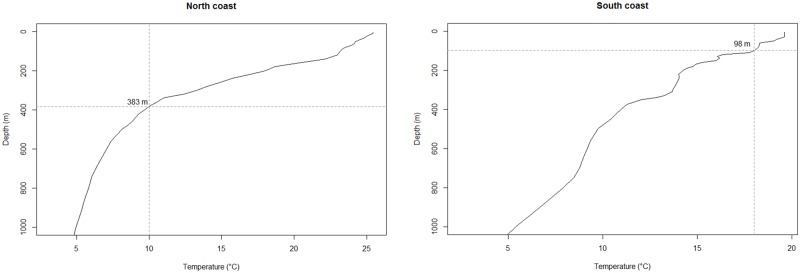
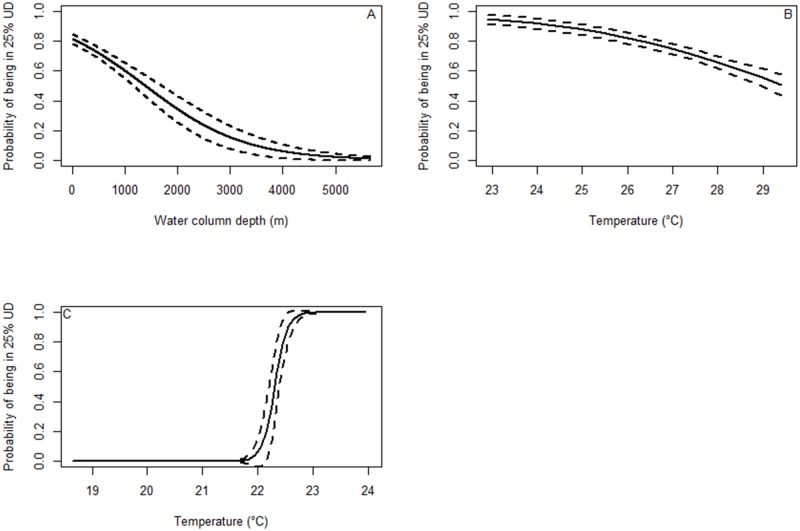
Tiger sharks (Galeocerdo cuvier) are apex predators occurring in most tropical and warm temperate marine ecosystems, but we know relatively little of their patterns of residency and movement over large spatial and temporal scales. We deployed satellite tags on eleven tiger sharks off the north-western coast of Western Australia and used the Brownian Bridge kernel method to calculate home ranges and analyse movement behaviour. One individual recorded one of the largest geographical ranges of movement ever reported for the species, travelling over 4000 km during 517 days of monitoring. Tags on the remainder of the sharks reported for shorter periods (7-191 days). Most of these sharks had restricted movements and long-term (30-188 days) residency in coastal waters in the vicinity of the area where they were tagged. Core home range areas of sharks varied greatly from 1166.9 to 634,944 km2. Tiger sharks spent most of their time in water temperatures between 23°-26°C but experienced temperatures ranging from 6°C to 33°C. One shark displayed seasonal movements among three distinct home range cores spread along most of the coast of Western Australia and generalized linear models showed that this individual had different patterns of temperature and depth occupancy in each region of the coast, with the highest probability of residency occurring in the shallowest areas of the coast with water temperatures above 23°C. These results suggest that tiger sharks can migrate over very large distances and across latitudes ranging from tropical to the cool temperate waters. Such extensive long-term movements may be a key element influencing the connectivity of populations within and among ocean basins.
Conflict of interest statement
Figures


References
-
- Sydeman WJ, Brodeur RD, Grimes CB, Bychkov AS, McKinnell S (2006) Marine habitat “hotspots” and their use by migratory species and top predators in the North Pacific Ocean: Introduction. Deep Sea Res Part II Top Stud Oceanogr 53: 247–249.
-
- Beschta RL, Ripple WJ (2009) Large predators and trophic cascades in terrestrial ecosystems of the western United States. Biol Conserv 142: 2401–2414.
-
- Jackson JB, Kirby MX, Berger WH, Bjorndal KA, Botsford LW, et al. (2001) Historical overfishing and the recent collapse of coastal ecosystems. Science 293: 629–637. - PubMed
Publication types
MeSH terms
Substances
LinkOut - more resources
Full Text Sources
Other Literature Sources
Miscellaneous
