

The metabolic responses to hepatitis B virus infection shed new light on pathogenesis and targets for treatment
- PMID: 25672227
- PMCID: PMC4325332
- DOI: 10.1038/srep08421
The metabolic responses to hepatitis B virus infection shed new light on pathogenesis and targets for treatment
Abstract
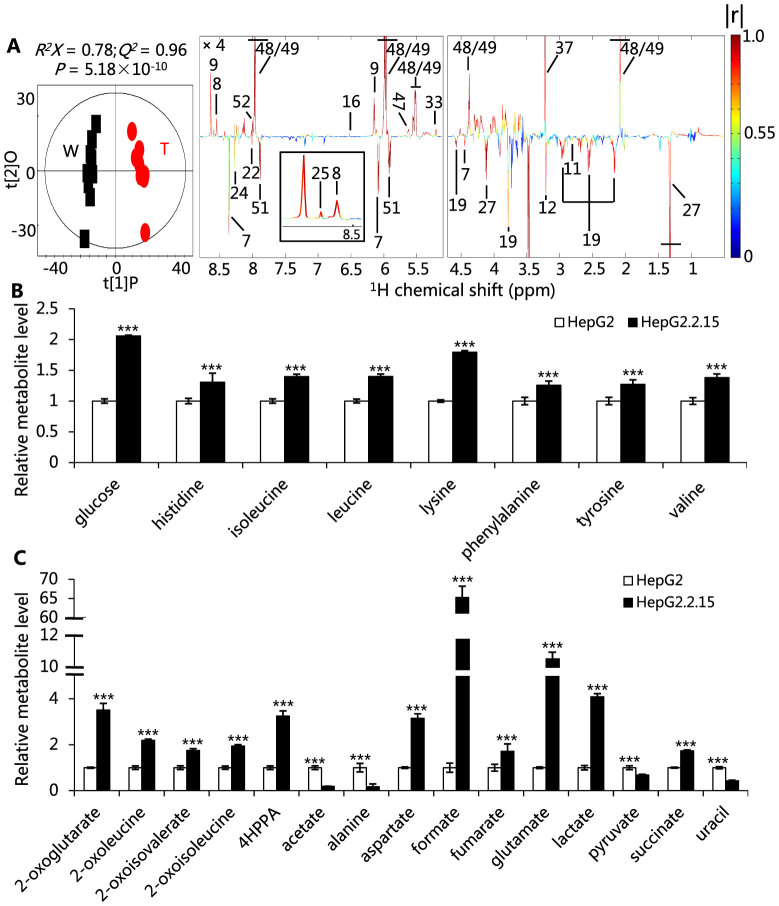
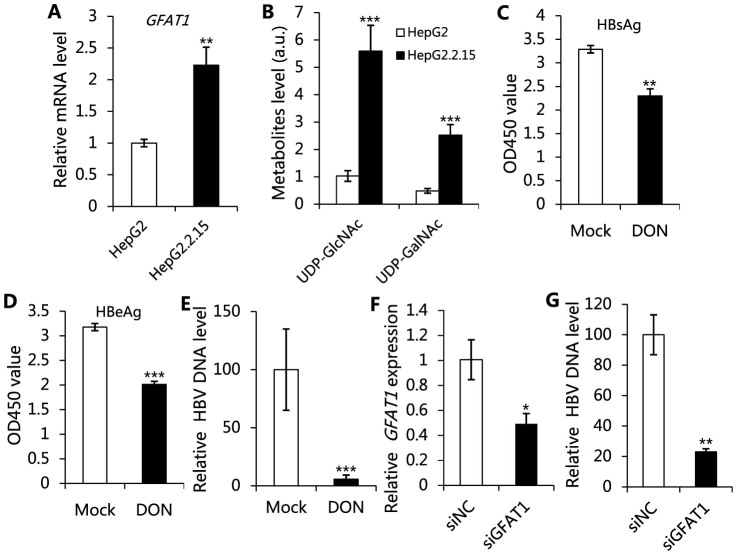
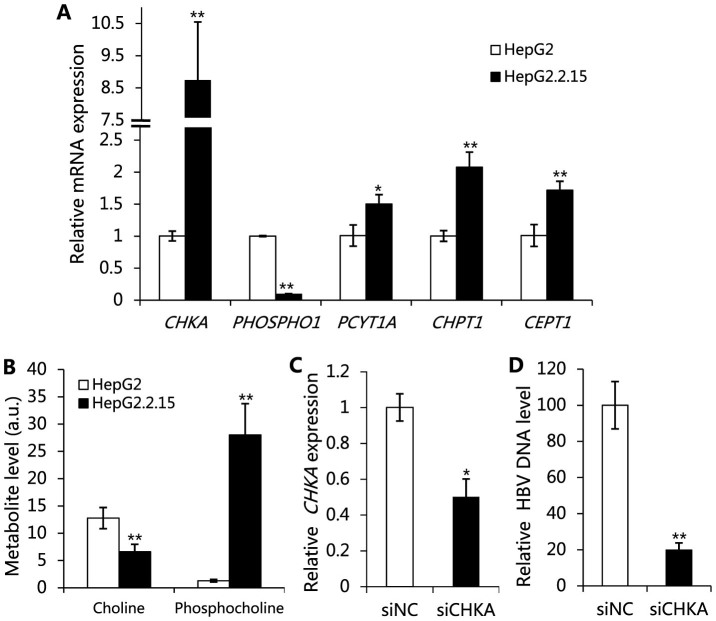
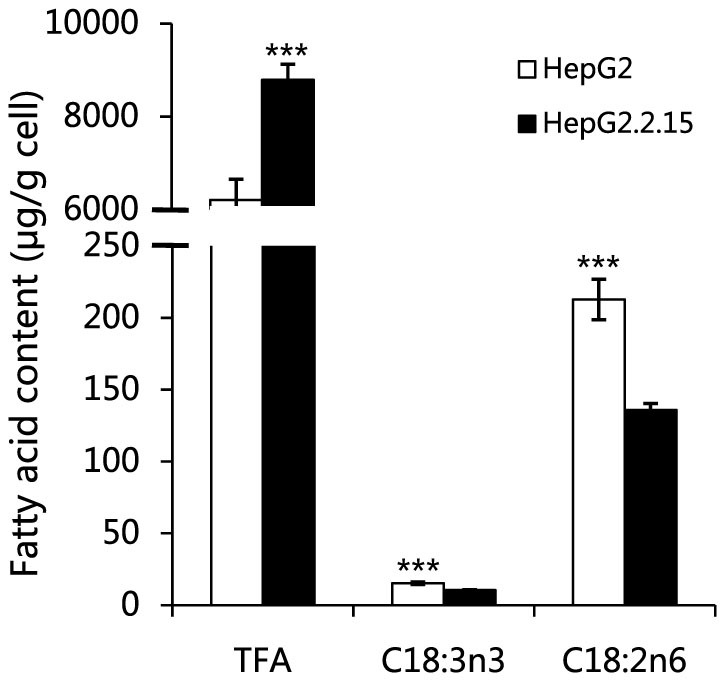
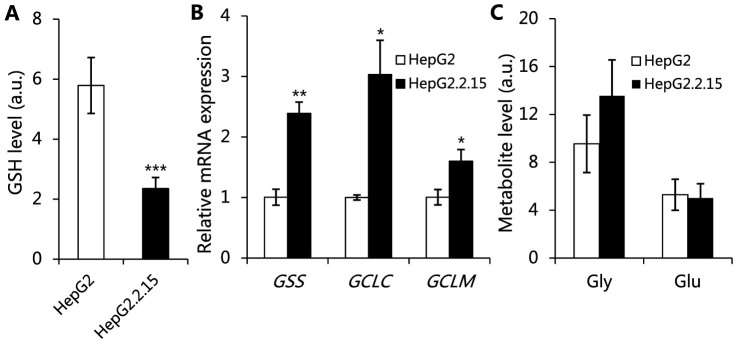
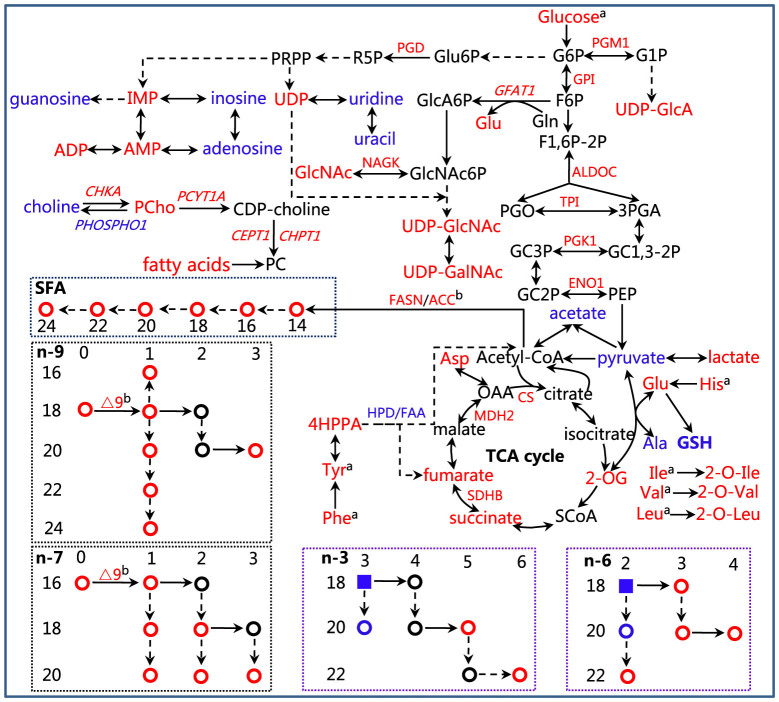
Chronic infection caused by the hepatitis B virus (HBV), is strongly associated with hepatitis, fatty liver and hepatocellular carcinoma. To investigate the underlying mechanisms, we characterize the metabolic features of host cells infected with the virus using systems biological approach. The results show that HBV replication induces systematic metabolic alterations in host cells. HBV infection up-regulates the biosynthesis of hexosamine and phosphatidylcholine by activating glutamine-fructose-6-phosphate amidotransferase 1 (GFAT1) and choline kinase alpha (CHKA) respectively, which were reported for the first time for HBV infection. Importantly suppressing hexosamine biosynthesis and phosphatidylcholine biosynthesis can inhibit HBV replication and expression. In addition, HBV induces oxidative stress and stimulates central carbon metabolism and nucleotide synthesis. Our results also indicate that HBV associated hepatocellular carcinoma could be attributed to GFAT1 activated hexosamine biosynthesis and CHKA activated phosphatidylcholine biosynthesis. This study provides further insights into the pathogenesis of HBV-induced diseases, and sheds new light on drug target for treating HBV infection.
Figures
Similar articles
-
Significant metabolic alterations in patients with hepatitis B virus replication observed via serum untargeted metabolomics shed new light on hepatitis B virus infection.J Drug Target. 2022 Apr;30(4):442-449. doi: 10.1080/1061186X.2021.2009841. Epub 2021 Dec 6. J Drug Target. 2022. PMID: 34844491
-
Unraveling the complexity of hepatitis B virus: from molecular understanding to therapeutic strategy in 50 years.Int J Biochem Cell Biol. 2013 Sep;45(9):1987-96. doi: 10.1016/j.biocel.2013.06.017. Epub 2013 Jun 29. Int J Biochem Cell Biol. 2013. PMID: 23819994 Review.
-
Hepatitis B virus replication and sex-determining region Y box 4 production are tightly controlled by a novel positive feedback mechanism.Sci Rep. 2015 May 13;5:10066. doi: 10.1038/srep10066. Sci Rep. 2015. PMID: 25970172 Free PMC article.
-
Fatty acid biosynthesis is involved in the production of hepatitis B virus particles.Biochem Biophys Res Commun. 2016 Jun 17;475(1):87-92. doi: 10.1016/j.bbrc.2016.05.043. Epub 2016 May 10. Biochem Biophys Res Commun. 2016. PMID: 27178211
-
Treatment of chronic hepatitis B.Antivir Ther. 2007;12 Suppl 3:H33-41. Antivir Ther. 2007. PMID: 18284181 Review.
Cited by
-
Tumor growth affects the metabonomic phenotypes of multiple mouse non-involved organs in an A549 lung cancer xenograft model.Sci Rep. 2016 Jun 22;6:28057. doi: 10.1038/srep28057. Sci Rep. 2016. PMID: 27329570 Free PMC article.
-
Identification of novel biomarkers of hepatocellular carcinoma by high-definition mass spectrometry: Ultrahigh-performance liquid chromatography quadrupole time-of-flight mass spectrometry and desorption electrospray ionization mass spectrometry imaging.Rapid Commun Mass Spectrom. 2020 Apr;34 Suppl 1(Suppl 1):e8551. doi: 10.1002/rcm.8551. Epub 2019 Nov 6. Rapid Commun Mass Spectrom. 2020. PMID: 31412144 Free PMC article.
-
Proteomic characterization of the natural history of chronic HBV infection revealed by tandem mass tag-based quantitative proteomics approach.Mater Today Bio. 2022 May 25;15:100302. doi: 10.1016/j.mtbio.2022.100302. eCollection 2022 Jun. Mater Today Bio. 2022. PMID: 35665232 Free PMC article.
-
Serum lipid alterations identified in chronic hepatitis B, hepatitis B virus-associated cirrhosis and carcinoma patients.Sci Rep. 2017 Feb 15;7:42710. doi: 10.1038/srep42710. Sci Rep. 2017. PMID: 28198443 Free PMC article.
-
Role of HDAC9-FoxO1 Axis in the Transcriptional Program Associated with Hepatic Gluconeogenesis.Sci Rep. 2017 Jul 21;7(1):6102. doi: 10.1038/s41598-017-06328-3. Sci Rep. 2017. PMID: 28733598 Free PMC article.
References
-
- Lavanchy D. Hepatitis B virus epidemiology, disease burden, treatment, and current and emerging prevention and control measures. J Viral Hepat 11, 97–107 (2004). - PubMed
-
- Ganem D. & Prince A. M. Mechanisms of disease: Hepatitis B virus infection - Natural history and clinical consequences. N Engl J Med 350, 1118–1129 (2004). - PubMed
-
- Lai C. L. et al. Viral hepatitis B. Lancet 362, 2089–2094 (2003). - PubMed
-
- Tong A. P. et al. Proteomic analysis of cellular protein alterations using a hepatitis B virus-producing cellular model. Proteomics 8, 2012–2023 (2008). - PubMed
-
- Hajjou M. et al. cDNA microarray analysis of HBV transgenic mouse liver identifies genes in lipid biosynthetic and growth control pathways affected by HBV. J Med Virol 77, 57–65 (2005). - PubMed
Publication types
MeSH terms
Substances
LinkOut - more resources
Full Text Sources
Other Literature Sources
Medical
Research Materials
