

A proof-of-principle study of multi-site real-time functional imaging at 3T and 7T: Implementation and validation
- PMID: 25672521
- PMCID: PMC4325335
- DOI: 10.1038/srep08413
A proof-of-principle study of multi-site real-time functional imaging at 3T and 7T: Implementation and validation
Abstract
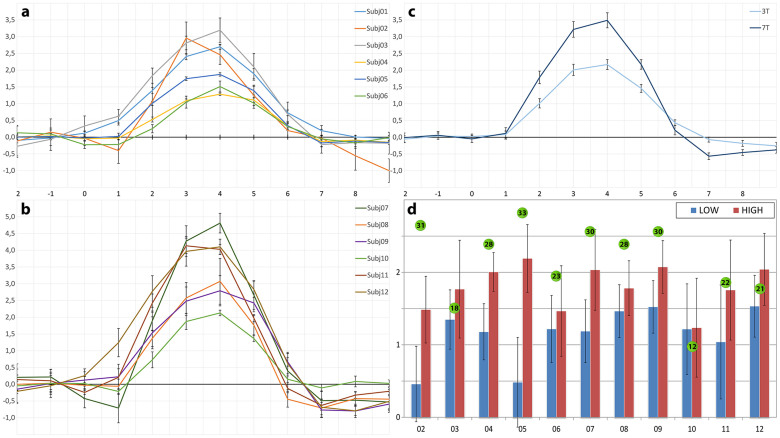
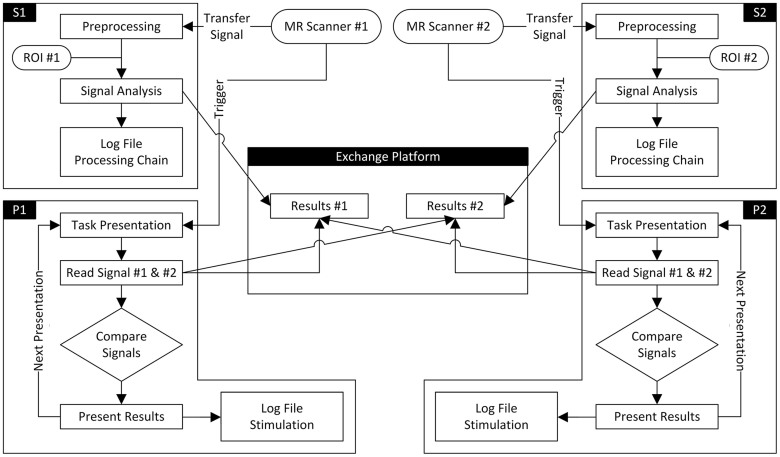
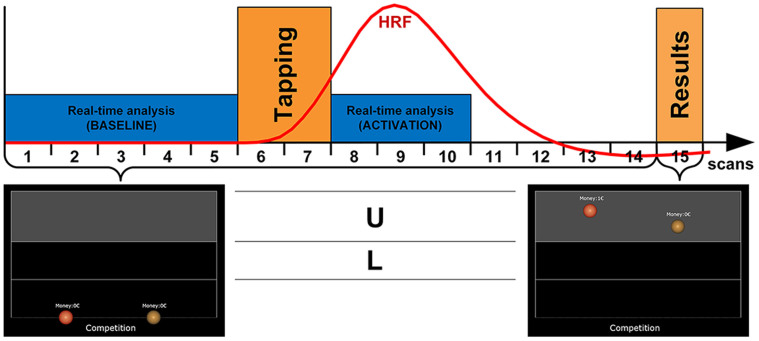
Real-time functional Magnetic Resonance Imaging (rtfMRI) is used mainly for neurofeedback or for brain-computer interfaces (BCI). But multi-site rtfMRI could in fact help in the application of new interactive paradigms such as the monitoring of mutual information flow or the controlling of objects in shared virtual environments. For that reason, a previously developed framework that provided an integrated control and data analysis of rtfMRI experiments was extended to enable multi-site rtfMRI. Important new components included a data exchange platform for analyzing the data of both MR scanners independently and/or jointly. Information related to brain activation can be displayed separately or in a shared view. However, a signal calibration procedure had to be developed and integrated in order to permit the connecting of sites that had different hardware and to account for different inter-individual brain activation levels. The framework was successfully validated in a proof-of-principle study with twelve volunteers. Thus the overall concept, the calibration of grossly differing signals, and BCI functionality on each site proved to work as required. To model interactions between brains in real-time, more complex rules utilizing mutual activation patterns could easily be implemented to allow for new kinds of social fMRI experiments.
Figures
Similar articles
-
Self-regulation of human brain activity using simultaneous real-time fMRI and EEG neurofeedback.Neuroimage. 2014 Jan 15;85 Pt 3:985-95. doi: 10.1016/j.neuroimage.2013.04.126. Epub 2013 May 11. Neuroimage. 2014. PMID: 23668969
-
A new concept of a unified parameter management, experiment control, and data analysis in fMRI: application to real-time fMRI at 3T and 7T.J Neurosci Methods. 2008 Oct 30;175(1):154-62. doi: 10.1016/j.jneumeth.2008.08.013. Epub 2008 Aug 19. J Neurosci Methods. 2008. PMID: 18773922
-
Real-time fMRI brain computer interfaces: self-regulation of single brain regions to networks.Biol Psychol. 2014 Jan;95:4-20. doi: 10.1016/j.biopsycho.2013.04.010. Epub 2013 May 1. Biol Psychol. 2014. PMID: 23643926 Review.
-
Real-time fMRI processing with physiological noise correction - Comparison with off-line analysis.J Neurosci Methods. 2015 Dec 30;256:117-21. doi: 10.1016/j.jneumeth.2015.08.033. Epub 2015 Sep 4. J Neurosci Methods. 2015. PMID: 26343529
-
Real-time functional magnetic resonance imaging: methods and applications.Magn Reson Imaging. 2007 Jul;25(6):989-1003. doi: 10.1016/j.mri.2007.02.007. Epub 2007 Apr 23. Magn Reson Imaging. 2007. PMID: 17451904 Review.
Cited by
-
Towards a mechanistic understanding of the human subcortex.Nat Rev Neurosci. 2016 Dec 15;18(1):57-65. doi: 10.1038/nrn.2016.163. Nat Rev Neurosci. 2016. PMID: 27974841 Review.
-
Leveraging ultra-high field (7T) MRI in psychiatric research.Neuropsychopharmacology. 2024 Nov;50(1):85-102. doi: 10.1038/s41386-024-01980-6. Epub 2024 Sep 9. Neuropsychopharmacology. 2024. PMID: 39251774 Review.
-
Training Efficiency and Transfer Success in an Extended Real-Time Functional MRI Neurofeedback Training of the Somatomotor Cortex of Healthy Subjects.Front Hum Neurosci. 2015 Oct 9;9:547. doi: 10.3389/fnhum.2015.00547. eCollection 2015. Front Hum Neurosci. 2015. PMID: 26500521 Free PMC article.
-
A Guide to Literature Informed Decisions in the Design of Real Time fMRI Neurofeedback Studies: A Systematic Review.Front Hum Neurosci. 2020 Feb 25;14:60. doi: 10.3389/fnhum.2020.00060. eCollection 2020. Front Hum Neurosci. 2020. PMID: 32161529 Free PMC article.
-
Subcortical nuclei of the human ascending arousal system encode anticipated reward but do not predict subsequent memory.Cereb Cortex. 2025 May 1;35(5):bhaf101. doi: 10.1093/cercor/bhaf101. Cereb Cortex. 2025. PMID: 40346825 Free PMC article.
References
-
- deCharms R. C. Applications of real-time fMRI. Nat. Rev. Neurosci. 9, 720–729 (2008). - PubMed
-
- LaConte S. M. Decoding fMRI brain states in real-time. NeuroImage 56, 440–454 (2011). - PubMed
-
- Weiskopf N. Real-time fMRI and its application to neurofeedback. NeuroImage 62, 682–692 (2012). - PubMed
-
- Zotev V., Phillips R., Yuan H., Misaki M. & Bodurka J. Self-regulation of human brain activity using simultaneous real-time fMRI and EEG neurofeedback. NeuroImage 85, 985–995 (2014). - PubMed
-
- Hollmann M., Baecke S., Müller C. & Bernarding J. Predicting Human Decisions in a Social Interaction-Scenario Using Real-Time fMRI. Paper presented at 17th ISMRM, Honolulu/Hawaii. (2009).
MeSH terms
LinkOut - more resources
Full Text Sources
Other Literature Sources
Medical
