. 2015 Feb 12:5:8409.
doi: 10.1038/srep08409.

Worldwide variations in artificial skyglow

Affiliations

Worldwide variations in artificial skyglow

Christopher C M Kyba et al. Sci Rep. .

Erratum in

  • Corrigendum: Worldwide variations in artificial skyglow.
    Kyba CC, Tong KP, Bennie J, Birriel I, Birriel JJ, Cool A, Danielsen A, Davies TW, den Outer PN, Edwards W, Ehlert R, Falchi F, Fischer J, Giacomelli A, Giubbilini F, Haaima M, Hesse C, Heygster G, Hölker F, Inger R, Jensen LJ, Kuechly HU, Kuehn J, Langill P, Lolkema DE, Nagy M, Nievas M, Ochi N, Popow E, Posch T, Puschnig J, Ruhtz T, Schmidt W, Schwarz R, Schwope A, Spoelstra H, Tekatch A, Trueblood M, Walker CE, Weber M, Welch DL, Zamorano J, Gaston KJ. Kyba CC, et al. Sci Rep. 2015 Aug 5;5:12180. doi: 10.1038/srep12180. Sci Rep. 2015. PMID: 26244555 Free PMC article. No abstract available.

Abstract

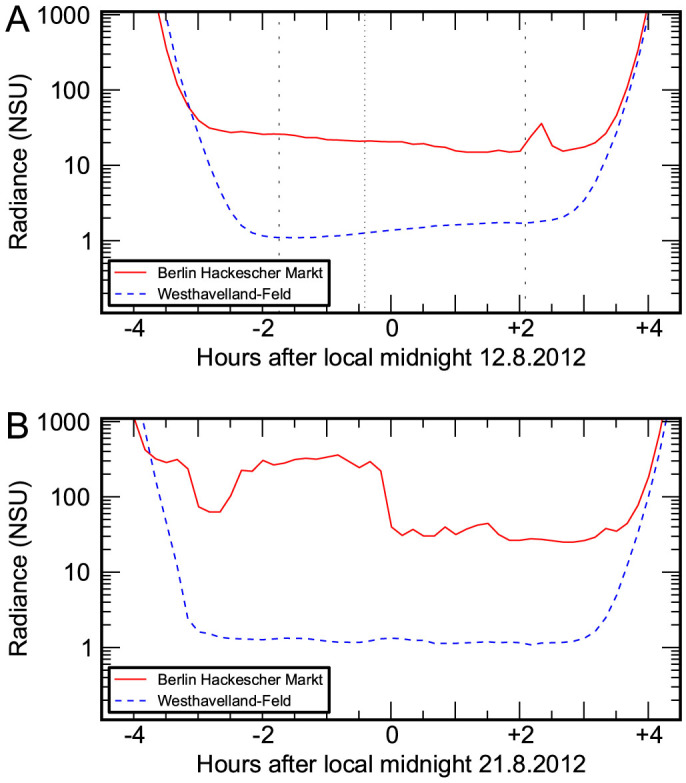
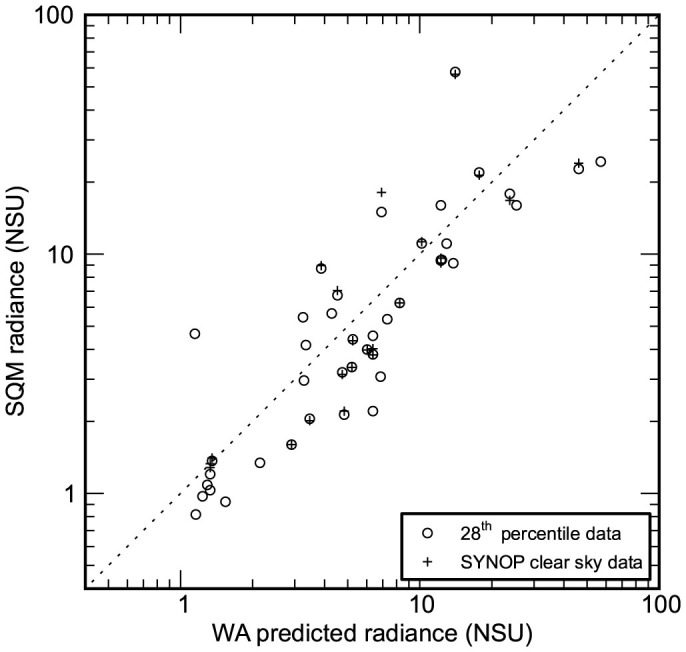
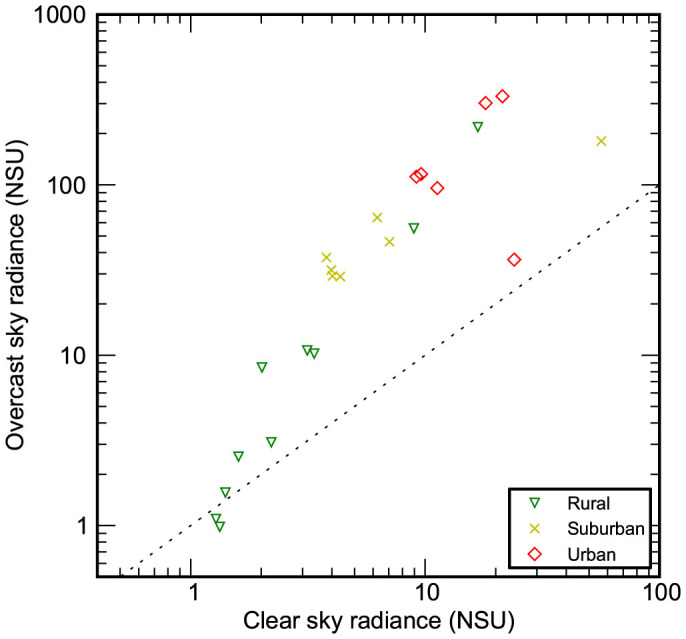
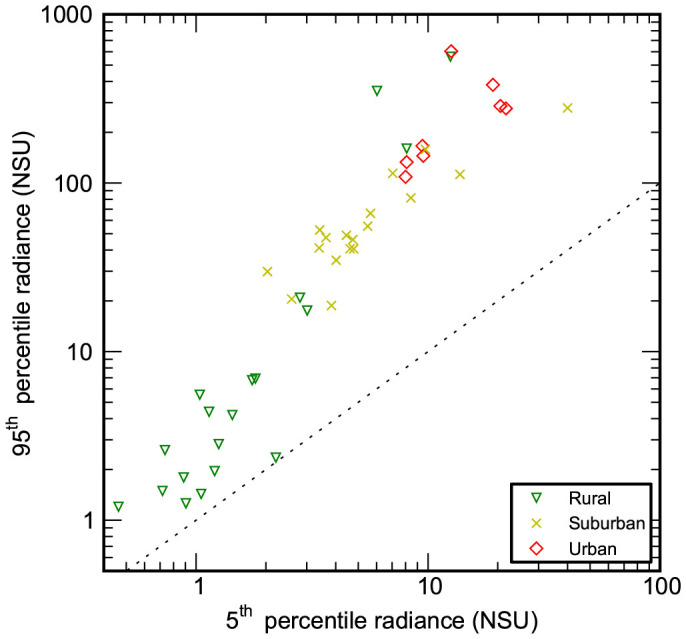
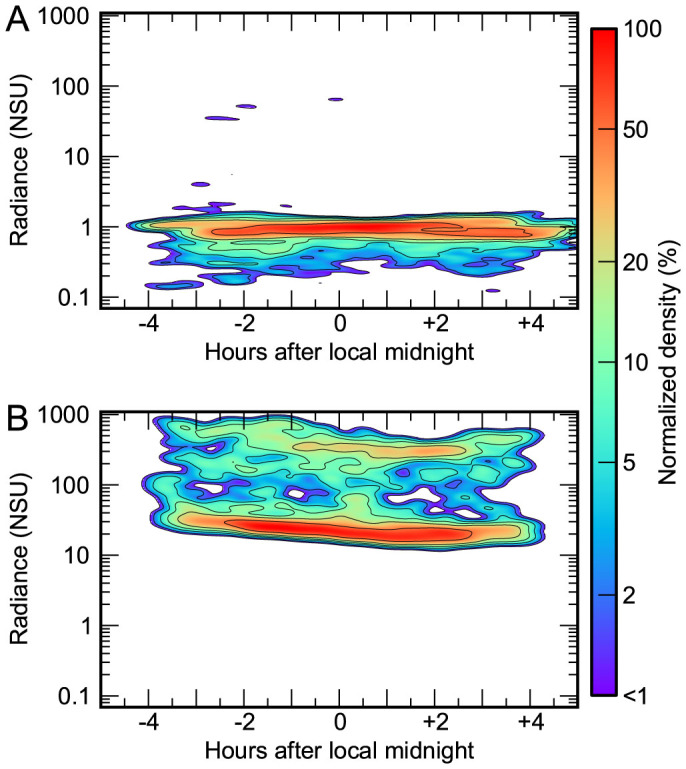
Despite constituting a widespread and significant environmental change, understanding of artificial nighttime skyglow is extremely limited. Until now, published monitoring studies have been local or regional in scope, and typically of short duration. In this first major international compilation of monitoring data we answer several key questions about skyglow properties. Skyglow is observed to vary over four orders of magnitude, a range hundreds of times larger than was the case before artificial light. Nearly all of the study sites were polluted by artificial light. A non-linear relationship is observed between the sky brightness on clear and overcast nights, with a change in behavior near the rural to urban landuse transition. Overcast skies ranged from a third darker to almost 18 times brighter than clear. Clear sky radiances estimated by the World Atlas of Artificial Night Sky Brightness were found to be overestimated by ~25%; our dataset will play an important role in the calibration and ground truthing of future skyglow models. Most of the brightly lit sites darkened as the night progressed, typically by ~5% per hour. The great variation in skyglow radiance observed from site-to-site and with changing meteorological conditions underlines the need for a long-term international monitoring program.


Conflict of interest statement

A.T. is the president of Unihedron, the company that produces the SQM.

Figures

Figure 1
Figure 1. Comparison of scotographs for urban and rural locations.
Panel A shows the sky radiance in “natural sky units” (relative to an assumed natural radiance of 21.6 magSQM/arcsec2, see methods) for a clear night in a city center (solid red) and nearby nature reserve (dashed blue). The sky radiance was similar until shortly before astronomical night began (dashed vertical lines). The sky in the reserve grew brighter as the 36% illuminated moon rose (dotted vertical line), but the sky in the city grew darker. Panel B shows scotographs taken on a cloudy night. In the city, sky radiance changed by more than an order of magnitude as clouds passed over, while the response was more muted in the country.
Figure 2
Figure 2. Comparison of clear sky observations to World Atlas values.
Radiances are plotted in “natural sky units”. Circles indicate the 28th percentile brightness at each site, and crosses show the median radiance for sites with SYNOP data. Observations that perfectly matched the prediction would lie on the dashed line.
Figure 3
Figure 3. Comparison of clear to overcast sky radiance.
The relationship between median midnight clear and overcast sky radiance is shown for locations at which cloud coverage data were available. A dashed 1:1 line is shown for reference. Points above the line are areas where clouds make the sky brighter, whereas below the line clouds make the sky darker.
Figure 4
Figure 4. Comparison of 5th to 95th percentile in sky brightness.
The extremes in sky radiance are shown for all sites at all periods of astronomical night. A dashed 1:1 line is shown for reference; points on this line would have zero variation in sky brightness under all weather conditions. Locations which have 5th percentile values below 1 NSU likely indicate that the sky is darker when overcast.
Figure 5
Figure 5. Contour plot showing observed sky brightness during moonless nights over the full data period.
Panel A shows Kitt Peak, AZ, USA (5283 observations on 94 nights), Panel B shows Hackescher Markt, Berlin, Germany (1061 observations on 44 nights). For reference, 1000 NSU is 14.1 magSQM/arcsec2, and 10 NSU is 19.1 magSQM/arcsec2. Panel B also displays the separation into two typical regimes corresponding to clear and overcast conditions typical of bright sites (c.f. Ref. 37).

References

    1. Central Intelligence Agency. The World Factbook. URL: https://www.cia.gov/library/publications/the-world-factbook/fields/2085.... (2013). Access date 25 August, 2014.
    1. Longcore T. & Rich C. Ecological light pollution. Front Ecol Environ 2, 191–198 (2004).
    1. Rich, C. & Longcore, T. (eds.) Ecological Consequences of Artificial Night Lighting (Island Press, Washington, D.C., USA, 2006).
    1. Hölker F., Wolter C., Perkin E. K. & Tockner K. Light pollution as a biodiversity threat. Trends Ecol Evol 25, 681–682 (2010). - PubMed
    1. Perkin E. et al. The influence of artificial light on freshwater and riparian ecosystems: Questions, challenges, and perspectives. Ecosphere 2, art122 (2011).

Publication types

LinkOut - more resources