. 2015 Feb 12:5:8336.
doi: 10.1038/srep08336.

A statistically inferred microRNA network identifies breast cancer target miR-940 as an actin cytoskeleton regulator

Affiliations

A statistically inferred microRNA network identifies breast cancer target miR-940 as an actin cytoskeleton regulator

Ricky Bhajun et al. Sci Rep. .

Abstract

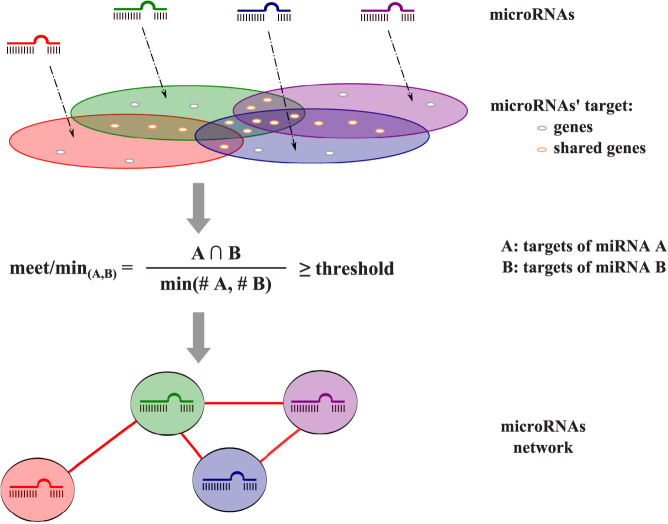
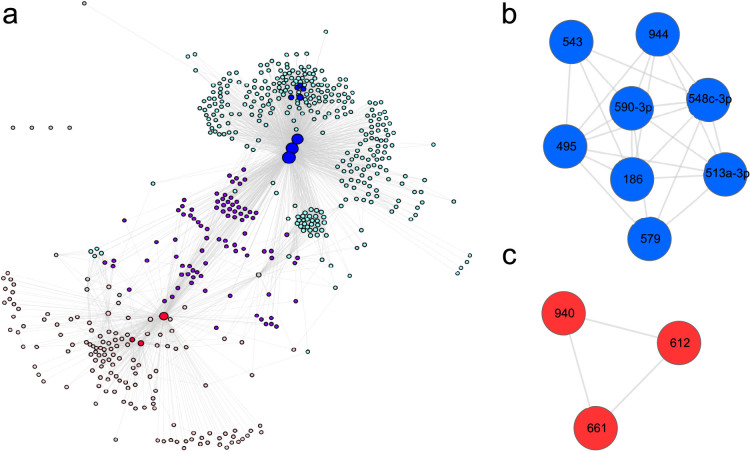
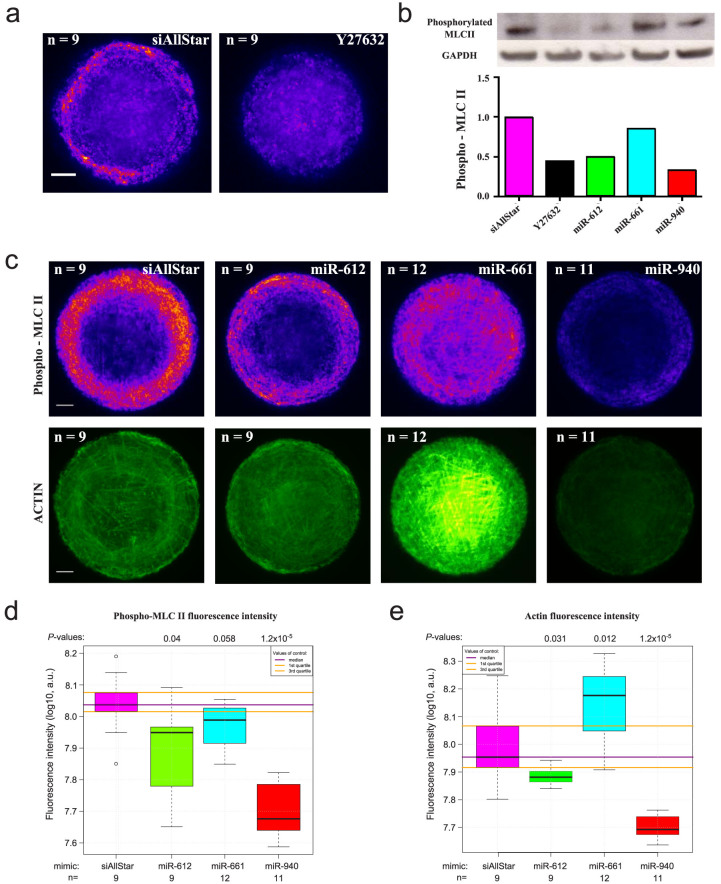
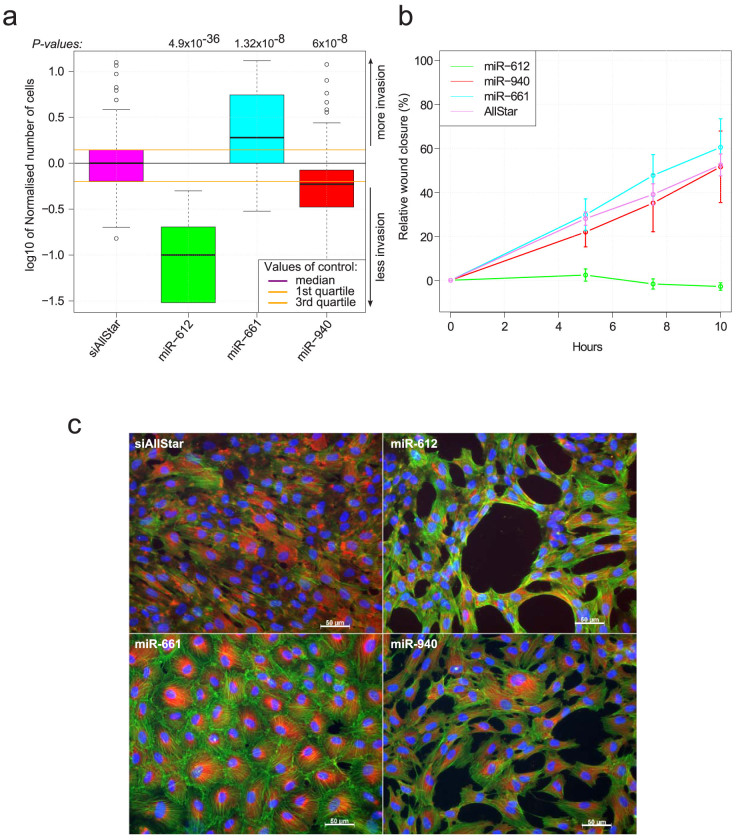
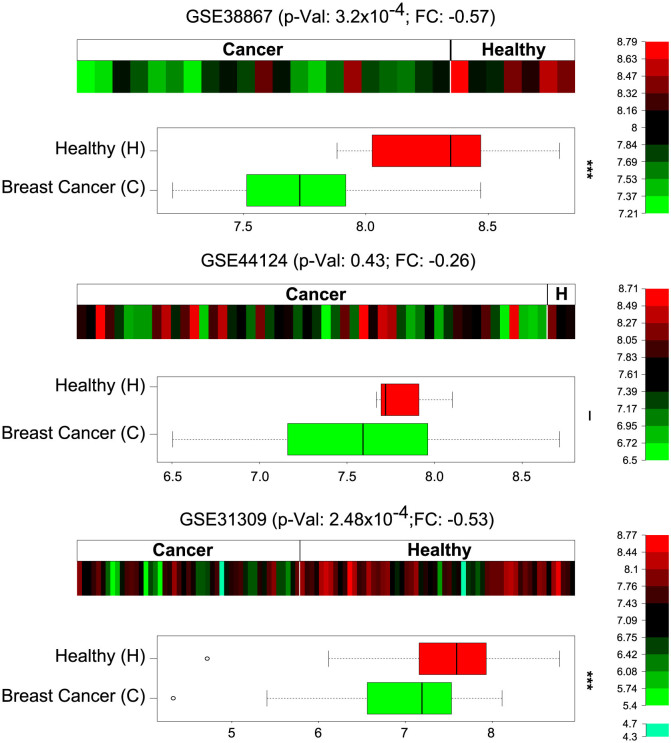
MiRNAs are key regulators of gene expression. By binding to many genes, they create a complex network of gene co-regulation. Here, using a network-based approach, we identified miRNA hub groups by their close connections and common targets. In one cluster containing three miRNAs, miR-612, miR-661 and miR-940, the annotated functions of the co-regulated genes suggested a role in small GTPase signalling. Although the three members of this cluster targeted the same subset of predicted genes, we showed that their overexpression impacted cell fates differently. miR-661 demonstrated enhanced phosphorylation of myosin II and an increase in cell invasion, indicating a possible oncogenic miRNA. On the contrary, miR-612 and miR-940 inhibit phosphorylation of myosin II and cell invasion. Finally, expression profiling in human breast tissues showed that miR-940 was consistently downregulated in breast cancer tissues.


Conflict of interest statement

The authors declare no competing financial interests.

Figures

Figure 1
Figure 1. Construction of the microRNA network.
The meet/min metric measures target coverage between microRNAs. A threshold (0.5 is chosen throughout the article) is imposed on the meet/min edges, thus defining a binary network of microRNAs that share common targets. #: number of.
Figure 2
Figure 2. DIANA-microT network at meet/min 0.5.
(a)The network can be divided into two parts (pink and cyan) linked by a few common microRNAs in the middle (purple). In cyan are the nodes that are connected to at least one microRNA of the assorted club 1; in pink are the nodes connected to the assorted club 2; and in purple are the nodes connected to both groups. The nodes not directly connected to the assorted clubs are in grey. Four nodes remained isolated from the entire graph; they are shown in the top left part. Node size is proportional to the node degree. (b) Assorted club 1 has a density of 0.8. It comprises miR-495, miR-548c-3p, miR-590-3p, miR-186, miR-579, miR-513a-3p, miR-543 and miR-944. (c) The assorted club 2 has a density of 1 and is composed of miR-661, miR-612 and miR-940.
Figure 3
Figure 3. Involvement of miR-661, miR-612 and miR-940 in small GTPase signalling.
(a) Immunostaining of phosphomyosin II and actin filaments of RPE1 cells plated on 500 µm2 circular fibronectin patterns. RPE1 cells were transfected with siRNA-AllStars (siAllStars, negative control) and Y27632 (ROCK inhibitor). They were immunolabeled for phosphomyosin II. Nine different images for each condition were taken, aligned and projected into a single image by using the median value of all images for each pixel (Median Z projection of ImageJ). Rescaled with the same conditions, the images were color-coded with the “fire” look-up table to highlight intensity variations. Scale bar, 5 µm. (b) Western blot of phosphomyosin II. RPE1 cells were lysed and supplemented with protease inhibitor. A total of 10 µg of proteins were deposited and hybridised to MLCII antibodies. GAPDH was used as a loading control. The bar plot shows the GAPDH-normalised signal rescaled to siAllStars. (c) Immunostaining of phosphomyosin II and actin filaments. RPE1 cells were transfected with miR-612, miR-661 or miR-940 mimics and immunolabeled for phosphomyosin II and actin fibres on 1000 µm2 circular fibronectin patterns. For myosin and actin images, 9 to 12 images were taken, aligned and projected into a single image. They were color-coded with the “fire” and “green hot” look-up table to highlight intensity variations for myosin and actin staining, respectively. Scale bar, 5 µm. (d) Log10 of phosphorylated myosin II fluorescence intensity. The integrated fluorescence intensity of myosin was calculated from single images after cell segmentation for each condition. P-values were calculated using the non-parametric two-sided Mann-Whitney test and the number of observations (n) for this calculation. a.u.: arbitrary units. (e) Log10 of actin fluorescence intensity. The integrated fluorescence intensity of actin filaments was calculated from single images after cell segmentation for each condition. P-values are calculated using the non-parametric two sided Mann-Whitney test and the number of observations (n) for this calculation. a.u.: arbitrary units.
Figure 4
Figure 4. Effect of miR-612, miR-661 and miR-940 on RPE1 migration and proliferation.
(a) Motility graph: Normalised number of cells for the transwell assay. RPE1 cells were independently transfected with mimics of miR-661, miR-612 and miR-940. The number of cells that passed through the 5 µm holes after 18 hours were counted. Four independent experiments were conducted. The cell number was normalised based on the negative control cells, and all four experiments were pooled. P-values were calculated using the non-parametric two sided Mann-Whitney test. (b) Wound healing assay. Relative wound closure after a scratch was made in confluent cells transfected by mimics of the three microRNAs. The experiment was conducted on 10 hours with images taken at t0, t0+5h, t0+7.5h, and t0+10h. Each condition was present in triplicates. (c) Vinculin and phalloïdin immunostaining images of the cells transfected by mimics of the three microRNAs. The images were taken at the AxioImager®.
Figure 5
Figure 5. Relative expression of miR-940 in breast cancer.
Expression of miR-940 on three datasets of human breast cancer taken from GEO (GSE38867, GSE44124 and GSE31309). The expression of the microRNA is consistently downregulated in breast cancer tissues on the three experiments. On two out of three microarray sets, miR-940 is differentially expressed with high significance based on limma analysis (p-Value < 0.001).

References

    1. Kloosterman W. P. & Plasterk R. H. A. The Diverse Functions of MicroRNAs in Animal Development and Disease. Dev. Cell 11, 441–450 (2006). - PubMed
    1. Alvarez-Garcia I. & Miska E. A. MicroRNA functions in animal development and human disease. Development 132, 4653–4662 (2005). - PubMed
    1. Yi R. & Fuchs E. MicroRNAs and their roles in mammalian stem cells. J. Cell Sci. 124, 1775–83 (2011). - PMC - PubMed
    1. Lee R. C., Feinbaum R. L. & Ambros V. The C. elegans heterochronic gene lin-4 encodes small RNAs with antisense complementarity to lin-14. Cell 75, 843–854 (1993). - PubMed
    1. Van Rooij E. & Olson E. N. MicroRNA therapeutics for cardiovascular disease: opportunities and obstacles. Nat. Rev. Drug Discov. 11, 860–872 (2012). - PMC - PubMed

Publication types