. 2015 Apr;5(4):410-23.
doi: 10.1158/2159-8290.CD-14-1473. Epub 2015 Feb 11.

Atg7 Overcomes Senescence and Promotes Growth of BrafV600E-Driven Melanoma

Affiliations

Atg7 Overcomes Senescence and Promotes Growth of BrafV600E-Driven Melanoma

Xiaoqi Xie et al. Cancer Discov. 2015 Apr.

Abstract

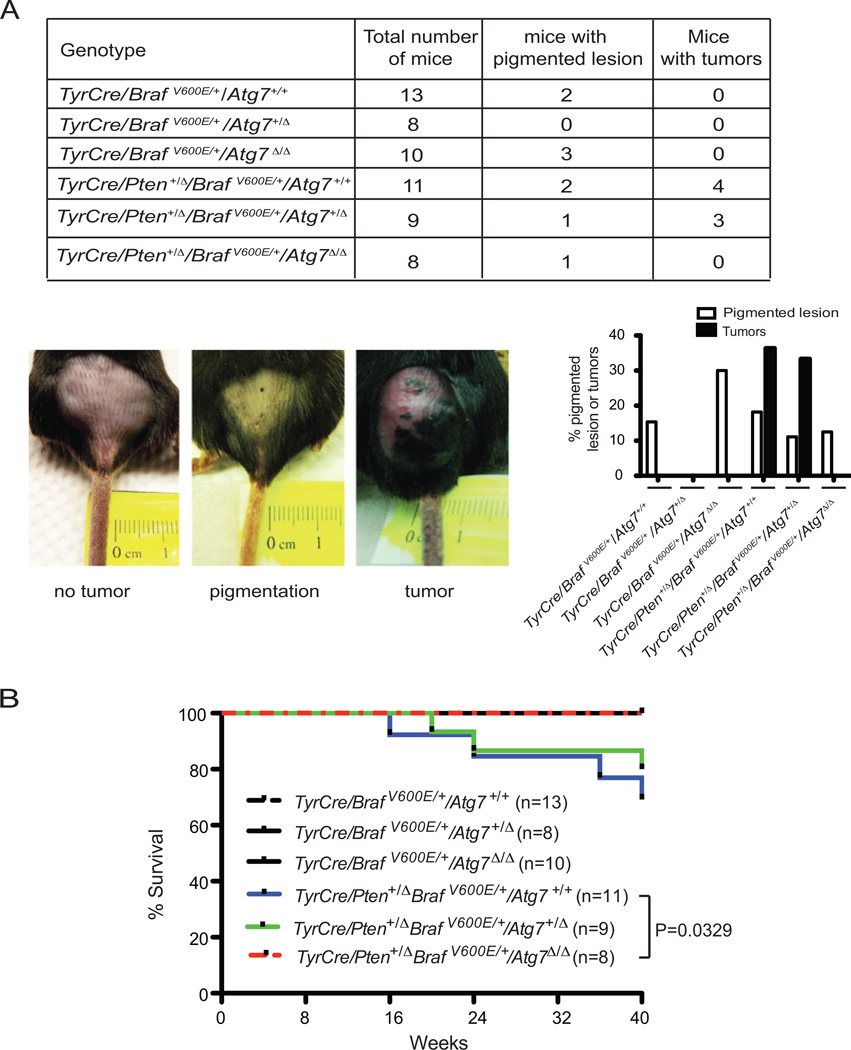
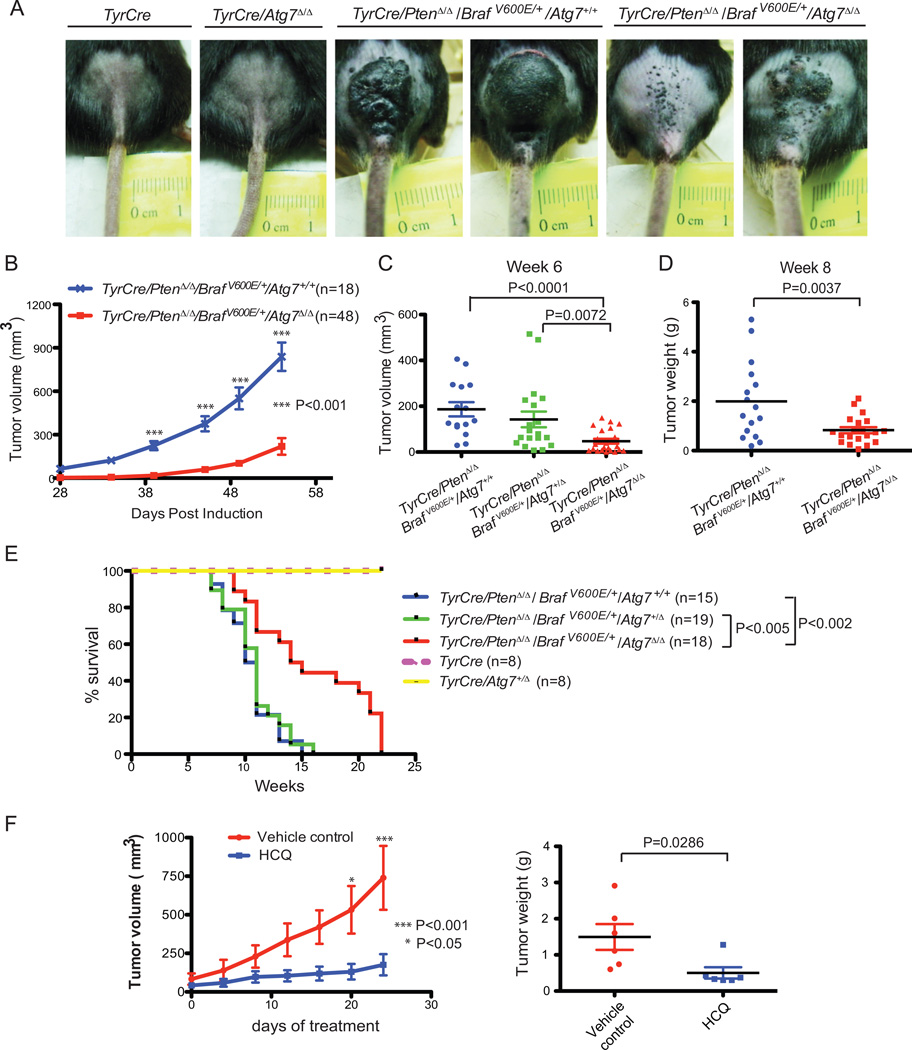
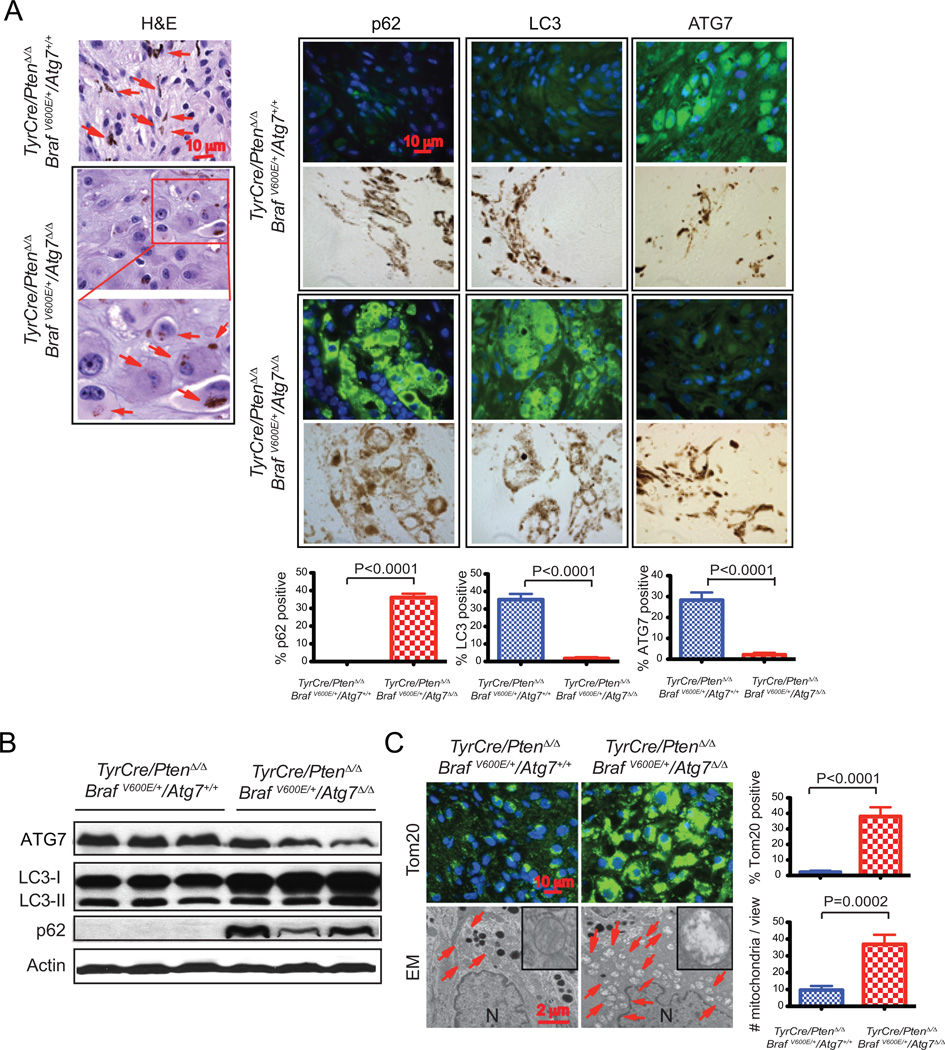
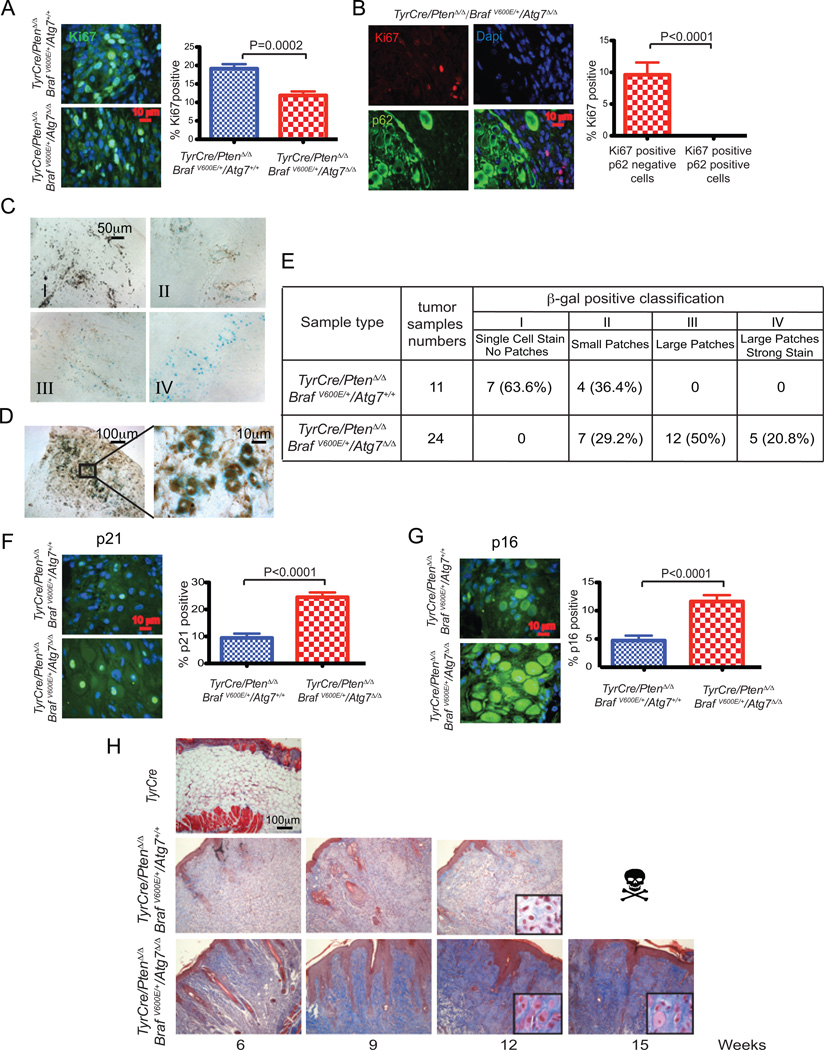
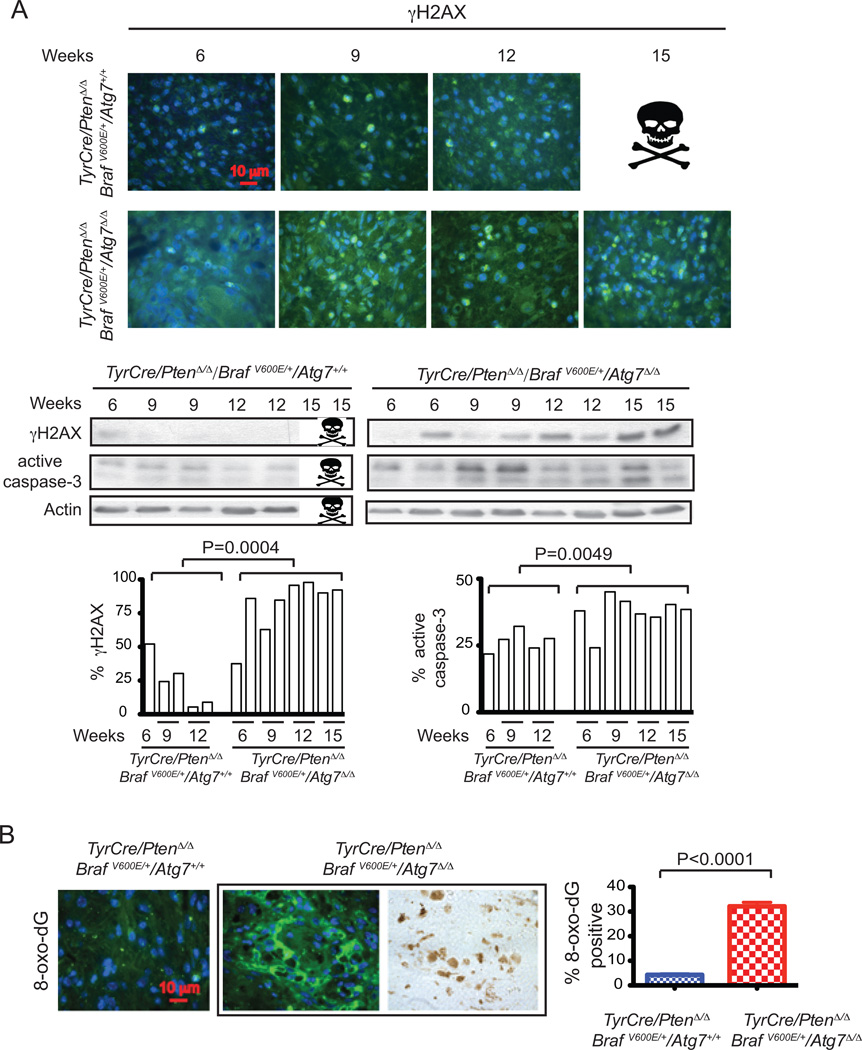
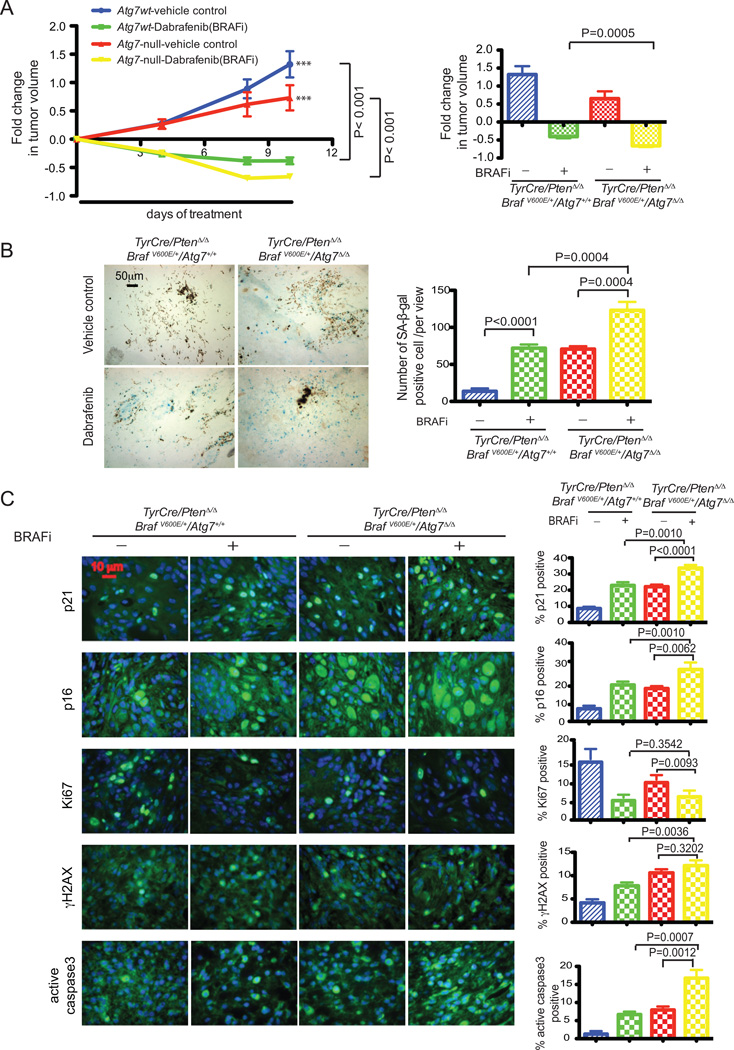
Macroautophagy (autophagy hereafter) may promote survival and growth of spontaneous tumors, including melanoma. We utilized a genetically engineered mouse model of melanoma driven by oncogenic BrafV600E and deficiency in the Pten tumor suppressor gene in melanocytes to test the functional consequences of loss of the essential autophagy gene autophagy-related-7, Atg7. Atg7 deficiency prevented melanoma development by BrafV600E and allelic Pten loss, indicating that autophagy is essential for melanomagenesis. Moreover, BrafV600E-mutant, Pten-null, Atg7-deficient melanomas displayed accumulation of autophagy substrates and growth defects, which extended animal survival. Atg7-deleted tumors showed increased oxidative stress and senescence, a known barrier to melanomagenesis. Treatment with the BRAF inhibitor dabrafenib decreased tumor growth and induced senescence that was more pronounced in tumors with Atg7 deficiency. Thus, Atg7 promotes melanoma by limiting oxidative stress and overcoming senescence, and autophagy inhibition may be of therapeutic value by augmenting the antitumor activity of BRAF inhibitors.

Significance: The essential autophagy gene Atg7 promotes development of BrafV600E-mutant, Pten-null melanomas by overcoming senescence, and deleting Atg7 facilitated senescence induction and antitumor activity of BRAF inhibition. This suggests that combinatorial BRAFV600E and autophagy inhibition may improve therapeutic outcomes in patients whose tumors have BRAFV600E/K mutations, an approach currently being explored in clinical trials.


Conflict of interest statement

Disclosure of potential conflict of interest: The authors have no potential conflicts of interest that pertain to this work.

Figures

Figure 1
Figure 1. Tumor-specific Atg7 deletion in a BRAFV600E –driven and Pten heterozygous melanoma mouse model slows melanoma development
A. The table shows numbers of 4-HT-induced mice and the breakdown of lesion type by genotype. The bar graph shows the percentage of mice with development of either pigmented lesions or melanoma by genotype during the 10-month post-induction period. Representative pictures of induced pigmented lesions and melanoma tumors on the lower back skin of the mice are shown. B. Kaplan-Meier survival curve of mice with the indicated tumor genotypes. Number of mice per group and P values (Log-rank Mantel-Cox test) are indicated.
Figure 2
Figure 2. Tumor-specific Atg7 ablation in BRAFV600E–driven and Pten deficient melanomas impedes tumor growth and extends survival
A. Representative pictures of the lower back skin of the mice 6 weeks post 4-HT induction. Mice with TyrCre/PtenΔ/Δ/BRAF/V600E/Atg7+/+ melanomas have greater tumor burden compared with those with Atg7 deletion. The control mice with the genotypes of TyrCre and TyrCre/Atg7Δ/Δ show no tumor burden. B. Tumor growth curves of mice with TyrCre/PtenΔ/Δ/BRAF/V600E/Atg7+/+ and TyrCre/PtenΔ/Δ/BRAFV600E/Atg7Δ/Δ melanomas. Tumors with Atg7 deletion demonstrate slower growth. The number of mice per group and P value (two way ANOVA, Bonferroni posttests) are indicated. C. Tumor size comparison. Tumor volumes were measured at week 6. D. Tumor weight comparison. In an independent experiment, 8 weeks after 4-HT induction, mice were euthanized and tumor samples were collected for weight measurement. E. Kaplan-Meier survival curve of mice with the indicated genotypes. The number of mice per group and P values (Log-rank Mantel-Cox test) are indicated. (F). Melanomas were induced with 4-HT to generate TyrCre/PtenΔ/Δ/BRAFV600E/Atg7+/+ tumors. When tumor volumes reached the size of approximately 100 mm3, HCQ (130mg/kg daily) or vehicle control were administered intraperitoneally. Tumor sizes were measured every 4 days. The tumor growth curve is indicated in the left panel with p values (two way ANOVA, Bonferroni posttests) and the weights of tumor samples collected the day after the last HCQ injection are indicated in the right panel with p value (t-test, unpaired two-tailed).
Figure 3
Figure 3. Atg7 deficiency is associated with accumulation of defective mitochondria in BRAFV600E–driven, Pten-deficient melanoma
A. Representative images of TyrCre/PtenΔ/Δ/BRAFV600E/Atg7+/+ and TyrCre/PtenΔ/Δ/BRAFV600E/Atg7Δ/Δ tumor histology (hematoxylin and eosin [H&E] staining), and p62, LC3 and ATG7 immunofluorescence staining 9 weeks post tumor induction.. Arrows point to melanin. The positive stains for p62, LC3 and ATG7 co-localize with melanin (brown color), indicating these cells are melanoma cells. B. Western-blot for ATG7, LC3 and p62 of three representative samples. Actin serves as a protein loading control. C. Representative immunofluorescence staining of Tom20 and representative electron microscope images show abnormal mitochondria accumulation in BRAFV600E–driven, Pten-deficient melanoma, with quantification. (N) Nuclei. Arrows point to mitochondria.
Figure 4
Figure 4. Atg7 promotes melanoma proliferation, and suppresses senescence and fibrosis
All histology is from 9 weeks post melanoma induction. A. Representative images of Ki67 immunofluorescence staining and quantification. B. Representative images of co-immunofluorescence staining of Ki67 and p62 with quantification. p62 positive cells show no staining of Ki67. C. Representative images of different types of positive SA-β-gal staining. Type I: single cell positive stain. Type II: small groups (small patches) of cells show positive stain. Type III: large groups (large patches) of cells show positive stain. Type IV: large groups of cells show strong positive stain (large patches, strong stain). D. Image at high magnification shows positive SA-β-gal staining overlapping with melanin, indicating the cells are melanoma cells. E. Table shows the percentage of different types of positive SA-β-gal staining in all TyrCre/PtenΔ/Δ/BRAFV600E/Atg7+/+ and TyrCre/PtenΔ/Δ/BRAFV600E/Atg7Δ/Δ tumor tissue samples at 6, 9, and 12 weeks post melanoma induction. F. Representative images of p21 immunofluorescence staining and quantification shows augmented positive staining with Atg7-deficient melanoma samples. G. Representative images of p16 immunofluorescence staining and quantification show increased positive staining with Atg7-deficient melanoma samples. H. Representative images of Masson’s trichrome stain show more blue connective tissue and tumor cells with larger cytoplasm in Atg7-deficient melanoma samples than those that are wild type. The induced skin sample obtained from TyrCre mouse shows no tumor and serves as a negative control.
Figure 5
Figure 5. Functional autophagy suppresses oxidative stress and DNA damage
A. Representative images of γ-H2AX immunofluorescence staining (upper panel), western blot of γ-H2AX and active caspase-3 of Atg7 wild type and deficient mouse melanoma samples 6, 9, 12, 15 weeks post induction Actin serves as a protein loading control (middle panel). The densitometric ratios from the western blots of γ-H2AX and active caspase-3 versus actin with the p value (t-test, unpaired two-tailed) at the indicated times are shown (lower panel). The images show more DNA damage response activation and apoptosis induction when Atg7 is deleted. B. Representative images of immunofluorescence staining for 8-oxo-dG (left panel) with quantification (right panel) and positivity for 8-oxo-dG co-localizes with melanin (brown color) indicating that these cells are melanoma cells.
Figure 6
Figure 6. BRAF inhibition and autophagy deletion cooperate to impede melanoma tumor growth
A. Melanomas were induced with 4-HT to generate TyrCre/PtenΔ/Δ/BRAFV600E/Atg7+/+ and TyrCre/PtenΔ/Δ/BRAFV600E/Atg7Δ/Δ tumors. When tumors reached the size of 300–750 mm3, dabrafenib (20mg/kg daily) and vehicle control were administered via oral gavage. Tumor sizes were measured and fold changes in tumor volumes were calculated. The tumor growth curve is indicated in the left panel with p values (two way ANOVA, Bonferroni posttests) and the fold change at last time point is indicated in the right panel with p value (t-test, unpaired two-tailed). Each data point represents the mean tumor volume changes from 10–13 mice. B. Representative images of SA-β-gal staining with tumor samples from mice treated with vehicle control or dabrafenib respectively for 4 days with samples collected at day 6 (left panel). Quantification of the images (right panel) revealed significantly more SA-β-gal staining in Atg7-deleted tumor samples treated with dabrafenib compared to vehicle control treated samples, or to the Atg7 wild type samples with dabrafenib or vehicle control treatment. P values were calculated by unpaired two-tailed t-test. Quantification was based on 5 samples of each group and at least of 3 views of each sample. C. Representative images of immunofluorescence staining for p21, p16, Ki67, γ-H2AX, active caspase-3 with quantification and their p values as indicated (right panel).

Comment in

References

    1. Siegel R, Ma J, Zou Z, Jemal A. Cancer statistics, 2014. CA: a cancer journal for clinicians. 2014;64:9–29. - PubMed
    1. Flaherty KT, Infante JR, Daud A, Gonzalez R, Kefford RF, Sosman J, et al. Combined BRAF and MEK inhibition in melanoma with BRAF V600 mutations. N Engl J Med. 2012;367:1694–1703. - PMC - PubMed
    1. Chapman PB, Hauschild A, Robert C, Haanen JB, Ascierto P, Larkin J, et al. Improved survival with vemurafenib in melanoma with BRAF V600E mutation. N Engl J Med. 2011;364:2507–2516. - PMC - PubMed
    1. Ott PA, Hodi FS, Robert C. CTLA-4 and PD-1/PD-L1 blockade: new immunotherapeutic modalities with durable clinical benefit in melanoma patients. Clin Cancer Res. 2013;19:5300–5309. - PubMed
    1. Davies H, Bignell GR, Cox C, Stephens P, Edkins S, Clegg S, et al. Mutations of the BRAF gene in human cancer. Nature. 2002;417:949–954. - PubMed

Publication types

MeSH terms

Substances