. 2015 Apr 24;290(17):10627-42.
doi: 10.1074/jbc.M114.611327. Epub 2015 Feb 11.

Avian Influenza Virus Infection of Immortalized Human Respiratory Epithelial Cells Depends upon a Delicate Balance between Hemagglutinin Acid Stability and Endosomal pH

Affiliations

Avian Influenza Virus Infection of Immortalized Human Respiratory Epithelial Cells Depends upon a Delicate Balance between Hemagglutinin Acid Stability and Endosomal pH

Tomo Daidoji et al. J Biol Chem. .

Abstract

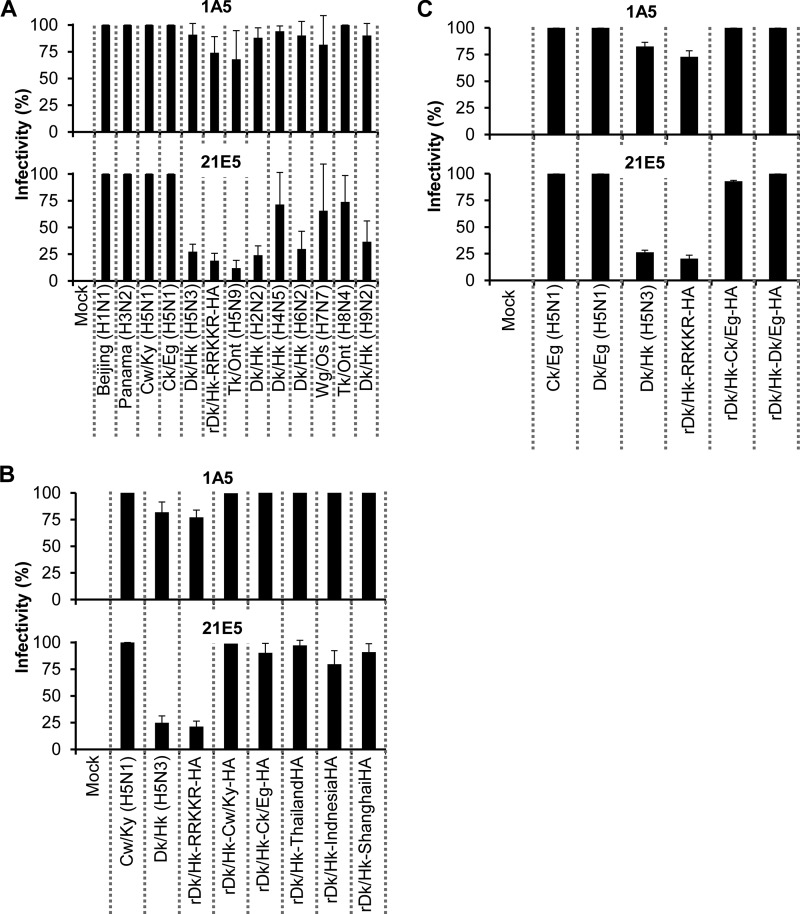
The highly pathogenic avian influenza (AI) virus, H5N1, is a serious threat to public health worldwide. Both the currently circulating H5N1 and previously circulating AI viruses recognize avian-type receptors; however, only the H5N1 is highly infectious and virulent in humans. The mechanism(s) underlying this difference in infectivity remains unclear. The aim of this study was to clarify the mechanisms responsible for the difference in infectivity between the current and previously circulating strains. Primary human small airway epithelial cells (SAECs) were transformed with the SV40 large T-antigen to establish a series of clones (SAEC-Ts). These clones were then used to test the infectivity of AI strains. Human SAEC-Ts could be broadly categorized into two different types based on their susceptibility (high or low) to the viruses. SAEC-T clones were poorly susceptible to previously circulating AI but were completely susceptible to the currently circulating H5N1. The hemagglutinin (HA) of the current H5N1 virus showed greater membrane fusion activity at higher pH levels than that of previous AI viruses, resulting in broader cell tropism. Moreover, the endosomal pH was lower in high susceptibility SAEC-T clones than that in low susceptibility SAEC-T clones. Taken together, the results of this study suggest that the infectivity of AI viruses, including H5N1, depends upon a delicate balance between the acid sensitivity of the viral HA and the pH within the endosomes of the target cell. Thus, one of the mechanisms underlying H5N1 pathogenesis in humans relies on its ability to fuse efficiently with the endosomes in human airway epithelial cells.

Keywords: Avian Influenza Virus; Endosomal pH; Endosome; Epithelial Cell; Hemagglutinin; Membrane Fusion; Tropism; Viral Protein; Virus Entry.


Figures

FIGURE 1.
FIGURE 1.
Expression of viral antigens in primary human SAECs and SAEC-T clones infected with different viruses. A, primary human SAECs were infected with human influenza virus (Beijing (H1N1)) and H5N1 (Cw/Ky (H5N1)) and previously circulating AI viruses (Dk/Hk (H5N3)) at an m.o.i. of 10. Viral antigens were detected by immunostaining (SEE “Experimental Procedures”) at 16 h post-infection (green). Cells nuclei were counterstained with Hoechst 33342 (blue). Scale bars, 100 μm. B, representative SAEC-T clones (1A5 and 21E5) were infected with H5N1 (Cw/Ky (H5N1)) or previously circulating AI viruses (Dk/Hk (H5N3), rDk/Hk-RRKKR-HA) at an m.o.i. of 10. Viral antigens were detected as described in A (green). Cell nuclei were counterstained with Hoechst 33342 (blue). Scale bars, 200 μm.
FIGURE 2.
FIGURE 2.
Susceptibility of human SAEC-T clones to infection by different influenza virus strains. A, high (1A5) and low (21E5) susceptibility clones were infected with human influenza (Beijing (H1N1), Panama (H3N2)), H5N1 (Cw/Ky (H5N1), and Ck/Eg (H5N1)) and previously circulating AI viruses (Dk/Hk (H5N3), rDk/Hk-RRKKR-HA, Tk/Ont (H5N9), Dk/Hk (H2N2), Dk/Hk (H4N5), Dk/Hk (H6N2), Wg/Os (H7N7), Tk/Ont (H8N4), and Dk/Hk (H9N2)) at an m.o.i. of 10. Viral infectivity was determined by calculating the percentage of antigen-positive SAEC-T clones after immunostaining at 16 h post-infection. Data are expressed as the mean ± S.D. of more than three independent experiments. B, high susceptibility clone (1A5) and low susceptibility clone (21E5) were infected with recombinant H5N3 (rDk/Hk-Cw/Ky-HA, rDk/Hk-Ck/Eg-HA, rDk/Hk-ThailandHA, rDk/Hk-IndonesiaHA, or rDk/Hk-ShanghaiHA) viruses containing the HA gene from H5N1 (A/crow/Kyoto/53/04 (clade 2.5), A/chicken/Egypt/CL6/07 (clade 2.2.1), A/Thailand/Kan353/04 (clade 1), A/Indonesia/5/05 (clade 2.1.3), or A/Shanghai/1/06 (clade 2.3.4)) at an m.o.i. of 10. Viral infectivity was determined as described in A. Data are expressed as the mean ± S.D. of three independent experiments. C, high susceptibility clone (1A5) and the low susceptibility clone (21E5) were infected with recombinant Dk/Eg (H5N1) (clade 2.2.1), which shows very high amino acid homology (HA, NP, M1, M2, NS2: 100%; another gene: >99.46%) to the H5N1 human isolate A/Egypt/902786/2006 (H5N1) (clade 2.2.1) and with recombinant H5N3 (rDk/Hk-Dk/Eg-HA) viruses containing the HA gene from A/Egypt/902786/2006 (H5N1) at an m.o.i. of 10. Viral infectivity was determined as described in A. Data are expressed as the mean ± S.D. of three independent experiments. The amino acid homology of Ck/Eg (H5N1) (clade 2.2.1) to the human influenza virus A/Egypt/902786/2006 (H5N1) is as follows: M1, M2, and NS1, 100%; another gene, >99.46%.
FIGURE 3.
FIGURE 3.
Receptor expression by human SAEC-T clones. Expression of SA receptors on high (1A5) and low (21E5) susceptibility human SAEC-T clones was analyzed by flow cytometry. α2,3SA (solid line) and α2,6SA (dotted line) receptors were detected using FITC-conjugated Maackia amurensis (MAA)-FITC and Sambucus nigra (SNA)-FITC lectins, respectively. Control cells (without lectin) are shown as a bold line. MDCK cells (viral susceptible controls) express both α2,3SA and α2,6SA receptors. MDCK, 1A5, and 21E5 cells were treated with neuraminidase to confirm the reliability of lectin staining.
FIGURE 4.
FIGURE 4.
Analysis of viral binding and internalization by human SAEC-T clones. A, virus binding to human SAEC-T clones was analyzed by Western blotting. 1A5 and 21E5 cells (1.0 × 10⁵) were infected with human influenza (Beijing (H1N1)), H5N1 (Cw/Ky (H5N1), or Ck/Eg (H5N1)) and previously circulating AI viruses (rDk/Hk-RRKKR-HA or Tk/Ont (H5N9)) at an m.o.i. of 10. Purified virions were used as a detection limit control (left panel). Cells were infected with viruses for 1 h at 4 °C and harvested immediately. The viral M1 protein was detected with an anti-H5N2 polyclonal antibody. The relative intensity of the bands representing each viral protein was measured using ImageJ. The intensities of Cw/Ky (H5N1) viral proteins in individual membranes were set to 1 (see also B). B, summary of the relative intensities of the viral protein (M1) bands shown in A. C and D, viral internalization was analyzed by confocal imaging of live virus-infected human SAEC-T cells. High (1A5) (C) and low (21E5) (D) susceptibility clones were infected with R18-labeled Cw/Ky (H5N1) or rDk/Hk-RRKKR-HA viruses at an m.o.i. of 3 and virus internalization monitored using time-lapse confocal imaging. The arrow indicates R18-labeled virus (red). The cytoplasm was stained simultaneously with CellTracker Green 5-chloromethylfluorescein diacetate. Nuclei were counterstained with Hoechst 33342 (blue). Left panels, z stack projection of confocal images. Right panels, side-on view of z stacks. Scale bars, 10 μm.
FIGURE 5.
FIGURE 5.
Virus-membrane fusion at low pH in MDCK cells. A, MDCK cells were transfected with the influenza virus HA gene from different H5N1 viruses (Cw/Ky (H5N1), Ck/Eg (H5N1), A/Thailand (H5N1), Indonesia (H5N1), and Shanghai (H5N1)) or with the HA gene from previously circulating AI viruses (Dk/Hk (H2N2), Dk/Hk (H4N5), Dk/Hk (H5N3), rDk/Hk-RRKKR-HA, Tk/Ont (H5N9), Dk/Hk (H6N2), Wg/Os (H7N7), or Tk/Ont (H8N4)). Fusion induction at pH 5.0–5.875 was measured at 24 h post-transfection. Representative fields of cells transfected with each of the indicated viruses and exposed to pH 5.125–5.875 are shown. Red squares show polykaryon formation. Micrographs lacking a red square represent a pH above the fusion threshold. Values in red indicate the pH threshold of HA membrane fusion. The pH threshold was determined as described under “Experimental Procedures.” Scale bars, 200 μm. B, efficiency of polykaryon formation over a pH range of 5.0–5.875 was estimated by dividing the number of nuclei in polykaryons by the total number of nuclei in the same field. Data represent the mean ± S.D. from more than three independent cell culture experiments. C, MDCK cells were infected with H5N1 viruses (Cw/Ky (H5N1) and Ck/Eg (H5N1)), or previously circulating AI viruses (Dk/Hk (H5N3), rDk/Hk-RRKKR-HA, Tk/Ont (H5N9), Dk/Hk (H2N2), Dk/Hk (H4N5), Dk/Hk (H6N2), Wg/Os (H7N7), Tk/Ont (H8N4), or Dk/Hk (H9N2)) at an m.o.i. of 1. At 8 h post-infection, fusion formation over a pH range of 5.0–5.875 was estimated. Representative fields showing cells infected with each of the indicated viruses and exposed to pH 5.0–5.75. Red squares show polykaryon formation. Micrographs lacking a red square represent a pH above the fusion threshold. pH values in red indicate the pH threshold for HA membrane fusion. pH thresholds were determined as described under “Experimental Procedures.” Scale bars, 200 μm. D, efficiency of polykaryon formation over a pH range of 5.0–5.875 was estimated by dividing the number of nuclei in the polykaryons by the total number of nuclei in the same field. Data are expressed as the mean ± S.D. from more than three independent experiments. E, summary of the pH thresholds for membrane fusion for all viral subtypes in transfected cells and infected cells.
FIGURE 6.
FIGURE 6.
pH levels in the vesicles within high and low susceptibility SAEC-T clones. A, high (1A5) and low (21E5) susceptibility cell clones were treated with PBS (upper micrographs, n = 6 micrographs) or calibration buffer (pH 4.5–6.5) (lower micrographs, representative fluorescence images (each micrograph is representative of six individual micrographs per pH value)) and then stained with LysoSensor Green DND-189. Cells were then examined under a confocal microscope. Scale bars, 20 μm. B, stained 1A5 and 21E5 cells were also analyzed by flow cytometry. The profiles of the stained cells are shown as black (1A5) and gray (21E5) lines. Stained CEFs, which are susceptible to AI viruses, are represented by a black line. Control cells (no staining) are represented by bold lines. C, high (1A5) and low (21E5) susceptibility clones were infected with R18-labeled rDk/Hk-RRKKR-HA at an m.o.i. of 10. Immediately after infection, cells were stained with LysoSensor Green DND-189 or LysoTracker Green DND-26 and examined under a confocal microscope. Representative images are shown. Confocal microscopy was used to observe virus localization in infected 1A5 and 21E5 clones (white arrows). Virus particles within vesicles are yellow (merged particles). Upper panels, Z stack projection of confocal images. Lower panels, Z stacks viewed side-on from the dashed line. Scale bars, 10 μm. D, number of virus particles (red and yellow) and merged particles (yellow) is shown. Data are expressed as the mean ± S.D. (n = 10 cells). **, p < 0.01, significantly different from the number of virus particles in the 21E5 clone. E, standard curve constructed using 1A5 and 21E5 clones treated with calibration buffer (pH 4.5–6.5) and stained with LysoSensor Green DND-189 (based on the staining intensity of the calibration buffer-treated cells shown in A). Six micrographs per individual pH value were used to construct the standard curve. F, constitutive vesicular pH value in 1A5 and 21E5 clones calculated from the standard curve. The data are expressed as the mean ± S.D. (based on six individual micrographs for each pH measurement). **, p < 0.01, significantly different from the vesicular pH value in the 21E5 clone.
FIGURE 7.
FIGURE 7.
Endosomal pH levels in high and low susceptibility SAEC-T clones. A, high (1A5) and low (21E5) susceptibility clones were infected with fluorescein-labeled rDk/Hk-RRKKR-HA (white arrows) at an m.o.i. of 3, followed by analysis under a confocal microscope 45 min later. Six representative fluorescence images are shown (from a total of n = 25 micrographs). The cytoplasm was stained simultaneously with CellTrace Far Red (dark blue). Insets show images at higher magnification. Scale bars, 10 μm. B, 1A5 and 21E5 cells were infected with fluorescein-labeled rDk/Hk-RRKKR-HA (white arrows) at an m.o.i. of 3. Immediately after infection, the cells were treated with different calibration buffers (pH 5.0–7.0) and analyzed under a confocal microscope. Five representative fluorescence images are shown (from a total of n = 8 or 9 micrographs showing cells in different pH calibration buffers). The cytoplasm was stained simultaneously with CellTrace Far Red (dark blue). Insets show images at higher magnification. Scale bars, 10 μm. C, standard curve for the fluorescence intensity of fluorescein-labeled rDk/Hk-RRKKR-HA in 1A5 and 21E5 clones was constructed by treating the cells with different calibration buffers (pH 5.0–7.0). At least eight different cells from each micrograph at each individual pH were used to construct the standard curve. D, pH values in the vesicles within 1A5 and 21E5 cells were read off the standard curve. Data are expressed as the mean ± S.D. Each pH measurement in 1A5 and 21E5 cells was based on n = 25 micrographs. **, p < 0.01, significantly different from the vesicular pH value in the 21E5 clone.
FIGURE 8.
FIGURE 8.
BafA1 inhibits virus infectivity. A, high (1A5) and low (21E5) susceptibility clones were treated with BafA1 (1.56–25 nm) and then stained with LysoSensor Green DND-189. Clones were then analyzed under a confocal microscope. Representative fluorescence images are shown (n = 6 micrographs per individual reagent concentration (except for the group treated with 3.125 nm BafA1 (n = 5 micrographs)). Scale bars, 20 μm. B, vesicular pH values in 1A5 and 21E5 clones treated with BafA1 (1.56–25 nm) were calculated from standard curves as described in Fig. 6E. Vesicular pH values in 1A5 and 21E5 clones not treated with BafA1 are shown for comparison (taken from Fig. 6F). Data are expressed as the mean ± S.D. (based on six individual micrographs). C, high (1A5) and low (21E5) susceptibility clones were treated with BafA1 (0–25 nm) for 2 h and then simultaneously infected with Cw/Ky (H5N1) or Dk/Hk (H5N3) at an m.o.i. of 10. Twelve hours later, infectivity was determined by calculating the percentage of antigen-positive SAEC-T cells as described in Fig. 2. Representative micrographs of antigen-positive cells treated with BafA1 are shown. Cell nuclei were also counted. Data are expressed as the mean ± S.D. of three independent experiments. The deduced endosomal pH for each cell clone (1A5 and 21E5) was taken from B. Scale bars, 200 μm.

Similar articles

Cited by

References

    1. World Health Organization (2013) Cumulative number of confirmed human cases of avian influenza A/(H5N1) reported to WHO. www.who.int/influenza/human_animal_interface/EN_GIP_20131210CumulativeNu...
    1. Ito T., Couceiro J. N., Kelm S., Baum L. G., Krauss S., Castrucci M. R., Donatelli I., Kida H., Paulson J. C., Webster R. G., Kawaoka Y. (1998) Molecular basis for the generation in pigs of influenza A viruses with pandemic potential. J. Virol. 72, 7367–7373 - PMC - PubMed
    1. Shinya K., Ebina M., Yamada S., Ono M., Kasai N., Kawaoka Y. (2006) Avian flu: influenza virus receptors in the human airway. Nature 440, 435–436 - PubMed
    1. van Riel D., Munster V. J., de Wit E., Rimmelzwaan G. F., Fouchier R. A., Osterhaus A. D., Kuiken T. (2006) H5N1 virus attachment to lower respiratory tract. Science 312, 399. - PubMed
    1. Fouchier R. A., Schneeberger P. M., Rozendaal F. W., Broekman J. M., Kemink S. A., Munster V., Kuiken T., Rimmelzwaan G. F., Schutten M., Van Doornum G. J., Koch G., Bosman A., Koopmans M., Osterhaus A. D. (2004) Avian influenza A virus (H7N7) associated with human conjunctivitis and a fatal case of acute respiratory distress syndrome. Proc. Natl. Acad. Sci. U.S.A. 101, 1356–1361 - PMC - PubMed

Publication types

MeSH terms

Substances