. 2015 May;89(10):5264-75.
doi: 10.1128/JVI.00129-15. Epub 2015 Feb 11.

Anti-V3/Glycan and Anti-MPER Neutralizing Antibodies, but Not Anti-V2/Glycan Site Antibodies, Are Strongly Associated with Greater Anti-HIV-1 Neutralization Breadth and Potency

Affiliations

Anti-V3/Glycan and Anti-MPER Neutralizing Antibodies, but Not Anti-V2/Glycan Site Antibodies, Are Strongly Associated with Greater Anti-HIV-1 Neutralization Breadth and Potency

Rajesh Abraham Jacob et al. J Virol. 2015 May.

Abstract

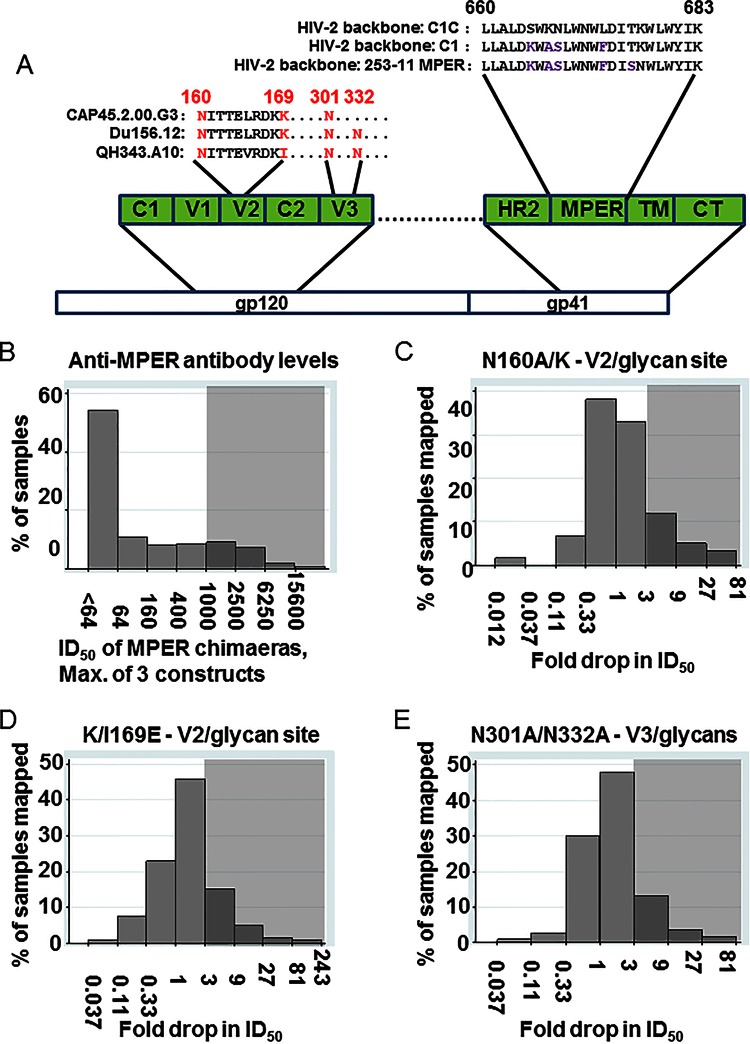
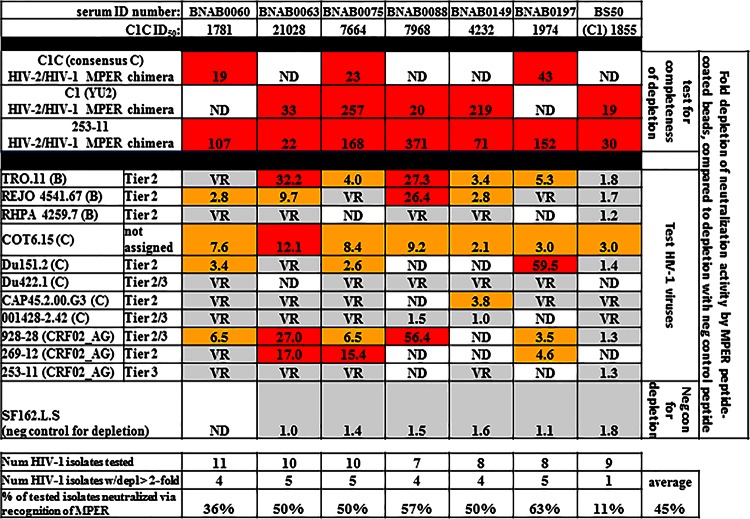
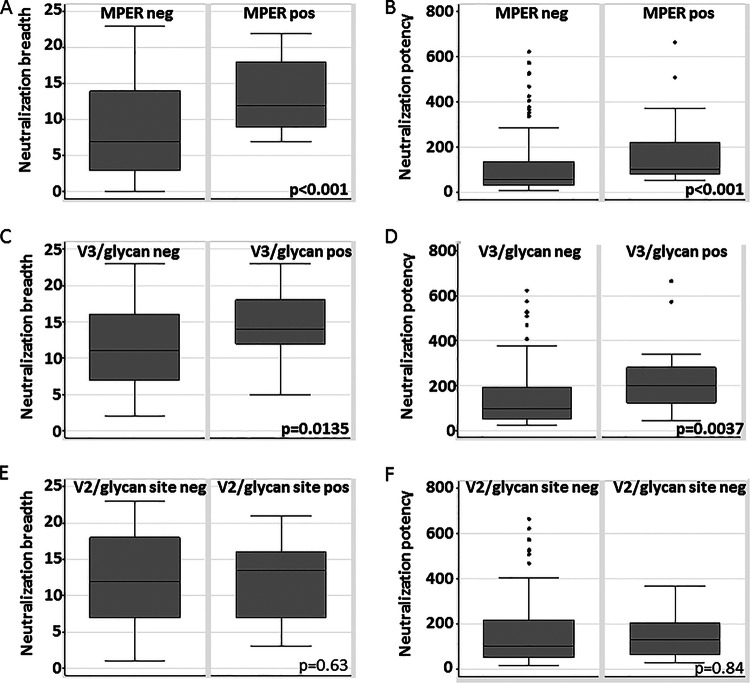
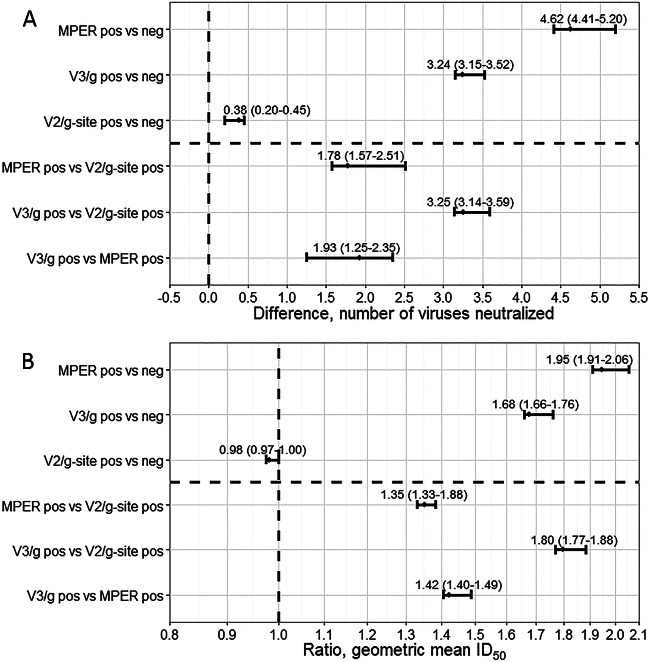
The membrane-proximal external region (MPER), the V2/glycan site (initially defined by PG9 and PG16 antibodies), and the V3/glycans (initially defined by PGT121-128 antibodies) are targets of broadly neutralizing antibodies and potential targets for anti-HIV-1 antibody-based vaccines. Recent evidence shows that antibodies with moderate neutralization breadth are frequently attainable, with 50% of sera from chronically infected individuals neutralizing ≥ 50% of a large, diverse set of viruses. Nonetheless, there is little systematic information addressing which specificities are preferentially targeted among such commonly found, moderately broadly neutralizing sera. We explored associations between neutralization breadth and potency and the presence of neutralizing antibodies targeting the MPER, V2/glycan site, and V3/glycans in sera from 177 antiretroviral-naive HIV-1-infected (>1 year) individuals. Recognition of both MPER and V3/glycans was associated with increased breadth and potency. MPER-recognizing sera neutralized 4.62 more panel viruses than MPER-negative sera (95% prediction interval [95% PI], 4.41 to 5.20), and V3/glycan-recognizing sera neutralized 3.24 more panel viruses than V3/glycan-negative sera (95% PI, 3.15 to 3.52). In contrast, V2/glycan site-recognizing sera neutralized only 0.38 more panel viruses (95% PI, 0.20 to 0.45) than V2/glycan site-negative sera and no association between V2/glycan site recognition and breadth or potency was observed. Despite autoreactivity of many neutralizing antibodies recognizing MPER and V3/glycans, antibodies to these sites are major contributors to neutralization breadth and potency in this cohort. It may therefore be appropriate to focus on developing immunogens based upon the MPER and V3/glycans.

Importance: Previous candidate HIV vaccines have failed either to induce wide-coverage neutralizing antibodies or to substantially protect vaccinees. Therefore, current efforts focus on novel approaches never before successfully used in vaccine design, including modeling epitopes. Candidate immunogen models identified by broadly neutralizing antibodies include the membrane-proximal external region (MPER), V3/glycans, and the V2/glycan site. Autoreactivity and polyreactivity of anti-MPER and anti-V3/glycan antibodies are thought to pose both direct and indirect barriers to achieving neutralization breadth. We found that antibodies to the MPER and the V3/glycans contribute substantially to neutralization breadth and potency. In contrast, antibodies to the V2/glycan site were not associated with neutralization breadth/potency. This suggests that the autoreactivity effect is not critical and that the MPER and the V3/glycans should remain high-priority vaccine candidates. The V2/glycan site result is surprising because broadly neutralizing antibodies to this site have been repeatedly observed. Vaccine design priorities should shift toward the MPER and V3/glycans.


Figures

FIG 1
FIG 1
Statistical prediction model of ID50 values from percent neutralization. (A) Prediction function of ID50 determined by percent neutralization at a 1/100 dilution. The dashed lines correspond to ±2 times the residual standard error. This reflects the conditional normal distribution related to the underlying linear model. (B) Testing of the prediction model was performed using a set of 474 virus/serum combinations with measured 1/100 dilution screening values and ID50 values measured by titration. The data were split into 10 different subsets of approximately the same size; 9 of the subsets were pooled to estimate the model which was used to predict values for the 10th subset. This procedure was repeated 10 times so that a predicted value was obtained for each percent neutralization value. The predicted and measured ID50 values are shown for each of the 474 virus/serum combinations.
FIG 2
FIG 2
Neutralization breadth and potency of cohort sera and association with CD4+ T cell count. (A) The distribution of neutralization breadth of the 177 cohort sera is shown by displaying the number of viruses neutralized by each serum. Gray shading indicates at what level samples were scored positive for high neutralization breadth (>3/4 of panel viruses neutralized). (B) The distribution of neutralization potency of the 177 cohort sera is shown by displaying the geometric mean ID50 of each serum neutralizing the 24 panel viruses. Gray shading indicates at what level samples were scored positive for high neutralization potency (geometric mean ID50, >220). (C) Comparison of neutralization breadth and potency to the CD4+ T cell count measured in the same sample. Potency is shown on a log2 scale. Line fits, P values, and adjusted (Adj) R2 values were calculated from a linear regression model. Gray shading represents the 95% CI of the linear regression line. (D) Relative sensitivity ranking of viruses with respect to the 177 cohort sera. Viruses were ranked by the geometric mean ID50 values for all 177 sera neutralizing that virus; 95% prediction intervals (95% PI) from the marginal prediction of a log linear mixed model are depicted. C (Afr), subtype C and derived from an African donor; C (Ind), subtype C and derived from an Indian donor; unk, unknown. Tier designations are from Seaman et al. (28); Tier 2/3, found to be between tiers 2 and tier 3.
FIG 3
FIG 3
Mapping of anti-MPER, anti-V2/glycan site, and anti-V3/glycan antibodies in the cohort sera. (A) A depiction of the location of the MPER and the MPER sequences inserted into the HIV-2/HIV-1 MPER chimeric viruses and of the location of the mutations used for mapping the V2/glycan site and V3/glycan epitopes. C, constant region; V, variable loop; HR, heptad repeat; TM, transmembrane domain; CT, cytoplasmic tail. (B) The distribution of anti-MPER ID50 (log scale) is shown, using the highest of the three ID50 values obtained against the three HIV-2/HIV-1 MPER chimeric viruses. Gray shading indicates at what level samples were scored positive for anti-MPER antibodies (ID50 > 1,000). (C, D, and E) The distribution of drops in neutralization due to the introduction of the N160A/K (C), K/I169E (D), or N301A/N332A (E) mutation compared to the unmutated parent virus. Gray shading indicates at what level samples were scored positive for the indicated mapping mutant (≥3-fold drop compared to unmutated parent virus). If mapping of more than one virus was measured, the maximum fold drop is shown, except when the maximum was less than 3 and the minimum was less than 1; minimum fold drop is shown in order to display presumed masking of neutralization epitopes by glycans. Values below 1 indicate an increase in neutralization of the mutant virus compared to the parent.
FIG 4
FIG 4
Verification of anti-MPER neutralizing antibodies in samples recognizing HIV-2/HIV-1 MPER chimeric viruses. Data represent comparison of ID50-recognizing HIV-2/HIV-1 MPER chimeric target viruses (top; C1C ID50) to tests for dominant anti-MPER neutralizing antibodies measured by bead depletion with anti-MPER coated beads. Fold depletion of neutralizing activity compared to control bead depleted sera is displayed. Depletion of activity against HIV-2/HIV-1 chimeric viruses is displayed to indicate the level of depletion of anti-MPER activity. Tests for depletion of activity against 7 to 11 HIV-1 pseudoviruses are shown, with a >2-fold drop in activity accepted as positive. SF162.L.S was used as a negative control (neg con) for depletion because it is usually recognized by anti-V3 loop neutralizing antibodies (65). The subtype and tier (overall neutralization resistance [28]) of each HIV-1 test virus are indicated. BS50 is a subtype CRF02_AG-infected plasma sample from Cameroon. Neutralization of the Yu2 MPER-swapped chimeric construct (C1) is shown for that plasma sample instead of neutralization of the C1C construct, which contains a consensus C MPER sequence. VR, the virus is resistant to neutralization by the corresponding sample; ND, not determined; num, number; depl, depletion. Color coding: red, >10-fold drop; yellow: 2-to-10-fold drop; gray, <2-fold drop or virus resistant.
FIG 5
FIG 5
Differences in neutralization breadth and potency between groups of sera recognizing particular targets. Data represent the results of comparison of the distributions of neutralization breadth scores (A, C, and E) and neutralization potency scores (B, D, and F) based upon detection of functional anti-MPER antibodies (A and B), dominant anti-V3/glycan antibodies (C and D), or dominant anti-V2/glycan site antibodies (E and F). P values were calculated from Wilcoxon rank sum tests. neg, negative; pos, positive.
FIG 6
FIG 6
Changes in neutralization breadth and potency based upon recognition of MPER, the V2/glycan site, or the V3/glycans. We explored changes in neutralization breadth (A) and potency (B) based upon target mapping of the neutralizing antibodies in each serum. The groups that were compared are indicated on the y axis. The differences in neutralization breadth between the indicated groups are indicated by the differences in the number of viruses neutralized (no difference = 0), and the difference in neutralization potency is indicated by the ratio of aggregate geometric mean ID50 values to those seen with the panel viruses (no difference = 1). Values of 95% prediction intervals (PI) are shown and indicate the bootstrap-based estimate of the error associated with the ID50 prediction algorithm in this data set. g, glycan; g-site, glycan site.

References

    1. Burton DR, Ahmed R, Barouch DH, Butera ST, Crotty S, Godzik A, Kaufmann DE, McElrath MJ, Nussenzweig MC, Pulendran B, Scanlan CN, Schief WR, Silvestri G, Streeck H, Walker BD, Walker LM, Ward AB, Wilson IA, Wyatt R. 2012. A blueprint for HIV vaccine discovery. Cell Host Microbe 12:396–407. doi: 10.1016/j.chom.2012.09.008. - DOI - PMC - PubMed
    1. Mascola JR, Haynes BF. 2013. HIV-1 neutralizing antibodies: understanding nature's pathways. Immunol Rev 254:225–244. doi: 10.1111/imr.12075. - DOI - PMC - PubMed
    1. Haynes BF, Moody MA, Alam M, Bonsignori M, Verkoczy L, Ferrari G, Gao F, Tomaras GD, Liao HX, Kelsoe G. 2014. Progress in HIV-1 vaccine development. J Allergy Clin Immunol 134:3–10. doi: 10.1016/j.jaci.2014.04.025. - DOI - PMC - PubMed
    1. Mouquet H. 2014. Antibody B cell responses in HIV-1 infection. Trends Immunol 35:549–561. doi: 10.1016/j.it.2014.08.007. - DOI - PubMed
    1. Huang J, Kang BH, Pancera M, Lee JH, Tong T, Feng Y, Georgiev IS, Chuang GY, Druz A, Doria-Rose NA, Laub L, Sliepen K, van Gils MJ, de la Pena AT, Derking R, Klasse PJ, Migueles SA, Bailer RT, Alam M, Pugach P, Haynes BF, Wyatt RT, Sanders RW, Binley JM, Ward AB, Mascola JR, Kwong PD, Connors M. 2014. Broad and potent HIV-1 neutralization by a human antibody that binds the gp41-gp120 interface. Nature 515:138–142. doi: 10.1038/nature13601. - DOI - PMC - PubMed

Publication types

MeSH terms