. 2015 Feb 11;7(274):274ra17.
doi: 10.1126/scitranslmed.aaa1009.

Glutamine-based PET imaging facilitates enhanced metabolic evaluation of gliomas in vivo

Affiliations

Glutamine-based PET imaging facilitates enhanced metabolic evaluation of gliomas in vivo

Sriram Venneti et al. Sci Transl Med. .

Abstract

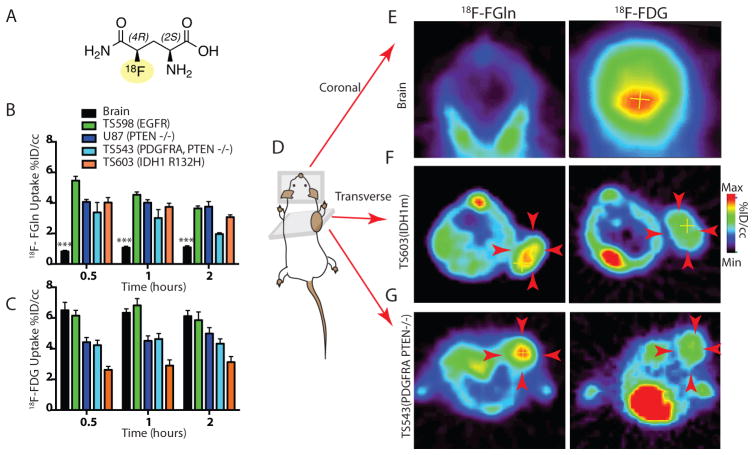
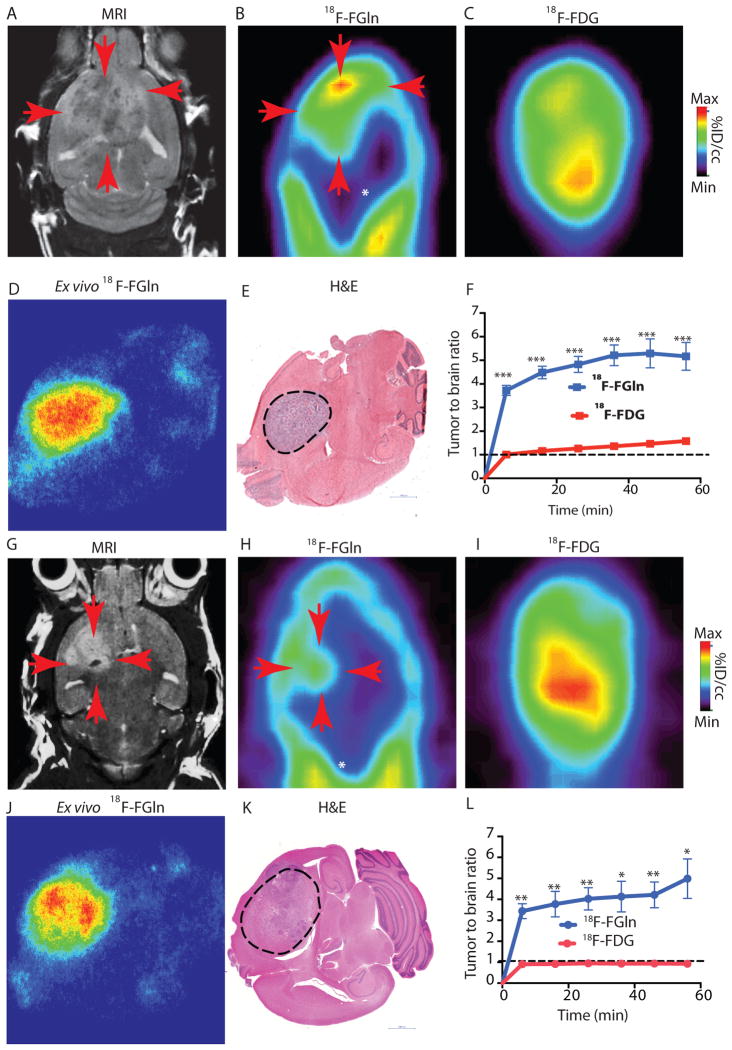
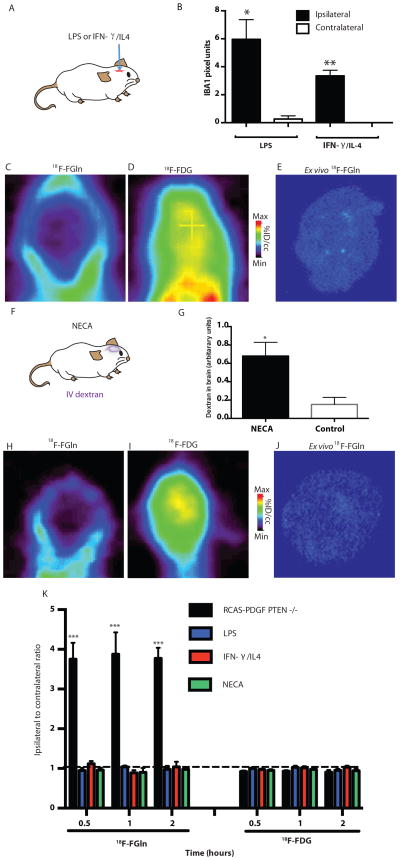
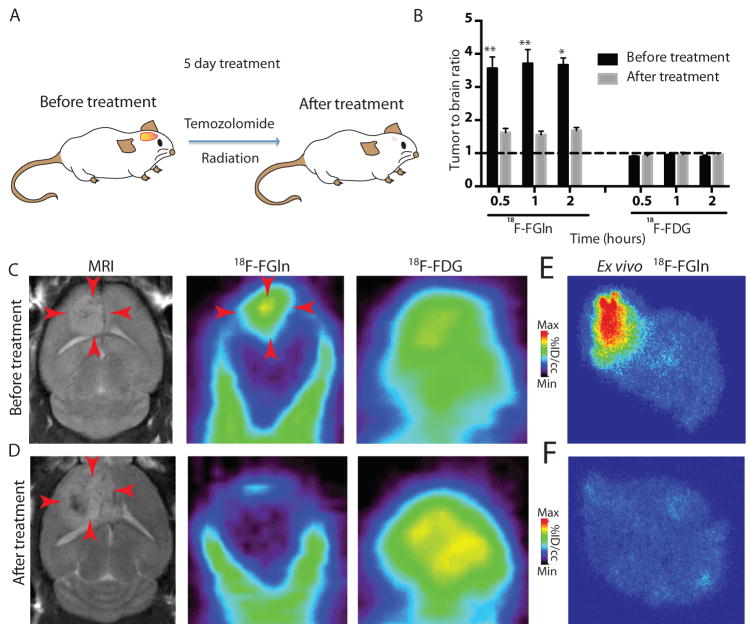
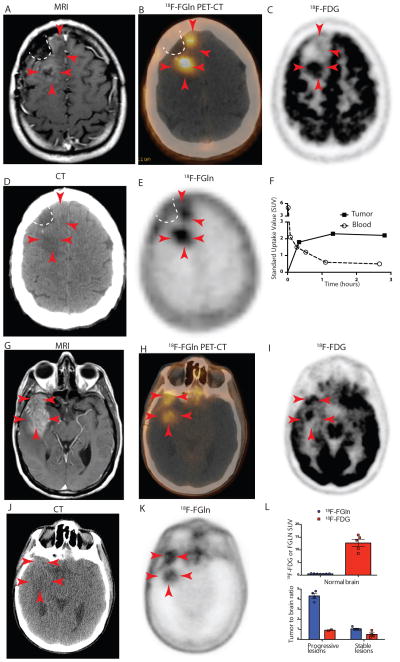
Glucose and glutamine are the two principal nutrients that cancer cells use to proliferate and survive. Many cancers show altered glucose metabolism, which constitutes the basis for in vivo positron emission tomography (PET) imaging with (18)F-fluorodeoxyglucose ((18)F-FDG). However, (18)F-FDG is ineffective in evaluating gliomas because of high background uptake in the brain. Glutamine metabolism is also altered in many cancers, and we demonstrate that PET imaging in vivo with the glutamine analog 4-(18)F-(2S,4R)-fluoroglutamine ((18)F-FGln) shows high uptake in gliomas but low background brain uptake, facilitating clear tumor delineation. Chemo/radiation therapy reduced (18)F-FGln tumor avidity, corresponding with decreased tumor burden. (18)F-FGln uptake was not observed in animals with a permeable blood-brain barrier or neuroinflammation. We translated these findings to human subjects, where (18)F-FGln showed high tumor/background ratios with minimal uptake in the surrounding brain in human glioma patients with progressive disease. These data suggest that (18)F-FGln is avidly taken up by gliomas, can be used to assess metabolic nutrient uptake in gliomas in vivo, and may serve as a valuable tool in the clinical management of gliomas.


Conflict of interest statement

Competing interests

C.B.T is co-founder of Agios Pharmaceuticals and has financial interest in Agios. The other authors of this study declare that they have no competing interests.

Figures

Fig 1
Fig 1. 18F-FGln shows high uptake in glioma xenografts and low background in normal brain
A. Illustration of the structure of 18F-FGln. B. Comparison of 18F-FGln uptake at 0.5, 1, and 2 hours after injection in the normal brain (black bars, n=6 for all time points) with glioma xenografts: TS598 with EGFR amplification (green bars, n=6 for all time points), U-87 MG with PTEN deletion (dark blue bars, n=5 for all time points), TS543 with PDGFRA amplification and PTEN deletion (light blue bars, n=5 for 0.5 and 1 h time points, n=4 for 2 h time point), and TS603 with IDH1 R132H mutations (orange bars, n=5 for all time points). %ID/cc: percent injected dose/cubic centimeter. Statistical significance was determined by two-sided ANOVA; *** indicates p < 0.001. C. Comparison of 18F-FDG uptake at 0.5, 1, and 2 hours after injection in the normal brain (black bars, n=6 for all time points) with glioma xenografts: TS598 with EGFR amplification (green bars, n=3 for 0.5 and 1 h and n=6 for 2 h), U-87 MG with PTEN deletion (dark blue bars, n=5 for all time points), TS543 with PDGFRA amplification and PTEN deletion (light blue bars, n=6 for 0.5 h and n=4 for 1 h and 2 h time points), and TS603 with IDH1 R132H mutations (orange bars, n=5 for all time points) %ID/cc: percent injected dose/cubic centimeter. D. Illustration of mouse with glioma xenograft implanted in the shoulder region, indicating coronal and transverse planes along which PET images were captured. E. Representative coronal PET images of the normal skull and brain depicting 18F-FGln and 18F-FDG uptake. F. Representative transverse PET images (see figure S5 for full body coronal images) showing 18F-FGln and 18F-FDG uptake in TS603 (IDH1 R132H) glioma xenografts (indicated by red arrows). G. Representative transverse PET images (see figure S5 for full body coronal images) showing 18F-FGln and 18F-FDG uptake in TS543 (PDGFRA, PTEN −/−) glioma xenografts (indicated by red arrows). For all graphs, data are represented as the means ± s.e.m.
Fig 2
Fig 2. 18F-FGln shows high tumor uptake compared to background in gliomas
A. Representative coronal MRI depicting tumor (red arrows) in genetically engineered RCAS-PDGF, PTEN −/− mice. B. Coronal 18F-FGln PET image illustrating high tumor uptake (red arrows) compared to surrounding non-neoplastic brain (white asterisk). C. Coronal 18F-FDG PET image from the same animal. D. Representative ex-vivo 18F-FGln autoradiogram from a RCAS-PDGF PTEN −/− animal. E. Histological section from the same animal depicted in D, showing the tumor region (dotted black line). Scale bars represent 1000 μM. F. Time activity curve illustrating tumor to background ratio with 18F-FGln (blue) compared to 18F-FDG (red) in RCAS-PDGF PTEN null animals (n=6 each). Dotted black line indicates an equal tumor to brain ratio of 1:1. Statistical significance was determined by two-sided, unpaired, Student’s t-test; *** indicates p < 0.0001. G. Representative coronal MRI showing tumor (red arrows) in mice orthotopically implanted with TS603 (IDH1 R132H) glioma cells. H. Coronal 18F-FGln PET image from the same animal illustrating high tumor uptake (red arrows) compared to surrounding non-neoplastic brain (white asterisk). I. Coronal 18F-FDG PET image from the same animal. J. Ex-vivo 18F-FGln autoradiogram from the same animal. K. Histological section from the same animal. Scale bars represent 1000 μM. L. Time activity curve illustrating tumor to background ratio with 18F-FGln (blue, (n=4 for 36 minute imaging time point, n=3 for all other time points) compared to 18F-FDG (red, n=3 for all time points) in mice orthotopically implanted with TS603 (IDH1 R132H) glioma cells. Dotted black line indicates an equal tumor to brain ratio of 1:1. Statistical significance was determined by two-sided, unpaired, Student’s t-test; * indicates p< 0.05 and ** p<0.01. For all graphs, data are represented as the means ± s.e.m.
Fig 3
Fig 3. 18F-FGln shows no uptake in animals with neuroinflammation or a disrupted BBB
A. Animal models of neuroinflammation were created by intra-cerebral injection of LPS or a combination of IFN-γ and IL4. B. Quantification of IBA1-positive activated microglia/macrophages at the site ipsilateral to the lesion (black bars) or contralateral to the lesion (white bars) from animals injected with LPS (n=3) or IFN-γ/IL4 (n=3). Statistical significance was determined by two-sided, unpaired Student’s t-test; * indicates p< 0.05 and ** p<0.01. C. Representative coronal 18F-FGln PET image from an LPS-injected animal. D. Representative 18F-FDG PET image from the same animal. E. Representative ex-vivo 18F-FGln autoradiogram from the same animal. F. Blood brain barrier was disrupted (as measured by extracerebral IV dextran) by treating animals with NECA [1-(6-amino-9H-purin-9-yl)-1-deoxy-N-ethyl-β-D-ribofuranuronamide], a combined A1 and A2 adenosine receptor agonist that increases BBB permeability by increasing spaces between endothelial cells. G. Measurement of extracerebral IV dextran in NECA-treated or vehicle-treated animals (n=3, each condition). Statistical significance was determined by two-sided, unpaired Student’s t-test; * indicates p< 0.05 H. Representative coronal 18F-FGln PET image from a NECA-injected animal. I. Representative 18F-FDG PET image from the same animal. J. Representative ex-vivo 18F-FGln autoradiogram from the same animal. K. Comparison of 18F-FGln uptake and 18F-FDG uptake in RCAS-PDGF, PTEN −/− (black bars, n=6 for 18F-FGln and n=5 for 18F-FDG at all time points) with animals injected intra-cerebrally with LPS (blue bars, for both 18F-FGln and 18F-FDG n=5 at 0.5 h, n= 4 at 1 h, n=4 at 2 h) or IFN-γ/IL4 (red bars, n=6 for18F-FGln at all time points; for 18F-FDG, n=5 at 0.5 h, and n=6 at 1 h and 2 h), or intravenously with NECA (green bars, n=5 for 18F-FGln and n =4 for 18F-FDG at all time points). Dotted black line indicates an equivalent lesion to brain ratio of 1:1. Statistical significance was determined by two-sided ANOVA. For all graphs, data are represented as the means ± s.e.m. *** indicates p<0.001.
Fig 4
Fig 4. 18F-FGln uptake in gliomas is reduced after chemo/radiation therapy
A. Treatment regimen in RCAS-PDGF, PTEN −/− mice consisted of 5 days of chemotherapy (temozolomide 50 mg/ml) and radiation therapy (155 cGy). B. The same animal was imaged with either 18F-FGln or 18F-FDG before treatment (black bars, n=8 for 18F-FGln and n=6 for 18F-FDG for all time points) and after treatment (gray bars, n=9 for 18F-FGln for 0.5 and 1 h and n=6 for 2 h time points and n=6 for 18F-FDG for all time points). Dotted black line indicates an equivalent tumor to brain ratio of 1:1. For all graphs, data are represented as the means ± s.e.m. Statistical significance was determined by Wilcoxon matched-pairs signed rank t test (because the same animal was imaged before and after treatment), * indicates p< 0.05 and ** p<0.01. C. Representative before-treatment images of MRI, 18F-FGln PET, and 18F-FDG PET (red arrows indicate identifiable lesion). D. Representative after-treatment images of MRI (red arrows show post-treatment changes), 18F-FGln PET, and 18F-FDG PET. E. Ex-vivo 18F-FGln autoradiogram from a different animal before treatment. F. Ex-vivo 18F-FGln autoradiogram from a different animal after treatment.
Fig 5
Fig 5. 18F-FGln shows uptake in human gliomas undergoing progression
A–F. Images from patient #5 A. T1-weighted MRI with contrast enhancement from a 42-year-old IDH1-mutant oligodendroglioma patient showing tumor with minimal gadolinium enhancement (red arrows) along surgical cavity (indicated by white dotted line). B. Fusion 18F-FGln PET-CT showing 18F-FGln uptake in areas corresponding to tumor (red arrows). C. 18F-FDG PET image from the same patient showing high background brain avidity and tumor uptake in the posterior part of the tumor (3 red arrows), but not in the anterior portion (2 red arrows). D. CT scan used to generate the PET-CT fusion image in B. E. 18F-FGln PET showing high uptake in tumor with minimal uptake in the surrounding brain. F. Time activity curve indicating standard uptake values (SUV) corresponding to tumor (black squares) and blood (clear circles). G–K. Images from patient # 6 G. T1-weighted MRI with contrast enhancement from a 57-year-old glioblastoma patient showing tumor with gadolinium enhancement (red arrows). H. Fusion 18F-FGln PET-CT showing 18F-FGln uptake in areas corresponding to tumor. I. 18F-FDG PET image from same patient showing high background brain avidity and tumor uptake. J. CT scan used to generate the PET-CT fusion image in H. K. 18F-FGln PET showing high uptake in tumor with minimal uptake in the surrounding brain. L. Comparison of 18F-FGln (blue bars) and 18F-FDG (red bars) illustrates differences in background uptake with both ligands in normal brain (top panel) and tumor to brain ratios from 3 clinically stable glioma patients and 3 glioma patients with clinically progressive disease (bottom panel) (see Tables S1 and S2 for details). For all graphs, data are represented as the means ± s.e.m.

References

    1. Ward PS, Thompson CB. Metabolic reprogramming: a cancer hallmark even warburg did not anticipate. Cancer Cell. 2012;21:297–308. - PMC - PubMed
    1. Vander Heiden MG, Cantley LC, Thompson CB. Understanding the Warburg effect: the metabolic requirements of cell proliferation. Science. 2009;324:1029–1033. - PMC - PubMed
    1. Weber WA, Schwaiger M, Avril N. Quantitative assessment of tumor metabolism using FDG-PET imaging. Nuclear medicine and biology. 2000;27:683–687. - PubMed
    1. Klasner BD, Krause BJ, Beer AJ, Drzezga A. PET imaging of gliomas using novel tracers: a sleeping beauty waiting to be kissed. Expert review of anticancer therapy. 2010;10:609–613. - PubMed
    1. Petrirena GJ, Goldman S, Delattre JY. Advances in PET imaging of brain tumors: a referring physician’s perspective. Curr Opin Oncol. 2011;23:617–623. - PubMed

Publication types